
Automated trading verification ― Steps to test your own strategy Stocks
TrendSync ―― Buy and sell, verify, and plan your strategy
TrendSync's main feature is that after a trade, you can verify (check the answer for) that trade.
Up to now, we introduced why verification is important and what kind of strategies to trade with.
This time, the procedure for actually using that verification is shown.
What verification is and what it does
In a word, it is to reproduce, using actual price movements, “what would have happened if I had run with this strategy and this setup.”
Apply the chosen strategy to past or intraday data, and line up whether trades were executed, where buys/sells occurred, and what the profit or loss was.
If you compare with actual trades, you can gauge the accuracy of the reproduction.
The procedure is broadly three steps
- Choose the day and the asset to test. It can be the current day or a day with historical records.
- Choose the strategy and settings. Select the strategy, decide the take-profit and stop-loss ranges, and the timing to view.
- Run the verification and view the results. You get a list of trades, profits and losses, and any actual differences (if any).
By gradually changing the settings, you can run it as many times as you like. Since results are lined up for each attempt, you can compare and choose.
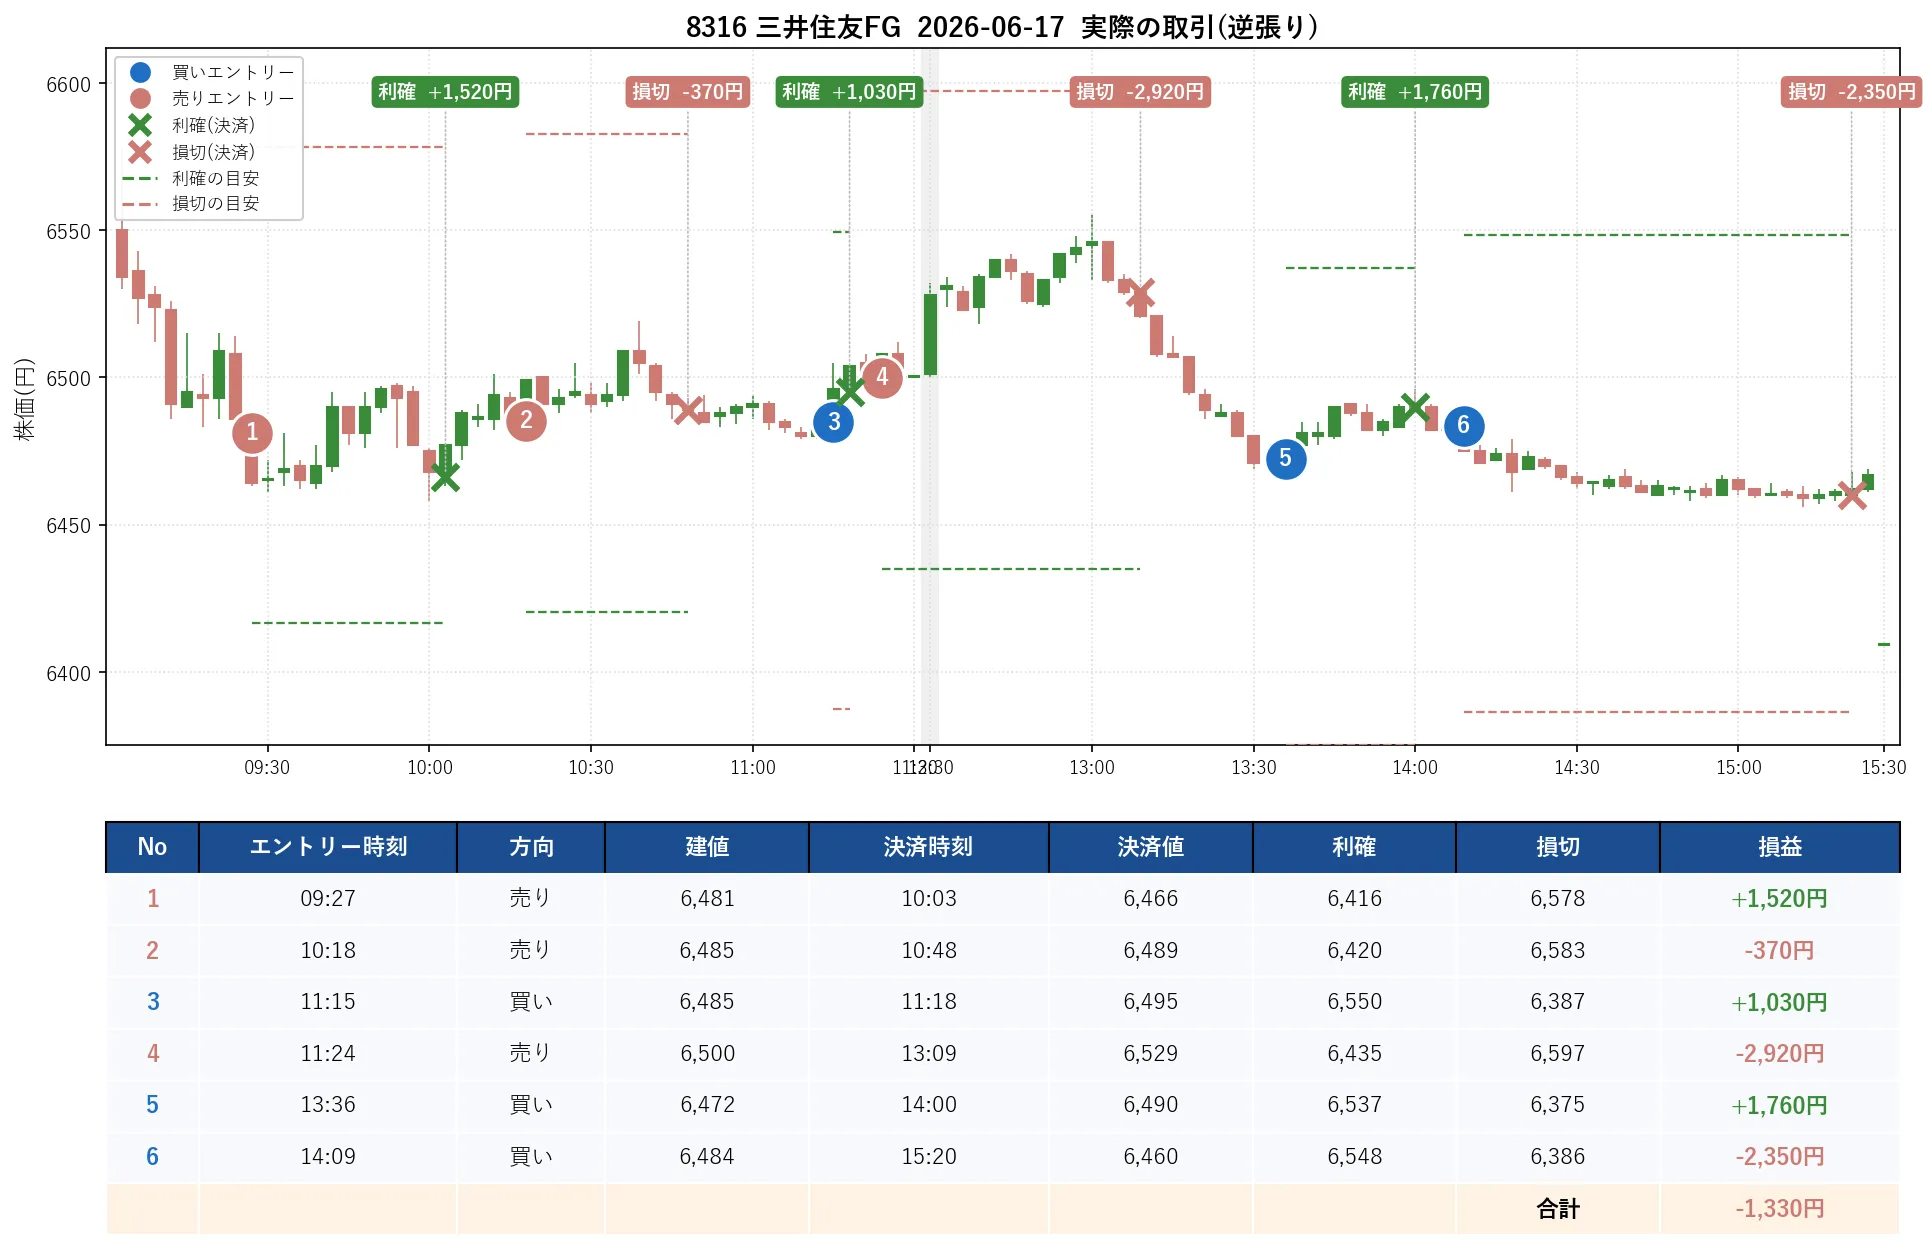
When you actually verify, the day's trades are summarized into one chart.
Here is the result of trading activity for a day with Sumitomo Mitsui Financial Group (8316).
Using an RSI counter-trend strategy, there were 6 buy/sell actions, and the actual profit and loss for that day was minus 1,330 yen.
The settings used at that time are as follows.
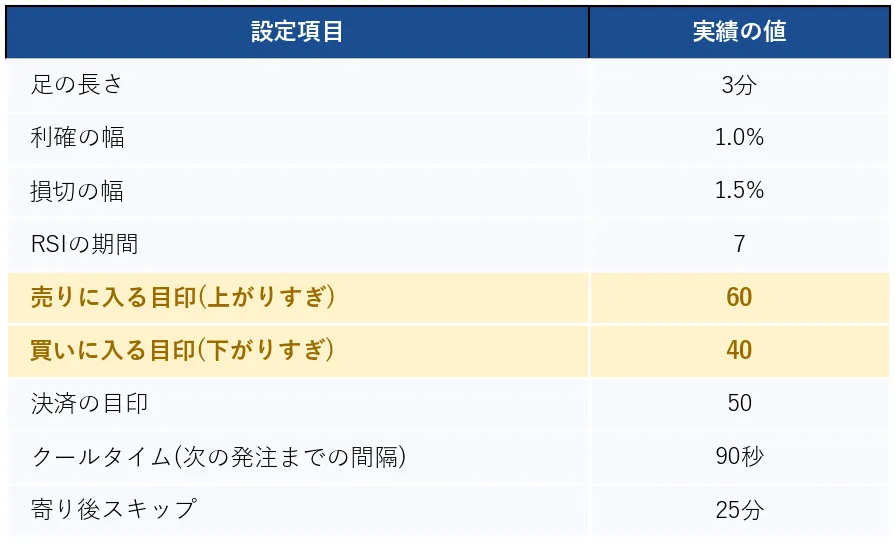
The entry signals (60 for overbought, 40 for oversold) were lenient, and trades were entered even on unclear overbought/oversold conditions.
Verification 1
Change only this entry signal from 60/40 to 65/35. A change to enter only on clear overbought/oversold conditions.
Set the parameters in TrendSync's verification screen and run the simulation.
Then, for the same day's trades, it becomes this.
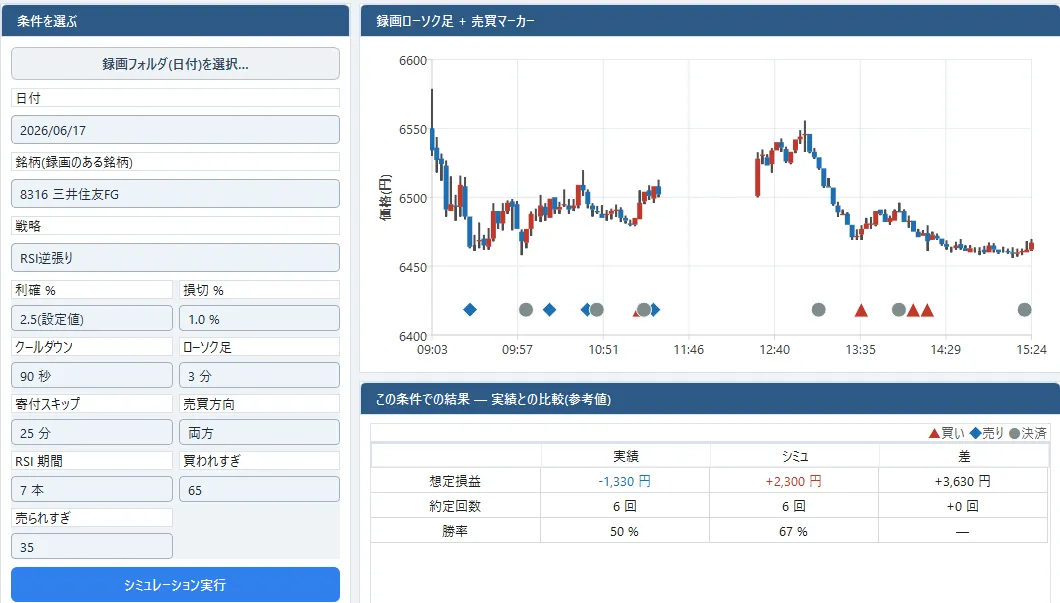
The total is plus 2,300 yen. Even on days you actually lose, tightening the entrance signal slightly changed the result.
You can try settings that you didn’t actually apply, using the same price movements. This is how verification is used.
What to be careful about in verification is not to decide based on a single day that happened to be favorable by chance.
If you apply the improved setting from Verification 1 (65/35) to another day...
On rising days and falling days, the gains are smaller. But on ranging days, it reverses to a loss of 6,000 yen. Even with market conditions similar to 6/17, the results can be completely opposite.
A setting that is favorable on one day is likely to fail on another day.
Therefore, test on multiple days—rising days, falling days, and ranging days—to ensure the setup doesn’t break significantly in any market.
Verification is not a one-time thing. You can and should iterate by changing the settings slightly and running it again and again.
As many trials as you run, the results line up for comparison.
The more you operate it yourself, the closer you can bring the settings to match the day’s market conditions.
Summary
Verification is not to decide a strategy, but to polish it while confirming its validity.
Don’t be swayed by a single day’s result; test across multiple days and move toward grounded, robust settings.
Also, the trades shown in this article are just one example. Results vary with market conditions and settings, and profits are not guaranteed every time.
Next time, we will discuss how to minimize losses and design a defensive approach.