

Whether you can trade by interacting with charts like this determines 90% of trading.
 GoGoJun President Hayakawa and I's interview VTR can be viewed here
There are also free gifts available.
Good morning everyone.
This week, the USD/JPY moved sluggishly and did not expand its price range.
In other words, it was in a range, I suppose.
The Nikkei average ended about 3,000 yen below its peak.
Well, I think it’s enough to just be aware of stock prices.
FX trading, I believe, is not long-term investing, as in what people call investment.
Some may hold for several months, but I think staying within day trading or ultra-short-term trading or scalping is most appropriate.
In such a environment, if you are employed and do trading as a side activity, trading time becomes even more limited, so day trading is out, and ultra-short-term trading or scalping becomes the main battlefield, you know.
What traders should keep in mind in such an environment—I'll write about it this morning so you can apply it to your trades from Monday onward.
This is my own way of thinking, of course there are various perspectives, but my trading outer shell? big-picture? general impression?
These are constructed in my mind according to the “Oku-Tre Chart” and “Oku-Tre Line” from the book “New Billionaire Trader’s Scalping with Volume Plus.” Readers, whether you are Oku-Tre users or not, can form your own chart image in your head as you read.
Before trading, in my head I think
“If this happens, I will do this.”
If this happens, I will buy.
If this happens, I will sell.
I believe I have decided to take a position.
I’ve traded tens of thousands of times, so that may be considered a habit.
If you apply this to everyone, I think it’s before the preparation stage of trading, but deciding it beforehand makes trading easier and reduces opportunity losses.
I trade with such a habit, and I’d like to write about how I face the chart at that time.
This is because I believe all success in trading lies in hints from past charts.
Clarifying those hints is the “Oku-Tre,” but I’d like to write about how I actually face the chart, using Friday’s chart as a basis.
June 26 USD/JPY 1-hour & 1-minute charts
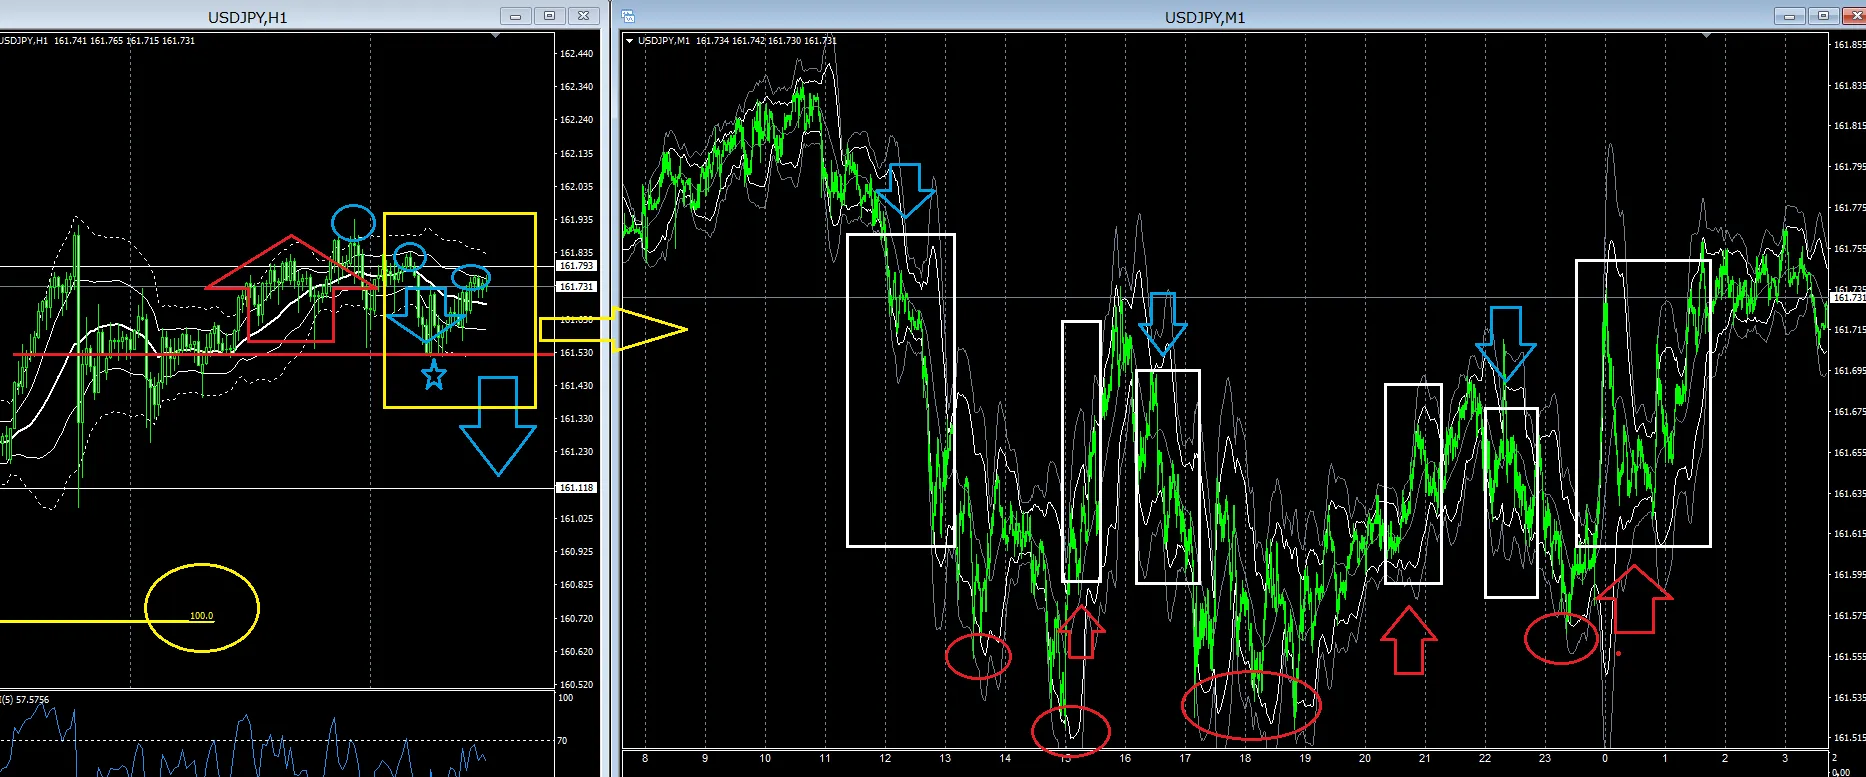
Well, this is a chart that has already closed, so it can be explained in many ways, but rather than that, please regard this as a chart for future use: looking at charts with this approach to form positions, a review and preview chart.
What I think on the left 1-hour chart.
The 100% yellow circle marks the price at the peak after a previous Bank of Japan intervention and the price had retraced all the way down; it has since moved slightly above that peak, and up to Friday the price has largely been in a range.
In short, the priority is to notice that it is in a range.
A range is characterized by failing to update recent highs and lows and staying flat.
Oku-Tre users should drill further and check what the red horizontal line near 16150 represents on their own charts.
This price acts as a “support” in Oku-Tre charts.
This can be identified quite early.
Specifically, it is a support to be aware of since June 23.
On the 1-hour chart, you can grasp this larger perspective.
Then, in the stage within yesterday (inside the yellow square), the blue circle price could not make a new high, while the blue star marked a new low and rose.
That coincides with the 16150 support near there.
In detail, highs failed to be updated and trended lower, lows continued to make new lows, a downtrend with a pullback that ended by Saturday morning.
Even from the 1-hour chart alone, this information is available.
Also from the Tokyo open on Friday, you can see that the leftmost blue high did not get surpassed and the price fell.
Whether the leftmost high is surpassed or not is crucial.
Since it did not surpass and seems unlikely to, my mind judges it as a decline and I head toward a short position.
If that short position is to take a position, what would be the mindset?
The right chart is a 1-minute chart, where the white square indicates a move that can be bought or sold according to Oku-Tre Lines.
Since the 1-hour chart has not updated the high, it is a potential-down scenario, so I would generally want to sell at higher levels.
These exist at the blue downward arrow white square and above, but I decide to take a position when I see a peak and expect a drop based on the Oku-Tre chart and line.
I apply this logic in every situation.
There is a down-move possibility, but since the 1-hour red horizontal line acts as support, I also look for a downside position after the drop as a counter-trend move.
Of course, once the Oku-Tre chart changes from sell to buy, my ideal is around the red circle, near the 1-hour chart support, to take a large L-position with a stop placed at a V-shaped break.
From Friday's completed chart, you can do this kind of preview and review,
and I think I always face the chart with this kind of thinking.
I say I think because it’s almost like a habit, something I do subconsciously.
It may be a roundabout way of saying it, but it could also be called a “scenario” in general.
Before taking a position, I think it’s quite important to have my thoughts organized.
If organized, even mistakes can be carried out easily and the loss can be set at a predetermined price.
There are various patterns, but once you see them, you should decide for yourself what to do.
Thank you for today as well.
I highly recommend my product to traders who simply want to succeed in trading or be able to make a living from trading; this is a trade technique that can be learned on your own, and it is this: