
June 29 (Mon): 【BB&HM】 Nikkei 225 VS Russell 2000
This time
we compare with the so-called “canary in the coal mine” in a bear market
“Russell2000”
as a comparison.
【Overall Scenario Probability】
This week's overall market is…
“Rising: 45% / Falling: 55%”
※ Although the -2σ pullback in NASDAQ and S&P 500 widening and a 1:1 N-wave decline scenario suggest downward pressure, the upward-dominant waveforms of NY Dow and Russell2000 are opposing each other.
※ Presented as a reference level.
【This Week's Market Focus Points】
Among the four major US indices this week, NASDAQ, S&P 500, NY Dow, and Russell2000 show different movements, making it difficult to judge the direction. Normally the Russell2000, known as the “canary in the coal mine,” leads and tends to turn down, but this time NASDAQ and S&P 500 are leading, which raises questions about whether this signals a market-wide reversal.
In the Nikkei 225, the short-term chart shows important signals, and reaching key levels is approaching. The U.S. 10-year yield is also at a critical juncture, and this week's movements are likely to greatly influence future markets. Details will be explained in the paid section.
➥The continuation is explained in detail in the members-only report.
If you are not yet registered, please click here ↓
【Integrated Version】
'Why does the market stop there?' Bollinger Bands × Harmonics: a fusion of statistics and geometry to capture turning points with high precision!
https://www.gogojungle.co.jp/finance/navi/series/1613?via=articles_detail_aside
【Announcement】
【YOSSY】 Harmonic AutoDrawing System
will be updated!!!
You will be able to grasp all situations via alerts!
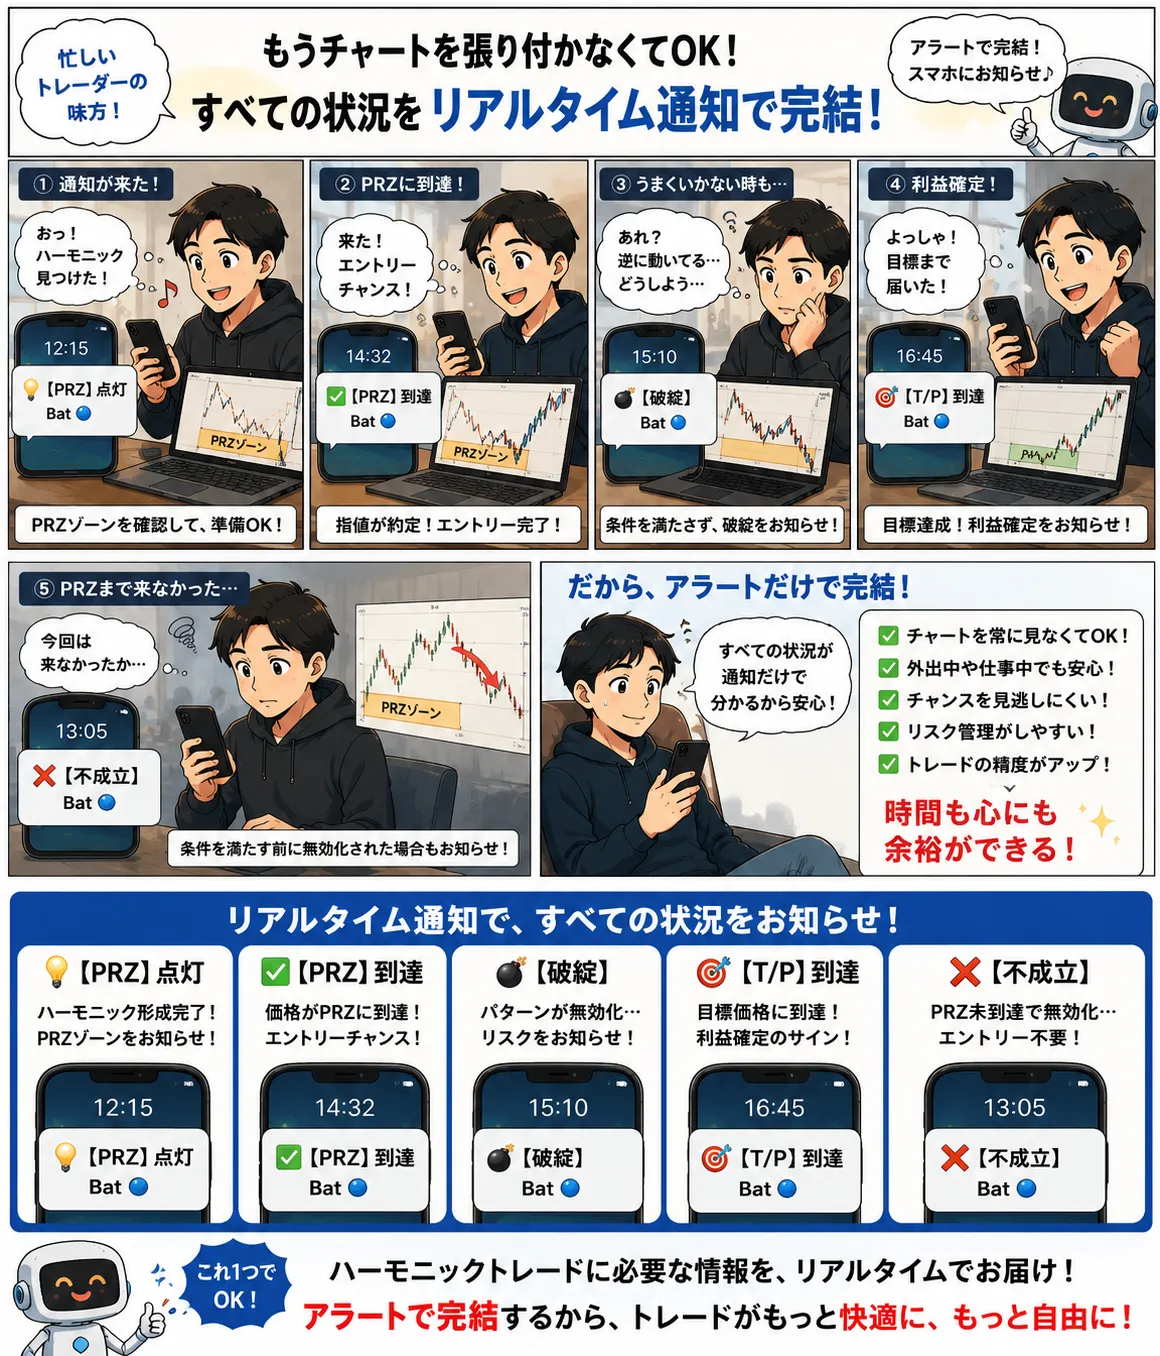
Stay tuned!
(※ The following is for members only.)
---------------------------------------------
【Environmental Awareness】