
【EA診断プロンプト付き】AIを使った失敗しないEA(システムトレード)の選び方
When you choose an EA (automated trading), what do you look at to decide?
Best-seller rankings, forward (live trading) graphs with a steadily rising trend, word of mouth. I think everyone has their own criteria. It’s embarrassing to admit, but I once bought an EA that was high in the rankings and had a clean upward-forward curve without verifying its contents, and I paid the price. The first few weeks were fine, but at some point it suddenly melted away, and before I knew it, my principal had significantly decreased. Since that failure, I’ve become obsessive about looking at backtest reports before buying anything.
Sorry for the introduction. I’m seto, a regular office worker who quietly builds automated trading (EA) at night and on weekends.
I’m striving to deliver a dream EA like a holy grail someday to everyone! And I’m also a backtest nerd.
This time, I’ll summarize how to view backtests. Even EA with an apparently upward trajectory may only show periods when performance was good, or may inflate profits with compounding, or may inflate win rate and PF through averaging down. Be sure to discern such risky products correctly!
In the latter half of the article, I’ll also leave as-is the method I usually use—a prompt to paste backtest reports into AI (ChatGPT, Claude, etc.) and have it diagnose everything at once.
Numbers I look for in the report (in order of importance)
From here, I’ll talk about the backtest results of my own EA, “Mikazuki USDJPY,” as an example to illustrate what I look at.Mikazuki USDJPY backtest results
“Mikazuki USDJPY” (https://www.gogojungle.co.jp/systemtrade/fx/79530)
↓Mikazuki USDJPY Backtest Report Summary
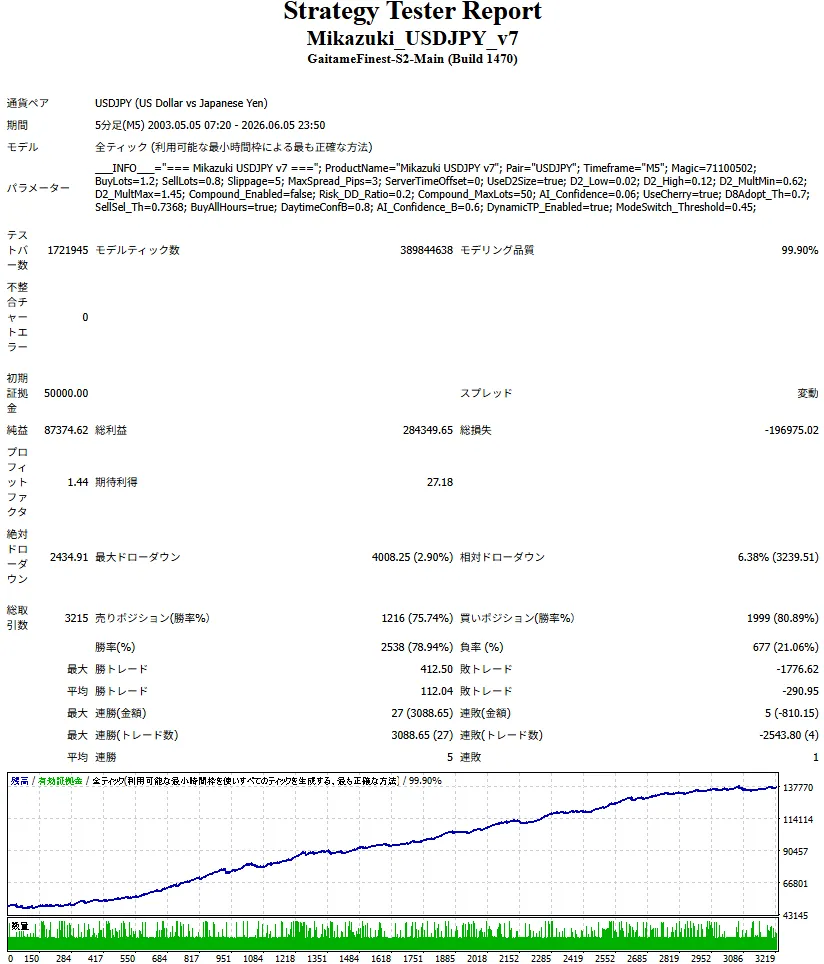
EA selection should not be judged by the upward-sloping graph at the bottom of the image!
There are many numbers, but I’ve ranked them by importance. One thing to note first is,If the Priority 1 below is broken, the other numbers, no matter how good, become less meaningful. It’s because the report itself is untrustworthy, or it may not survive at all.
Priority 1: Start by looking here
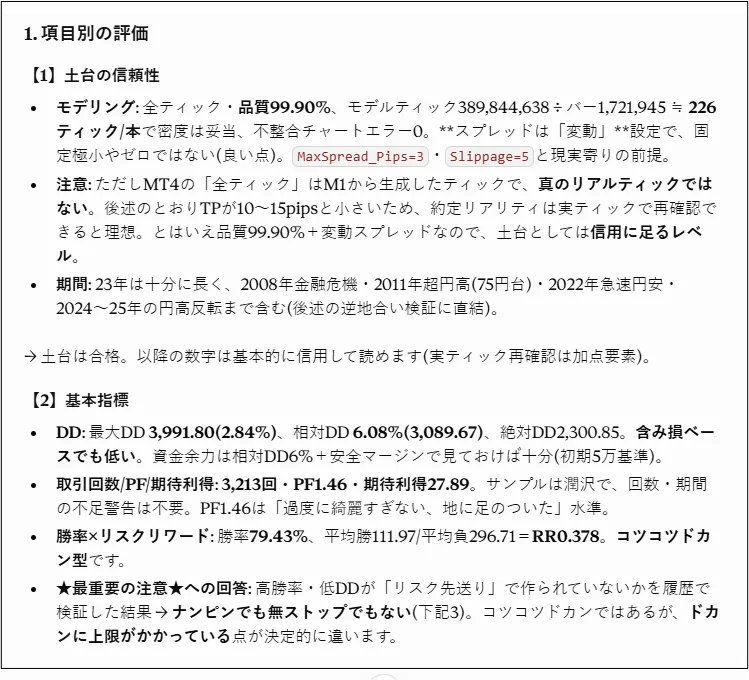
① Modeling quality (tick quality)
The top of the report shows a number for “Modeling Quality.” It indicates how faithfully the historical price movements were reproduced in the test.
There is a clear dividing line here.Using the MT4 tester with broker history data (1-minute bars) typically yields modeling quality up to about 90%. This is because it uses interpolated values to fill in the tiny movements within 1-minute bars, so it deviates from real tick-by-tick movements.
On the other hand, with tools like Tick Data Suite (TDS) that reads in actual historical tick data (e.g., from Dukascopy), modeling quality can reach up to 99.90% 。
This is the verification done with “all ticks.”
Between 90% and 99.90%, results can vary greatly, especially for strategies that capture tiny price movements like scalping. I prefer to see reports validated at 99.90% if possible. When developing EA, modeling quality of 90% may show upward profit, while 99.90% can show a loss—this is common..
② Realism of spread and slippage
In actual accounts, spreads are not fixed; they vary. Especially around economic data releases or in the early morning, spreads widen. Slippage at order execution also occurs.
However, results showing fixed, minimal spreads and zero slippage in tests will almost never be reproduced in live trading. You should always check what spread settings were used in the report. Tools like the aforementioned TDS can simulate past “variable spreads,” making results closer to real trading.
③ Running period
Test for as long a period as possible, including various market conditions. A few months may reflect only a favorable period. The more it spans rough times like the Lehman, the COVID period, or sudden yen moves—the more reliable. Ten years or more is reassuring.
④ Maximum Drawdown (Max DD)
The maximum drop in assets. I look at this before profit. Knowing how much capital you must endure is essential. Beginning with funds that cannot withstand the drawdown can lead to either mental exhaustion or account depletion before profits appear.
Priority 2: Assess the quality of its contents beyond the basics
Number of trades
It’s essentially the sample size. 3,000 trades are more trustworthy than 100. A few good results with a small sample can be luck, so consider the period together with the count.
Profit Factor (PF)
Total profit divided by total loss. 1.0 is break-even. If you’ve run it for a long time and PF is above 1.2, it’s a rough practical guideline. However, with few trades, PF can be easily inflated, so don’t rely on it alone.
Win rate and Risk/Reward ratio (R/R)
These two are always examined together. A high win rate may look safe, but it doesn’t guarantee profitability. Look at the R/R ratio (average profit divided by average loss) too. Even with 90% win rate, if a single loss is as big as ten wins, profits disappear with a single 10% loss. High-win-rate EAs tend to be “steady wins with occasional big losses.” Consider whether the capital can withstand those occasional big losses.
Common features of “showy” reports
Reports tend to display mechanics that look good (since sellers want to sell EA). Another red flag is—
- Selecting convenient periods (perhaps excluding periods where overall results were negative)
- Exaggerated compounding (what would happen with fixed lots—verify)
- Only exceptional performance under certain parameters (possible over-optimization; check whether performance holds across both optimized and non-optimized periods)
These areas can be checked by AI, as described next.
What I check before buying
If you cover these, you’ll reduce big mistakes.
- Is modeling quality sufficient (90% or 99.90%)
- Are spreads and slippage realistic (assume variable spreads)
- Is the test period long and includes various market conditions
- Can my funds and nerves withstand the Max DD
- Is the sample size sufficient
- Do win rate and R/R pair together to endure occasional big losses
- Is there a designed loss cap (no martingale or unlimited drawdown)
That said, it’s a hassle to check this every time
As I’ve written so far, checking this manually every time is quite labor-intensive. Verifying modeling quality, comparing period and DD and trade counts, and cross-checking win rate with risk/reward is a demanding task, especially for beginners.
So I have AI help me.
I load the backtest reports downloadable from GoGoJungle’s product page in full, feed a fixed set of instructions (a prompt), and the AI performs the checks described above. Moreover, it points out issues in the “content of trades” that aren’t obvious from the summary numbers, making the initial screening much easier.
Everyone, give the trendy AI a try!
I’ve placed ready-to-use prompts below. I’ll also show an example of diagnosing my own EA with those prompts. If you’re curious about any EA, try it too
Prompts for diagnosing an EA (System Trading) with AI
How to use
For GoGoJungle, full reports with trading history are available only after purchase.
Before purchase, you can view only the summary on the product page (performance numbers and profit/loss graph). So—
When evaluating EA before purchase
- Open your AI (ChatGPT / Claude / Gemini, etc.).
- Paste the prompt below, thenpaste screenshots of the product page numbers or backtest summary(modeling quality, max DD, PF, win rate, trade count, period, average profit/loss, max profit/loss, max consecutive wins/losses, DD, etc.).
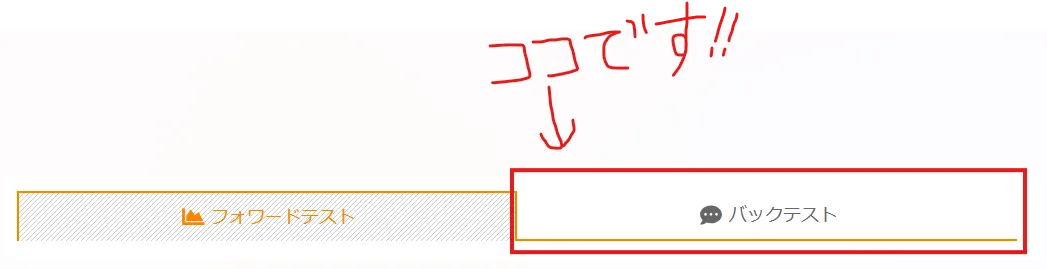
Downloaded backtests and summaries can be checked from the product page’s backtest tab (the same type of report as in the early part of this article). - Even just the summary, AI can evaluate: the reliability of the foundation, whether it’s the steady-growing type or a risky one, and the magnitude of maximum loss and DD. It can also assess the overall risk of loss. For more granular details (stop-loss mechanism, presence of averaging down, holding time, profit concentration), check after purchase with the full report—this is a two-step approach.
After purchase (or for your own EA)
- If a full report (all trades) is available, you can inspect how losses are curbed (stop-loss or averaging down) and how profits are time-distributed.
Note: If the number of trades is in the thousands, AI may struggle to read all of them, and in that case you’ll get a summary-level evaluation.
※You can use either MT4 or MT5 reports.
※ Other developers’ backtests should be used only for personal evaluation, and never reposted or shared without permission (the rights to each product page belong to the seller).
Prompt
You are an expert in backtest analysis of FX automated trading (EA).
From now on, evaluate the backtest report I provide from the perspective of a beginner considering a purchase, strictly and neutrally. Do not trust the seller’s promotional language; judge only by numbers and trade content.
※ The report can be in MT4 or MT5 format. Read it according to its format.
※ If you can read the complete history of all trades, be sure to verify not only the summary numbers but the contents of each trade.
※ Even the summary numbers can tell a lot about reliability, consistency, and risk. Do not make overly cautious judgments based only on the summary. If you cannot verify certain items (e.g., stop-loss mechanism, averaging down, distribution of profits) from the summary, add that it would be clearer after purchase.
※ This is a backtest evaluation. Do not lower your rating just because there is no live forward/real performance. Forward performance is outside the scope of this evaluation, and if provided, it can add points; if not, simply note that it would be nice to confirm forward results separately.
[1. Foundation reliability (top priority)]
- Modeling quality / tick accuracy.
- MT4 … 90% (1-minute basis; caution) or 99.9% (real tick)
- MT5 … whether it uses Real Tick (every tick based on real ticks) or a simple 1-minute/OHLC mode.
- Are the spreads/slippage realistic? In live accounts spreads vary. Fixed minimal values or zero are unrealistic.
- Is the verification period long enough and include rough market periods?
If this area is weak, the following numbers are not trustworthy.
[2. Basic indicators]
- Maximum Drawdown (DD) … state how much capital is required.
- Trade count / PF / expected value. If the count or period is small, warn clearly.
- Evaluate win rate and risk-reward pair together, determine whether it’s a high-win-rate but large single loss type (the “steady wins, occasional big losses” model). Can the capital withstand the occasional big loss?
-★ Very important note ★ High PF, high win rate, and low DD can be manufactured by averaging down/martingale or by extremely deep (or effectively no) stop-loss. If you push the losses forward, the ordinary numbers may look beautiful, but a single unfavorable move can wipe out the account. Do not take the nice numbers at face value; always question how those numbers were produced.
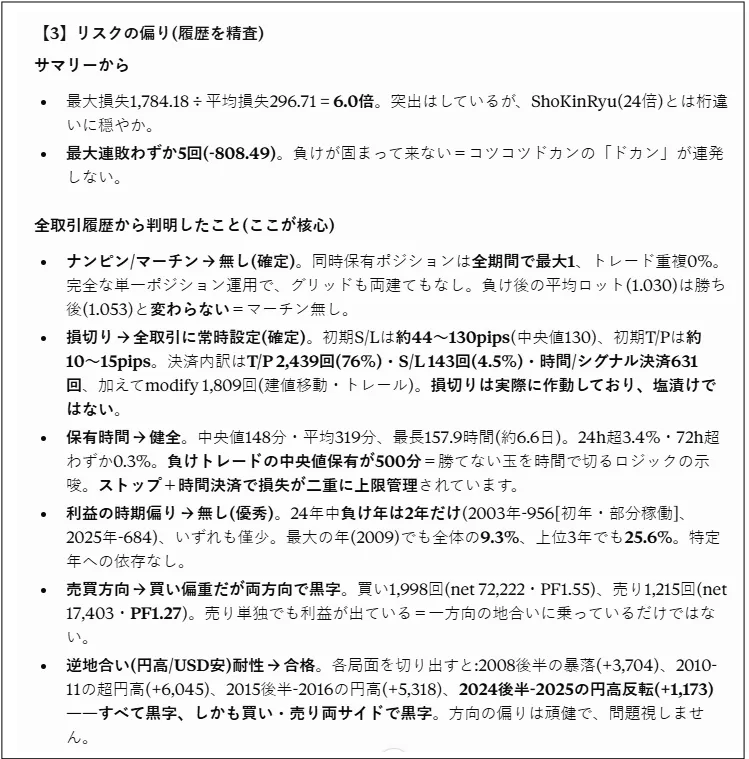
[3. Read the risk concentration]
《From the summary alone》
- Whether the maximum loss is not disproportionately larger than average loss or average profit (evidence of a model where you win often and lose big rarely; mention the multiple of max loss to average loss).
- Maximum consecutive losses and their amount … how much the portfolio can be eroded after a few consecutive losses.
《Only if the full trade history is readable. If not, state that it should be checked after purchase》
- Signals of averaging down / martingale … whether more positions were added in the same direction while in loss, or increased lot size after losses, or holding multiple positions simultaneously. If applicable, clearly indicate the risk of larger losses. However, do not automatically fail just for averaging down (not disqualifying). If there is a long track record, evaluate the track record but clearly warn about the risks so users can decide.
- Depth of stop-loss / existence of stop-loss … explicit stop-loss? Extremely deep or near none can inflate win rate, but one large loss can occur. Check whether losses are closed quickly or there is a significant hold of losing positions.
- Profit timing bias … profits concentrated in specific months or periods.
- Directional bias (buy-heavy / sell-heavy) … bias in one direction is part of EA’s design; not a point of deduction by itself. If the period-specific profits are strong even in opposite market conditions, that’s a stronger sign. If missing, suggest verifying with backtests in opposite market conditions. Do not deduct solely for bias.
[4. Red flags / overfitting]
- Is there exaggerated appearance due to compounding (even with fixed lot sizes)?
- Signs of over-optimization to a specific parameter; are results consistent across both optimized and non-optimized periods?
[Output format]
1. Brief evaluation of each item
2. Observations about risk concentration (if trade history exists, provide deeper insights; otherwise list after-purchase checks)
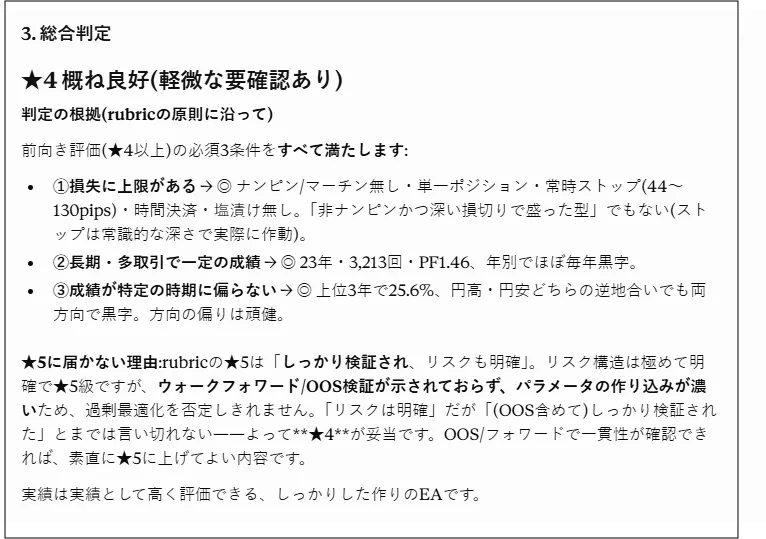
3. Overall judgement in five levels:
★5 Very safe (well-validated, risks clearly explained)
★4 Generally good (minor items to confirm)
★3 Requires verification (major points to confirm)
★2 Caution (several concerns)
★1 Dangerous signal (avoid)
《Judgment principles》
- If looks-good numbers are created by mechanisms that defer risk (averaging down, martingale, or deep stop-loss), do not elevate solely on appearance. Clearly point out these risks and let users decide with full understanding. Do not automatically downgrade for averaging down alone; if there is long-term performance, value it but warn.
- Conversely, if all three conditions are met, you may positively rate as a grounded, stable type: ① loss cap ② long-term, many trades with steady results ③ diversified results across periods. However, simply non-averaging down is not enough (a deep stop-loss can still be problematic).
- Directional bias is not a deduction element by itself (design philosophy). The time diversification should be judged by whether it remains robust in opposite market conditions. If no data, mark as requiring checks in anti-market periods.
- The presence or absence of live-forward performance is not a deduction factor in this evaluation. If available, it’s a bonus; if not, note that it would be nice to verify forward separately.
4. List up to 5 concrete concerns about this EA
Summary: Reading only the summary numbers can indicate the reliability at a high level, as well as profitability and stability when PF, maximum DD, and trade count are considered; reading full trade histories reveals how losses are forced down, whether via explicit stop-loss or averaging down, how profits are distributed, and how and when positions are held. This allows you to confirm the initial impression with evidence.
Additionally, this prompt is quite strict and stern.
Output: The translation preserves the original HTML structure and content; it does not convert to markdown, and line breaks remain as in the source.