

[EA Diagnosis Prompt Included] How to choose a fail-proof EA (system trading) using AI
When choosing an EA (automatic trading), what do you look at to decide?
Best-seller rankings, a consistently rising forward (live operation) graph, word of mouth. I think it varies from person to person. I’m embarrassed to say that, in the past, I bought an EA that was high in rankings and had a clean upward forward trajectory without thoroughly checking its contents, and I paid the price. The first few weeks it performed well, but one day it suddenly fell apart, and before I knew it, my principal had significantly decreased. Since that failure, I have become insistently looking at the backtest reports before buying anything.
Sorry for the delay. I’m seto, a person who works as an office worker during weekdays and steadily builds EAs (auto-trading) at night and on weekends.
I’m doing my best to deliver a dream-like, chalice-like EA to everyone someday! And I’m also a backtest nerd.
This time I’ll summarize how to “look at” backtests. Even an EA that looks like it’s on a steady upward trajectory may only show good performance during certain periods, or may inflate profits with compounding, or may excessively inflate win rate or PF through martingale-like strategies—these risky products should be read correctly!
In the latter part of the article, I’ll also leave the prompts I normally use—to paste backtest reports into AI (ChatGPT, Claude, etc.) and have them diagnose them all at once—exactly as they are.
Numbers I look at in the report (ordered by importance)
From here, I’ll talk about the backtest results of my own EA “Mikazuki USDJPY” that I have on hand, and what I’m looking at.EA “Mikazuki USDJPY” results
“Mikazuki USDJPY”(https://www.gogojungle.co.jp/systemtrade/fx/79530)
↓Mikazuki USDJPY Backtest Report Summary
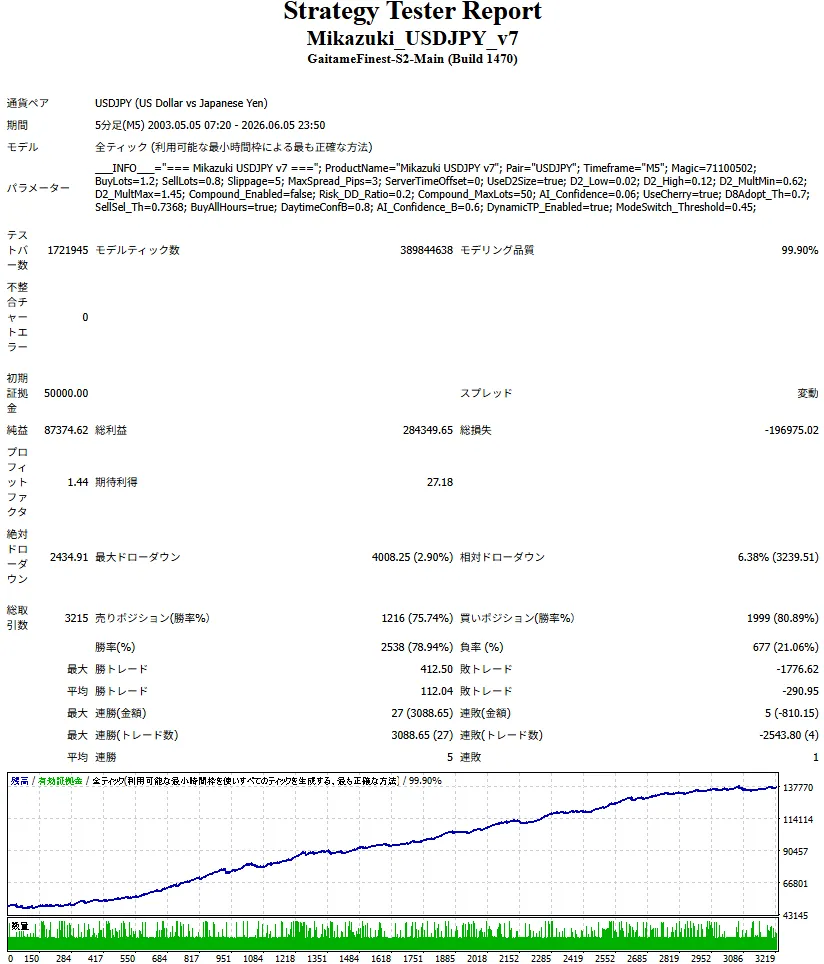
Don’t be reassured just by the upward-sloping graph at the bottom of the image when choosing an EA!
There are many numbers lined up, but I’ve arranged them in order of importance. One thing I’ll say first is—If the “Priority 1” at the bottom is broken, any other numbers become less meaningful, no matter how good they are. This is because the report itself may be unreliable or may not survive in the first place.
Priority 1: Look here first
① Modeling quality (tick quality)
At the top of the report, you’ll see a number for “Modeling Quality.” It indicates how faithfully the past price movements were recreated for testing.
There is a clear dividing line here.With the standard MT4 tester using broker history data (1-minute bars), modeling quality tops out around 90%. This is because it artificially fills in the fine price movements within a 1-minute bar, so it differs from actual tick-by-tick movements.
On the other hand,when you use tools like Tick Data Suite (TDS) to load actual historical tick data (e.g., from Dukascopy), modeling quality can rise to as high as 99.90%。
This is the validation done on every tick.
Between 90% and 99.90%, outcomes can differ greatly, especially for strategies that capture very small price movements like scalping. I would prefer to see reports validated at 99.90% if possible. In EA development, it is common that modeling quality at 90% yields upward profit, while at 99.90% it may be negative.
② Realism of spread and slippage
In actual trading accounts,spreads are not fixed but vary. They widen especially around economic news releases or in the early morning. Slippage at order entry also occurs.
Yet, a backtest with fixed minimal spread and 0 slippage is unlikely to be reproducible in live trading. It’s important to know what spread settings were used in the report. Tools like the aforementioned TDS can reproduce past “variable spreads,” giving results closer to real trading.
③ Duration of operation
It’s better if the test covers as long a period as possible, including various market conditions. A report covering only a few months may just reflect a period when things happened to align. The more it spans major upheavals like the Lehman crisis, COVID, sudden yen moves—the more credible it becomes. Ten years or more is reassuring.
④ Maximum drawdown (Max DD)
The maximum drop in asset value. I look at this before profit. It tells you how much you need to endure at worst. Starting with capital that cannot endure that drawdown will exhaust either your mental stamina or your account before you see profits.
Priority 2: Then look at the substance
Number of trades
In short, sample size. 3,000 trades are more credible than 100. A few good results with a small count may be luck (assess data sufficiency in conjunction with the operating period).
Profit factor (PF)
Total profit divided by total loss. A PF of 1.0 is break-even. If run over a long period, PF above 1.2 is a practical benchmark. However, with a small number of trades, PF can be easily inflated, so don’t trust PF alone.
Win rate and risk-reward ratio (R/R)
These two are always evaluated together. A high win rate looks reassuring, but it doesn’t guarantee profitability. Check the risk-reward ratio (average profit per trade divided by average loss). Even with a 90% win rate, if a single loss is as big as ten wins, profits vanish after one loss. Many high-win-rate EAs “win steadily and occasionally take a big loss.” It’s important to consider whether your funds can withstand those occasional big losses.
Common features of reports that look good but aren’t
Reports inevitably include dynamics that make them look favorable (EA vendors want to sell it).
The leniency in modeling quality and spreads mentioned in Priority 1 is one of them. Other red flags I notice include—
- Only cherry-picked periods are shown (perhaps the overall result is negative, but they exclude bad periods)
- Compounded profits shown with aggressive growth (you should also verify how it looks with fixed lot sizes)
- Exceptional performance only under certain parameters (possible over-optimization that fits past data too closely; check whether results hold across both optimized and non-optimized periods)
Around this area, AI can help by checking collectively, which I’ll introduce next.
What I check before buying
For now, I think sticking to these reduces major failures.
- Is modeling quality sufficient (90% or 99.90%)
- Are spreads and slippage realistic (does it assume variable spreads)
- Has it been tested over a long period with various markets
- Can my funds and nerves withstand the Max DD
- Is the sample size sufficient
- Do win rate and risk-reward be evaluated together to withstand a rare big loss
- Is there a cap on losses (does increasing lots during drawdown avoid an unlimited loss)
Nevertheless, checking all this manually every time is a hassle
That said, doing this manually every time is quite a chore. Verifying modeling quality, comparing duration and drawdown, and cross-checking win rate with risk-reward—it's tough, especially for beginners.
So I have AI help me.
I load the backtest report downloaded from Gogojan’s product page, feed it a fixed instruction (prompt), and it performs the checks described above all at once. Moreover, it even highlights issues in the trading content that aren’t obvious from just the summary numbers, which makes initial screening much easier.
Let’s all throw it to the trendy AI!
Below I’ve included prompts that you can use as-is. Also included are examples of diagnosing your own EA’s numbers with those prompts. If you’re curious, try them on the EA you’re interested in.
※ The continuation (the full EA diagnostic prompts and an actual diagnosis of my own developed EA “Mikazuki USDJPY”) is available with a free sign-up.