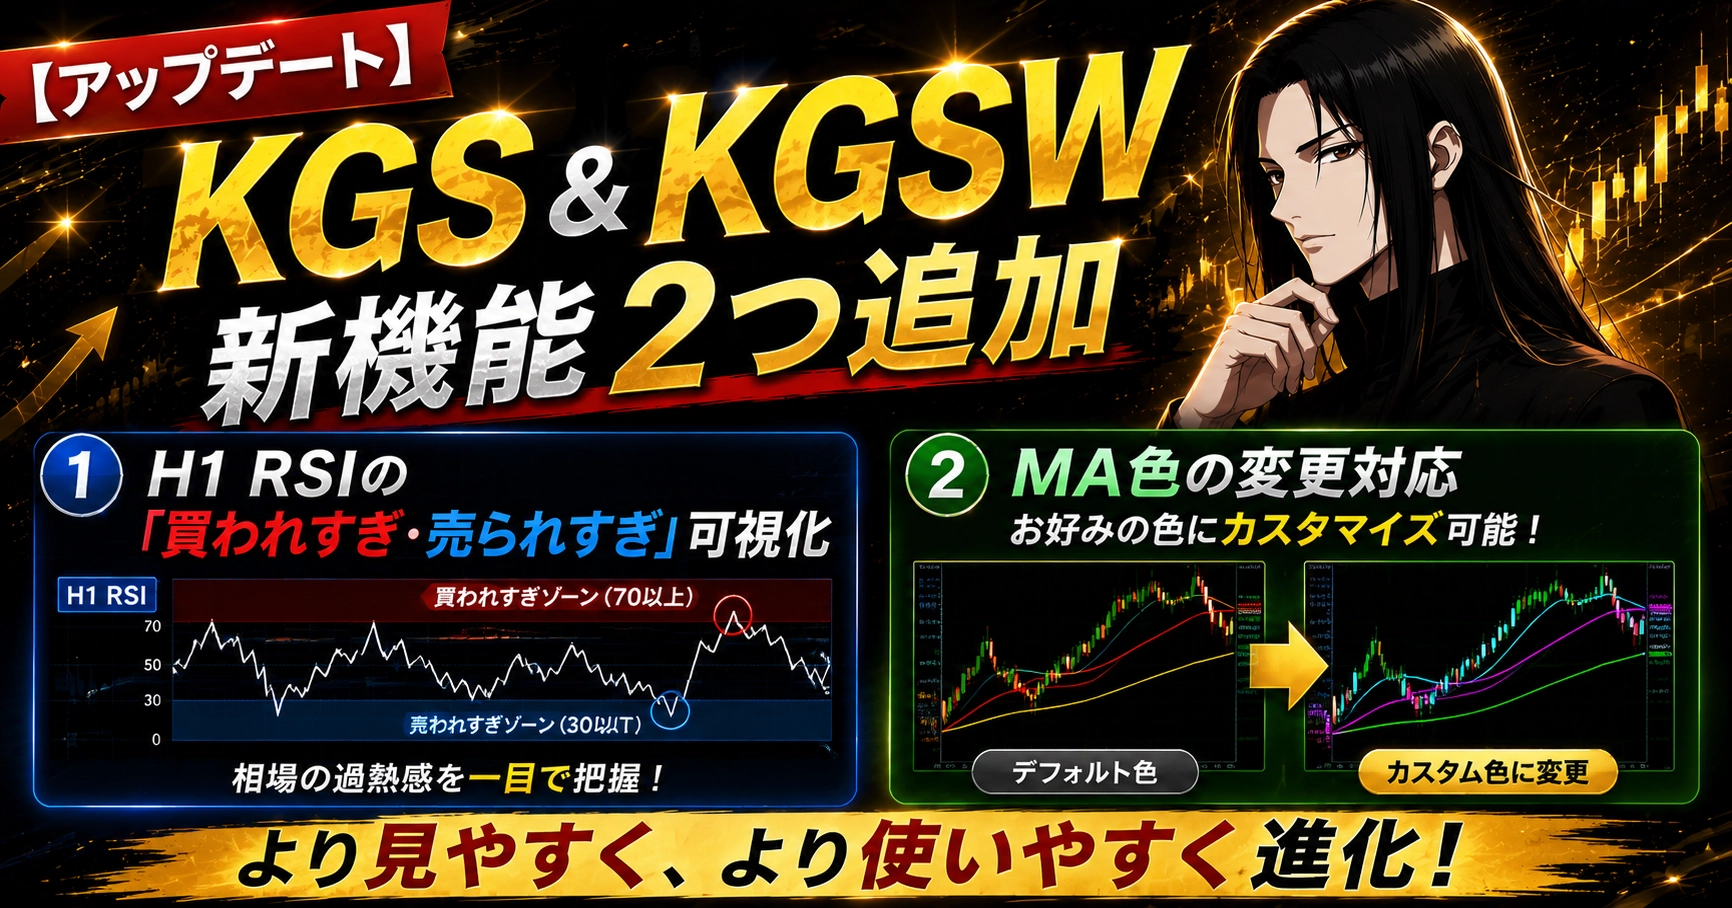
[Update] KGS & KGSW add two new features | RSI visualization of "overbought/oversold" and MA color change support
KGS (Scalp Version) and KGSW (Swing Version) have both been updated.
This time there are two main additions. Both are improvements for “making it harder to lose and easier to use.”
I will explain them in order.
① Visualize “Overbought / Oversold” with H1 RSI
First, this is the main feature of this update.
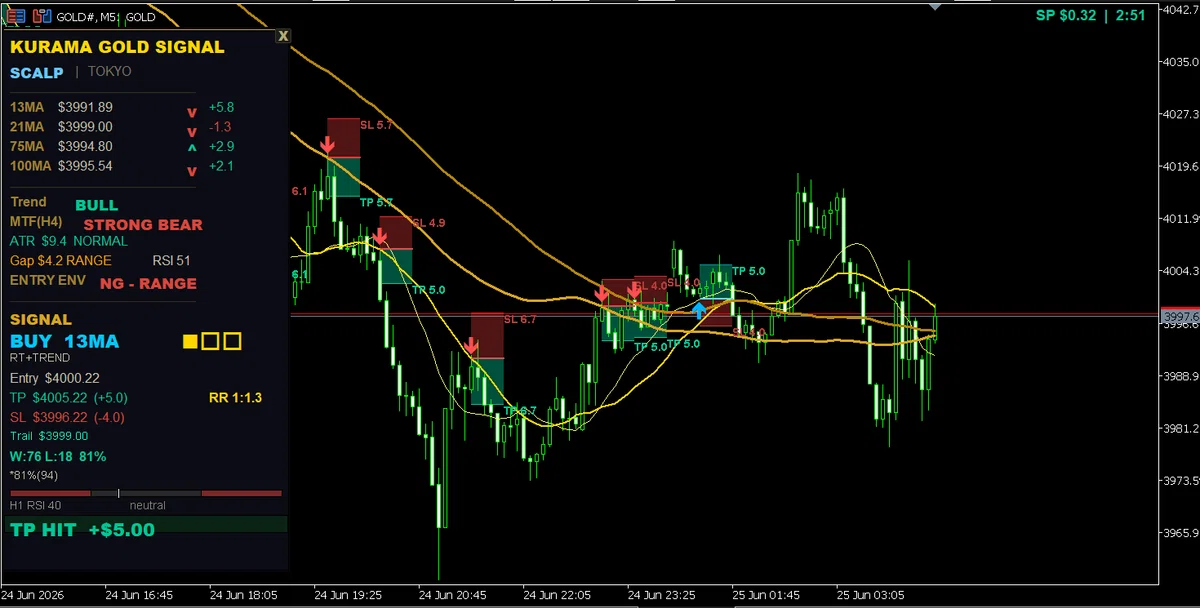
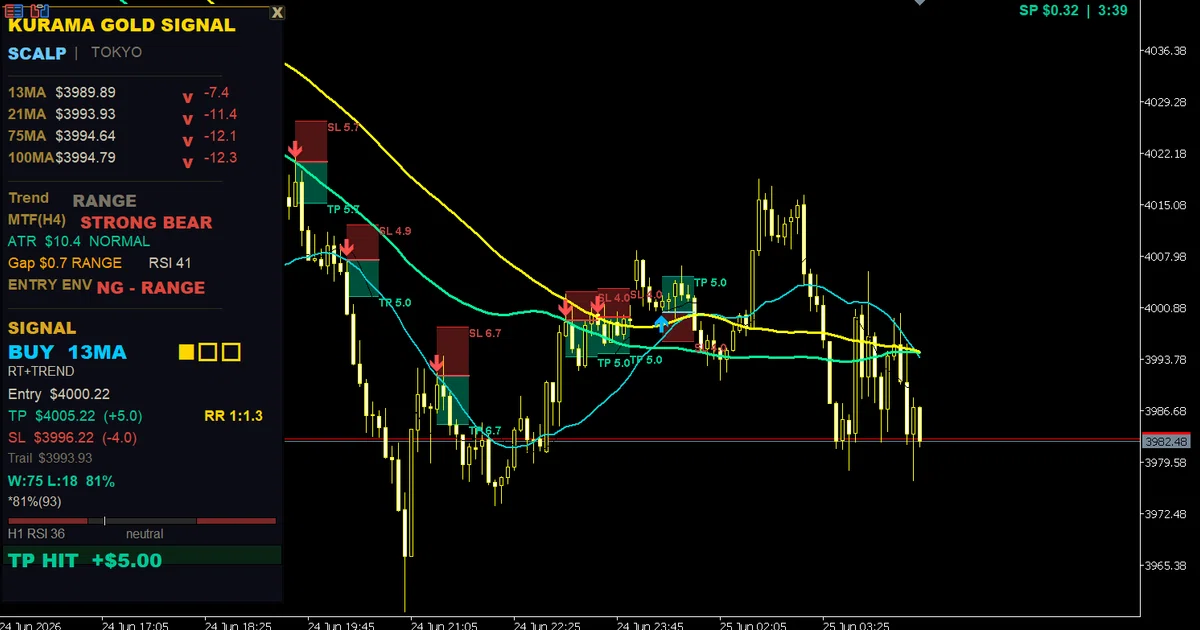
We added the RSI for the 1-hour chart (H1) to the bottom of the KGS panel. This lets you see at a glance whether it is currently overbought or oversold.
The interpretation is simple.
・RSI 70 or higher … Overbought. The rise is overheated
・RSI 30 or lower … Oversold. The decline is overheated
This is a key point.
When you get near this zone, even if a signal appears, you should remain cautious.
Why. In the overbought/oversold zones, a significant reversal is more likely.
For example, a BUY signal when RSI is above 70 tends to be “jumping on an overheated rise.” It may continue, but there is also a high risk of a sudden reversal and a large pullback.
Therefore, even if a signal appears, do not jump on it unconditionally. Check once in the panel to see if RSI is in the overheated zone. This small extra step reduces unnecessary losses.
② Allow customizing the color of MA
This was a frequently requested feature.
Until now, the MAs in KGS (13, 21, 75, 100) had fixed colors. In this update, you can freely change the colors of these four MAs.
・I want to use colors that are easy for me to read
・Other indicators’ colors made it hard to distinguish
・I want them to match the chart background
This is a response to those requests.
And this isn’t limited to KGS (Scalp Version) alone.KGSW (Swing Version) also allows changing the MA colors in the same way.
Both can be changed to your preferred color from the settings screen. It’s a small detail, but the charts you view daily directly impact your ability to judge.
Lately, Swing Indicators Have Been Performing Well
Additionally, here’s a note about the recent market conditions.
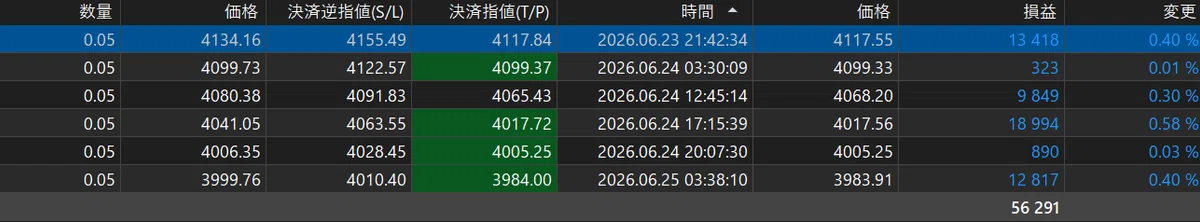
Recently, KGSW (Swing Indicator) has been performing well.
Please look at the actual settlement records. We trade gold at 0.05 lots, and this is the result.
・6/23 +13,418 yen
・6/24 +9,849 yen
・6/24 +18,994 yen
・6/25 +12,817 yen (including other settlements, total +56,291 yen)
Swing is a style that aims to capture large waves carefully. Even on days when you can’t attach it to the chart, you can still aim for profits.
It’s especially effective in markets with a clear directional trend like recently. Use scalping during the day and swing to capture big moves. This mix is what’s working for me now.
Summary
・Updated both KGS (Scalp Version) and KGSW (Swing Version)
・① Added H1 RSI to the panel to visualize overbought (70+) and oversold (30-) conditions ・Be cautious near overheated zones even if signals appear. Watch for large reversals ・② MA (13/21/75/100) colors can be changed freely. Supports both KGS and KGSW
・Recently, KGSW (Swing Indicator) has been performing well. Total +56,291 yen with 0.05 lot
Updates will continue. “All about winning” — I will keep refining with this focus.
Existing users, please upgrade to the latest version and use it.
【GOLD Complete Master Set】
https://www.gogojungle.co.jp/tools/ebooks/80024?via=users_products