
The yen-dollar range is narrow.
 Latest!!You can watch the interview VTR with Golgozan President Hayakawa and me here
Good morning to everyone.
Yesterday's USD/JPY range was about 50 sen (0.50 yen) wide.
The range at the start of the year, which was 1 to 2 yen, has become quiet as if it were a lie.
The Nikkei remains strongly in the 70,000 range, and it even feels like most market money is flowing there.
That said, since the USD/JPY pair isn’t going away, during these calm moves it’s important to observe the real-time moves of USD/JPY and identify its “habits.”
For example, it moves during Tokyo and New York hours but tends to be less active during London hours.
When economic indicators move the market, it tends to retrace substantially even if not all the way back.
During New York time, mean-reversion works well.
In short, identify your own habits and tendencies, or tailor your methods to your own perspective, so you have materials to support your own judgments.
That also makes it easier to cut losses when needed and to do so without hesitation.
Ultimately, it’s your own habits you’ve set; if those habits were wrong, just admit the loss.
Repeating the same thing will tend to normalize the outcomes.
As a result, you’ll know whether wins or losses dominate, and if losses are frequent, you’ll adjust entries and take profits to produce better results.
I believe this kind of verification effort yields good results.
People who steadily work step by step are remarkable because they have continued these practices without hesitation.
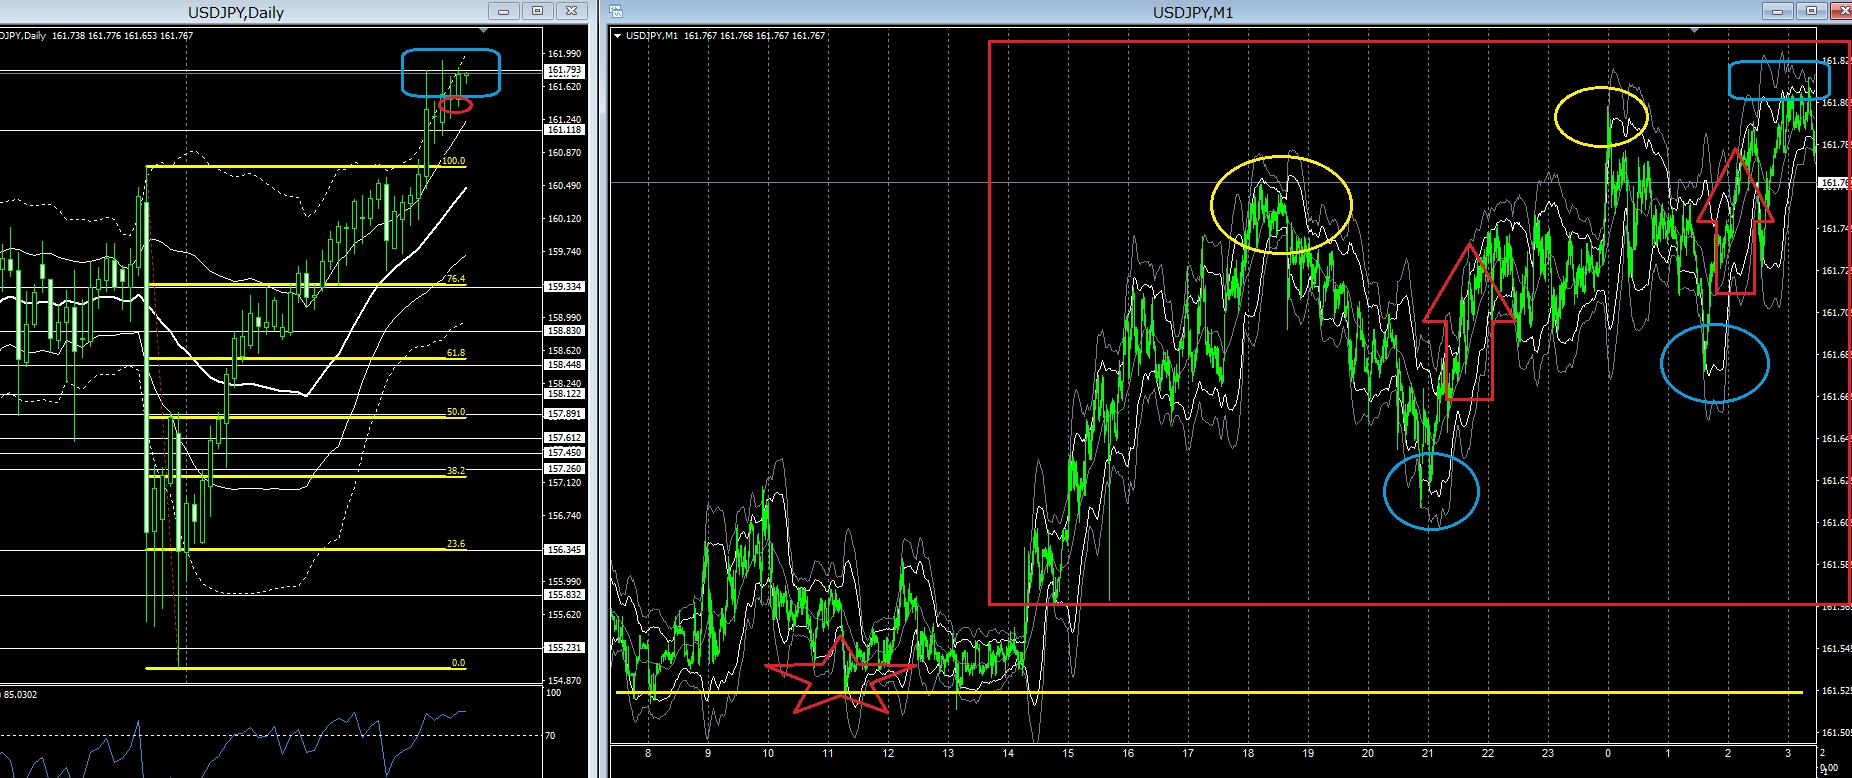
USD/JPY MT4 daily chart & 1-minute chart
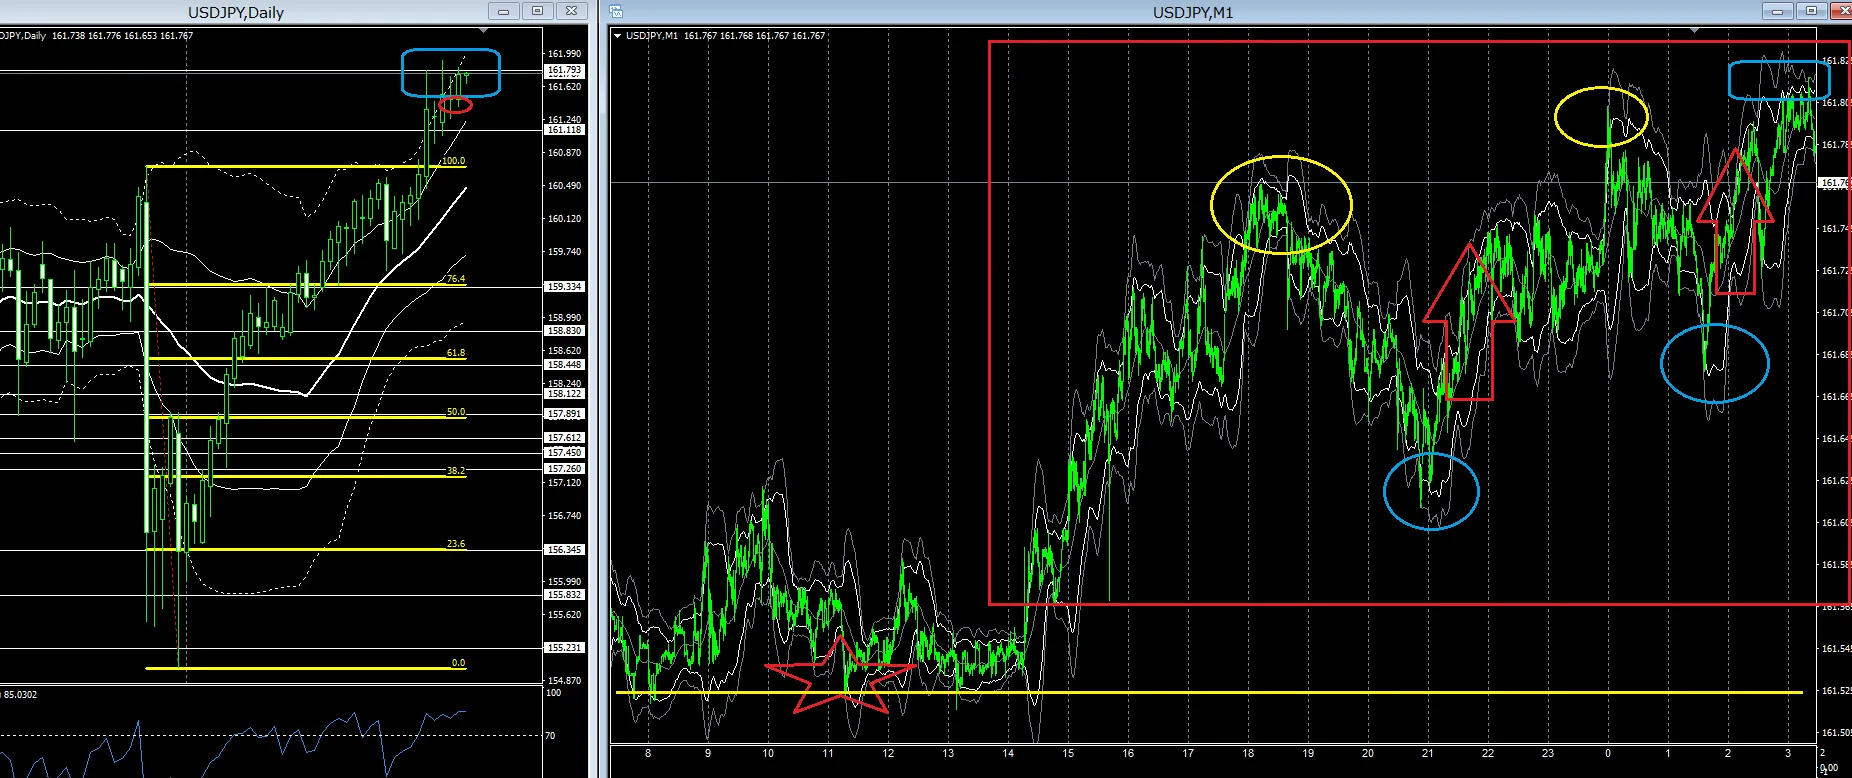 The daily chart is bouncing in the very high price range for about three days.
Yesterday, it reached a high in the early New York hours, then fell, and now is forming a bullish candle and rising.
It’s the same pattern as yesterday morning, but this morning it’s starting from an even higher price range.
Will it break upward for a while and then consolidate again?
If so, that’s where you’d want to sell at the peak.
If possible...
The first move
If you can take a non-typical long and short position (both sides) and go long with an S position, the answer would come quickly.
The 1-minute chart, by the way, doesn’t show much range, so large trends cannot form, but there are easily picked spots at key points.
Looking at the 1-hour chart makes it clear: the 1-hour chart is a sideways range, so you can repeatedly sell high and buy low.
With proper risk management, it’s tradable, but for those who struggle with discretion, a strategy of a billionaire trader’s scalping—switching from selling to buying immediately after a breakout and taking an L position—might be good.
If you look at the 1-minute red □ zone, you can read an upward trend in terms of volume.
In such a context, a rise from the left blue circle after breaking the recent low is a moment that can be judged easily by billionaire trader charts and lines.
From the perspective of “habits” mentioned at the start, a rise after a recent low is likely to form a V-shape, and the retrace is fast, which sticks in memory well.
Well, if you fail, you just cut losses, so at the point of the most recent low you cut losses.
Where it’s easiest to win, it’s easiest to cut losses, which I think you can see in billionaire trader charts and lines.
Billionaire Trader users should not overcomplicate trading.
Since you’re doing something where the outcome is unknown to anyone, making mistakes is normal.
If you keep that in mind, trading becomes more relaxed.
And then it’s a matter of probability.
Thank you in advance for today as well.
For traders who desperately want to succeed in trading and make a living from it, my product that you can also master through self-study, this is the trading technique: below it is recommended ↓