

Every day Nikkei 225: 2026/6/25
Analytics Tool Details Link
Note: We have steadily received high praise.
■ New Development Revenue + Indicator DAVID (David)
https://www.gogojungle.co.jp/tools/indicators/73936?via=users_products
■ Fierce Trendline Drawing Indicator "Unmatched Sword"
https://www.gogojungle.co.jp/tools/indicators/54499?via=users_products
■ Indicator Pack MT4/5 Version - Subscription
“天下無双” Synchronization System
https://www.gogojungle.co.jp/tools/indicators/50319
“David” Synchronization System
https://www.gogojungle.co.jp/tools/indicators/73939?via=users_products
Trail Version · Ultimate · Synchronization System Subscription
https://www.gogojungle.co.jp/tools/ebooks/50353
Below: Current Analysis Article
One-liner: Rebound
Daily Chart:MAX Oscillator: Synchronization Band“Neutral”
4-hour“Weak Upward Move”] indicating caution
Weekly 「Neutral」 indicating caution
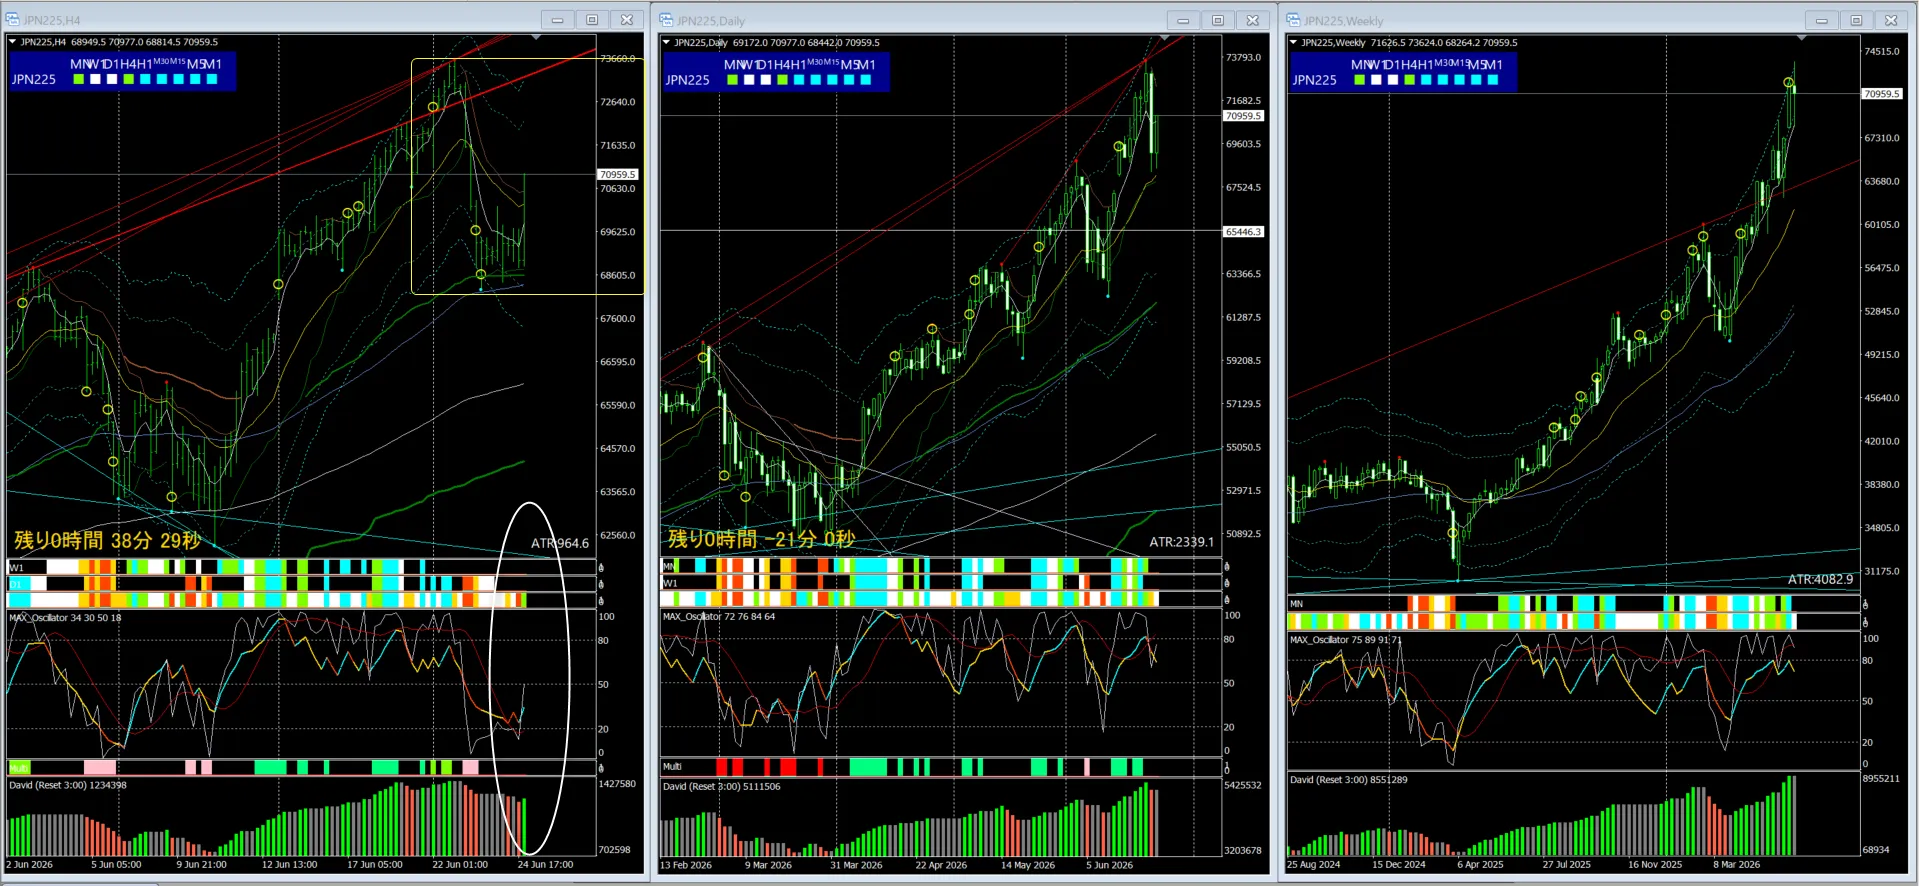
※ There remains a possibility of rebound or entering a range, though
From around the 20-day EMA on daily chart, rebound may occur and range may still be entered
On the 4-hour chart, the high and low of Dow Theory show a confirmed higher high
The upper resistance near each timeframe is notable, but in the near term, is it acceptable to expect upside movement?
Price action can become extremely volatile depending on the time window
If you think it's risky, it would be better to exit quickly and manage risk
Caution and risk management remain essential.
Do not ignore the near-term outlook; stay flexible to short-term waves
Be fully cautious of sudden sharp changes!
Notes
Volatility is quite high, so be careful with money management.
Disclaimer
This is the current analysis comment by the original indicator and is not a recommendation to buy/sell, nor a guarantee of future movements..
It does not guarantee future movement or recommend buying/selling.