
NT-225 Futures MTF Dow Theory Four-Scenario Analysis Report 2026-06-25 (For Day Session)
NK225 Futures MTF Dow Theory Analysis Report
Date and Time: June 25, 2026 06:02 JST / Night Session
Current Value: 71,060 JPY
Target: For the daytime session (6/25)
※ Primary judgment: Dow (close-price based structure) + OI. Elliott Wave is used to reinforce context and management of wave stages, not as standalone entry justification.
Conclusion
During the night session, a pullback to 68,930 formed, followed by a sharp rally, breaking through 69,800 and 70,320 in one move and closing at 71,060. All timeframes show an advancing wave (4H transitioning from a consolidation to an uptrend) and strong rebound from a drop with moving averages turning up. During the day session, the baseline is a continuation of the uptrend with dip-buying and break-following longs, but since the current level of 71,060 is a high after a new high, chasing the high should be avoided; wait for a dip to 70,320–69,800.
A breakout long above 71,320 (closing price) targets 72,000 → 72,210–72,330. Maintain the dip-buying posture for 70,320–69,800 if the dip holds; if 70,320 breaks on a 1H close, momentum may slow, and a break below 68,930 (1H/15m pullback lows) could indicate a downturn in the uptrend, with 68,400 as a potential downside continuation. All TFs show an uptrend, but since it’s a chase for new highs, protect gains with MFE and limit pullback sells to the 72,000–72,330 stall zone.
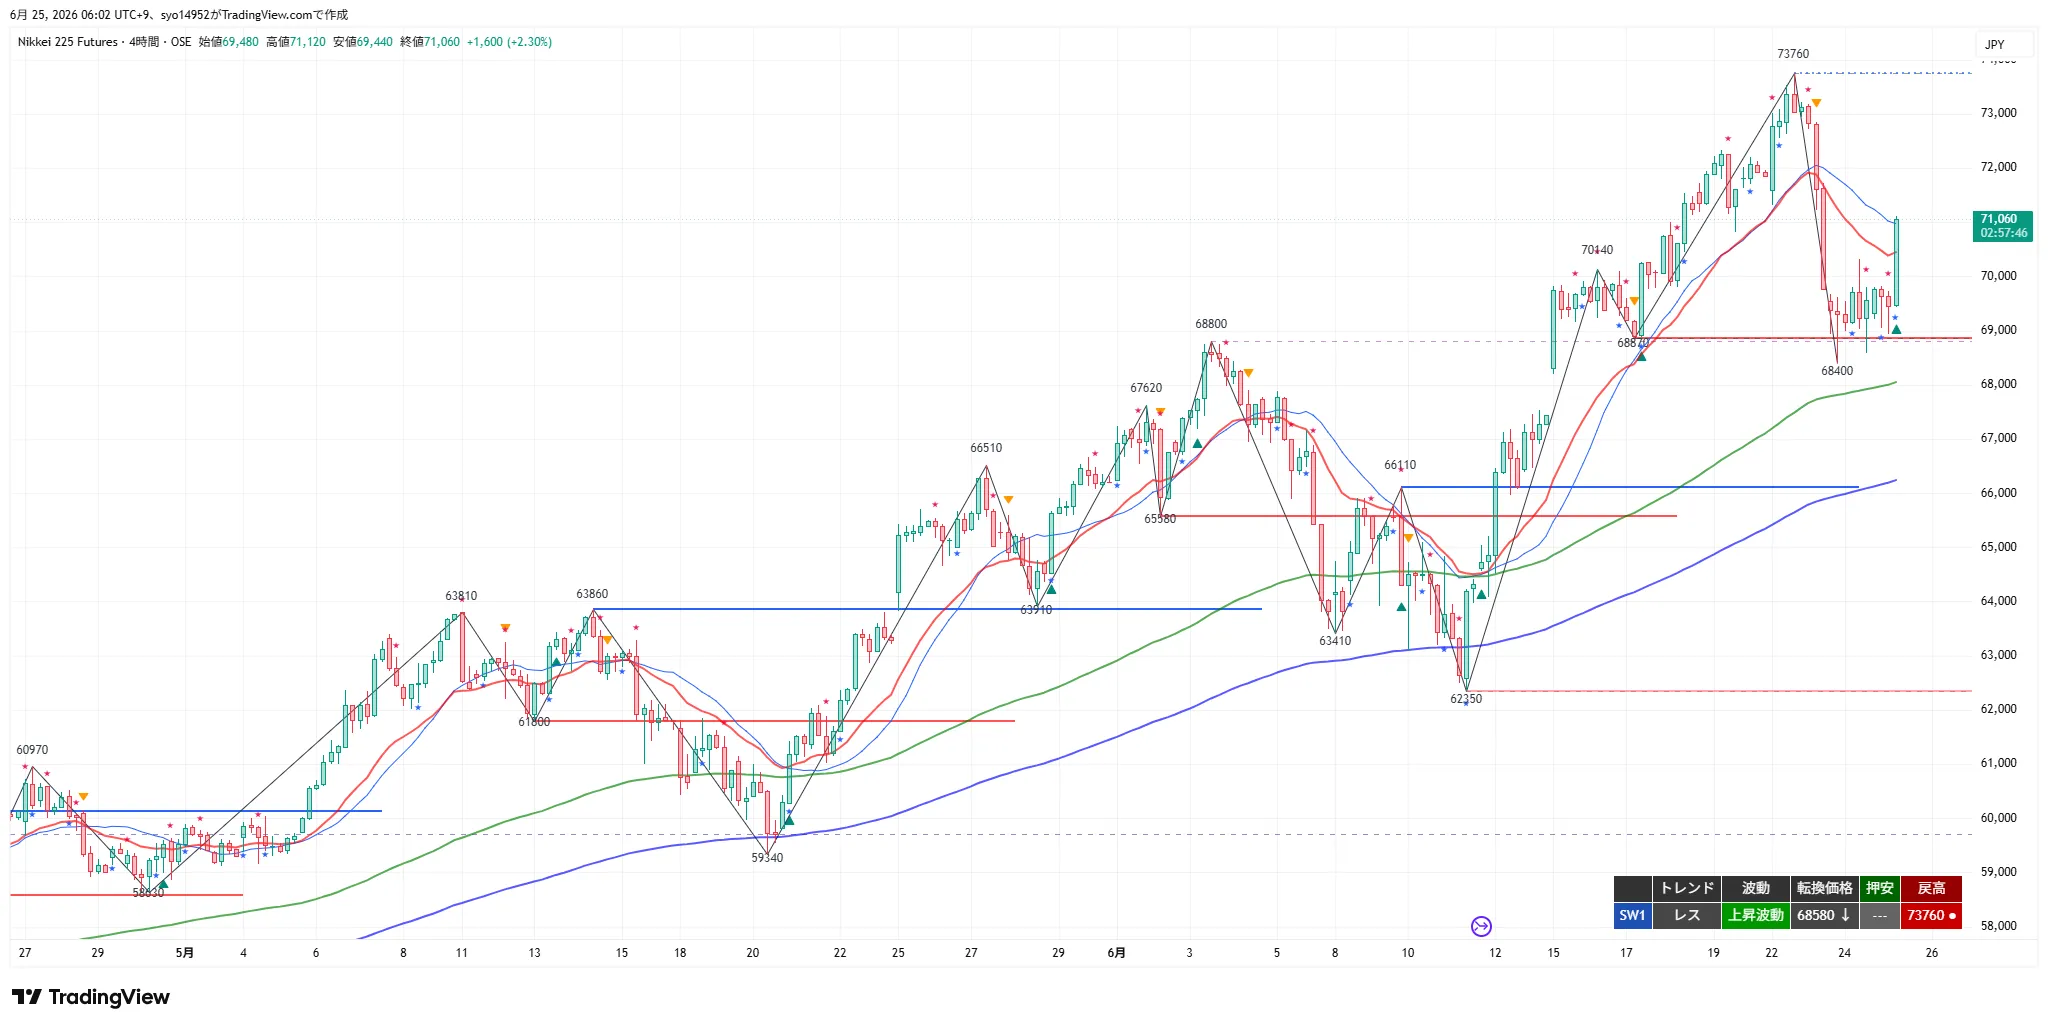
4H Analysis
4H shows a response (no clear trend) and an uptrend. After dropping about 5,300 from the high of 73,760 to 68,400, today’s 4H candle opened at 69,480, peaked at 71,120, and closed at 71,060 with a +2.30% big positive candle, turning a downtrend into an uptrend. Price has broken above the 20EMA (red) and sits above the 120EMA (roughly 68,000 on daily) and 200EMA (around 66,000).
However, the trend display remains in a consolidation (レス). The uptrend will be reestablished once the 73,760 swing high is closed above. Upside levels include 72,000 (OI barrier), 72,210–72,330, 73,180, and 73,760. Downside supports are 68,580 (turning point) and 68,400 (recent low; strong support). As long as 70,140 can be held on a close, the upside continuation scenario remains favorable.
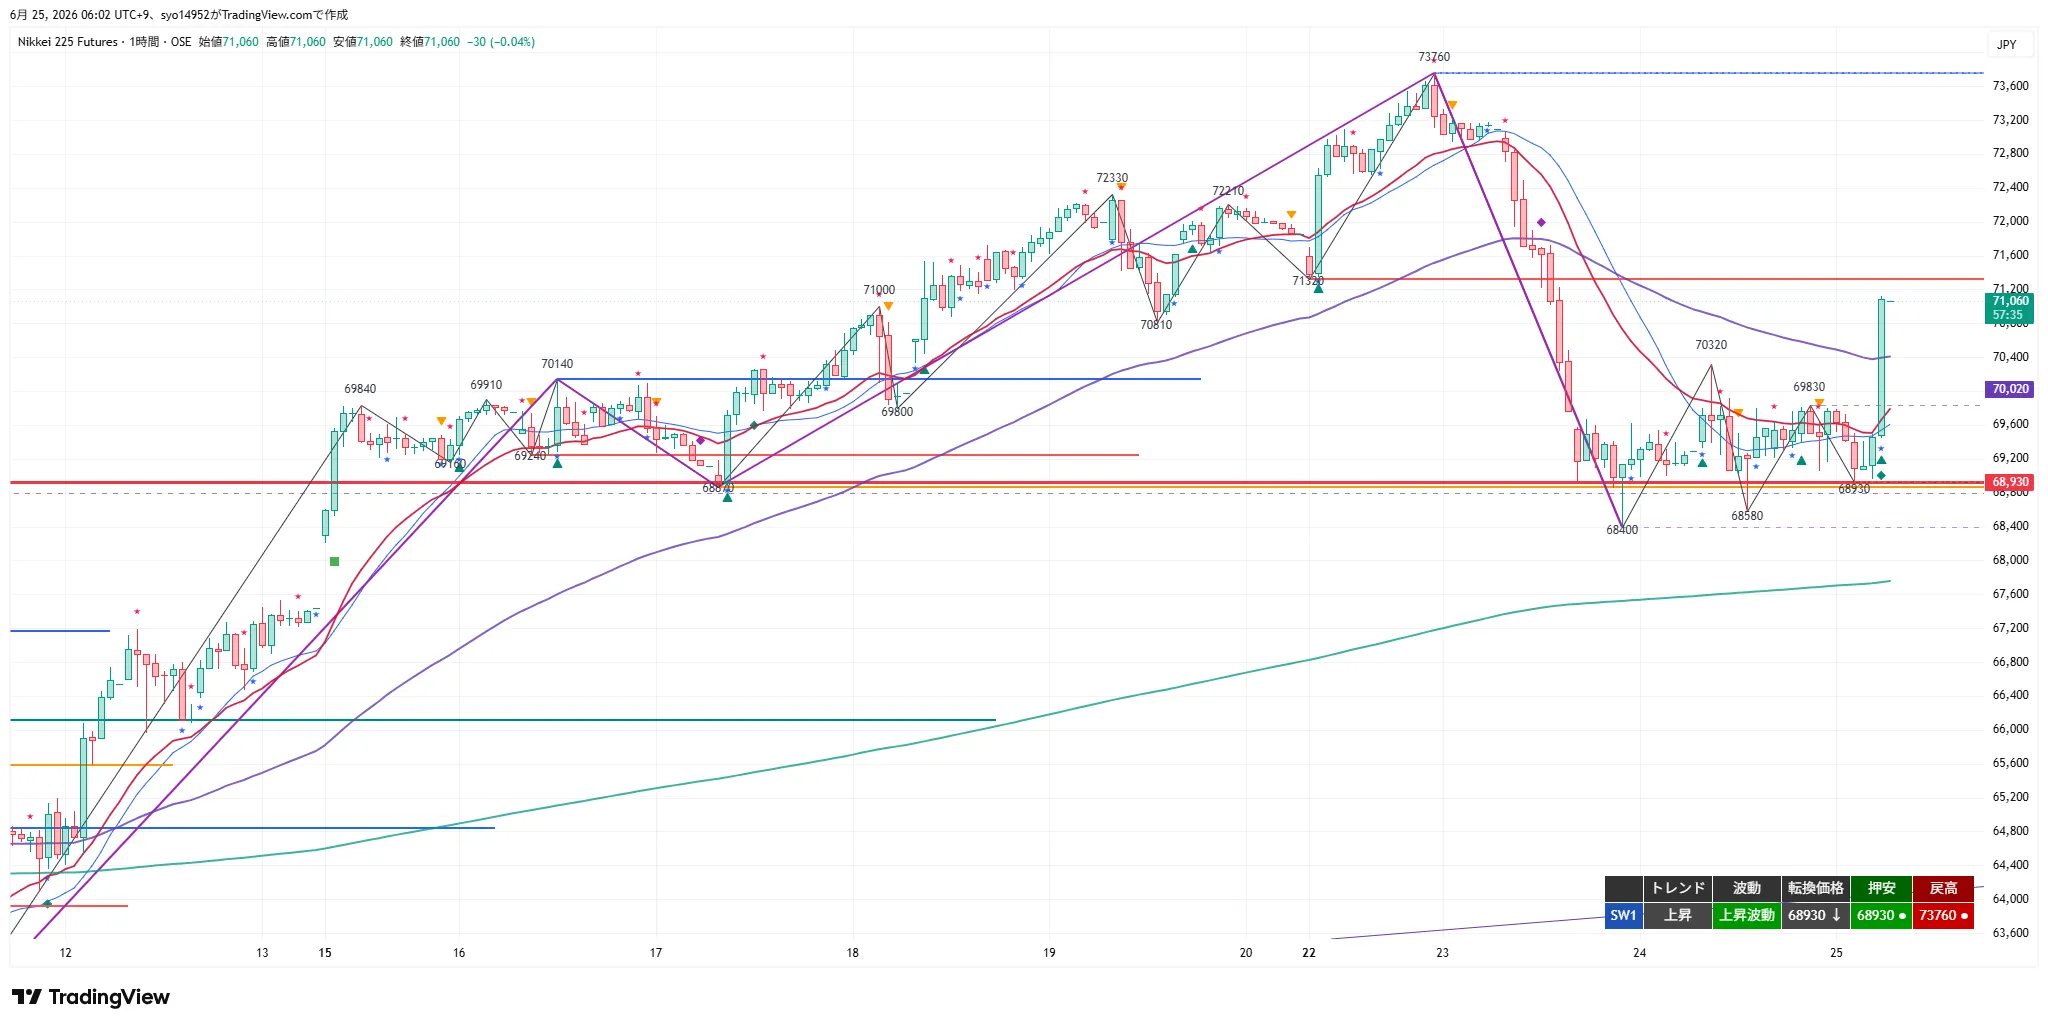
1H Analysis
1H shows an uptrend/upward wave. Turning price at 68,930, pullback low at 68,930, and return high at 73,760. After the plunge from 73,760 to 68,400, price retraced to 70,320 and then fell to 68,580, but rallied sharply from 68,930 and broke above 70,320 to 71,060. The 20EMA and 80EMA (4H 20EMA equivalent) are turning upward, with price above them.
71,320 is the next resistance pivot (previous pullback low); a breakout could push toward 72,210–72,330. Conversely, a close below 70,320 would indicate momentum loss, and a break below 68,930 would warn of a breached uptrend.
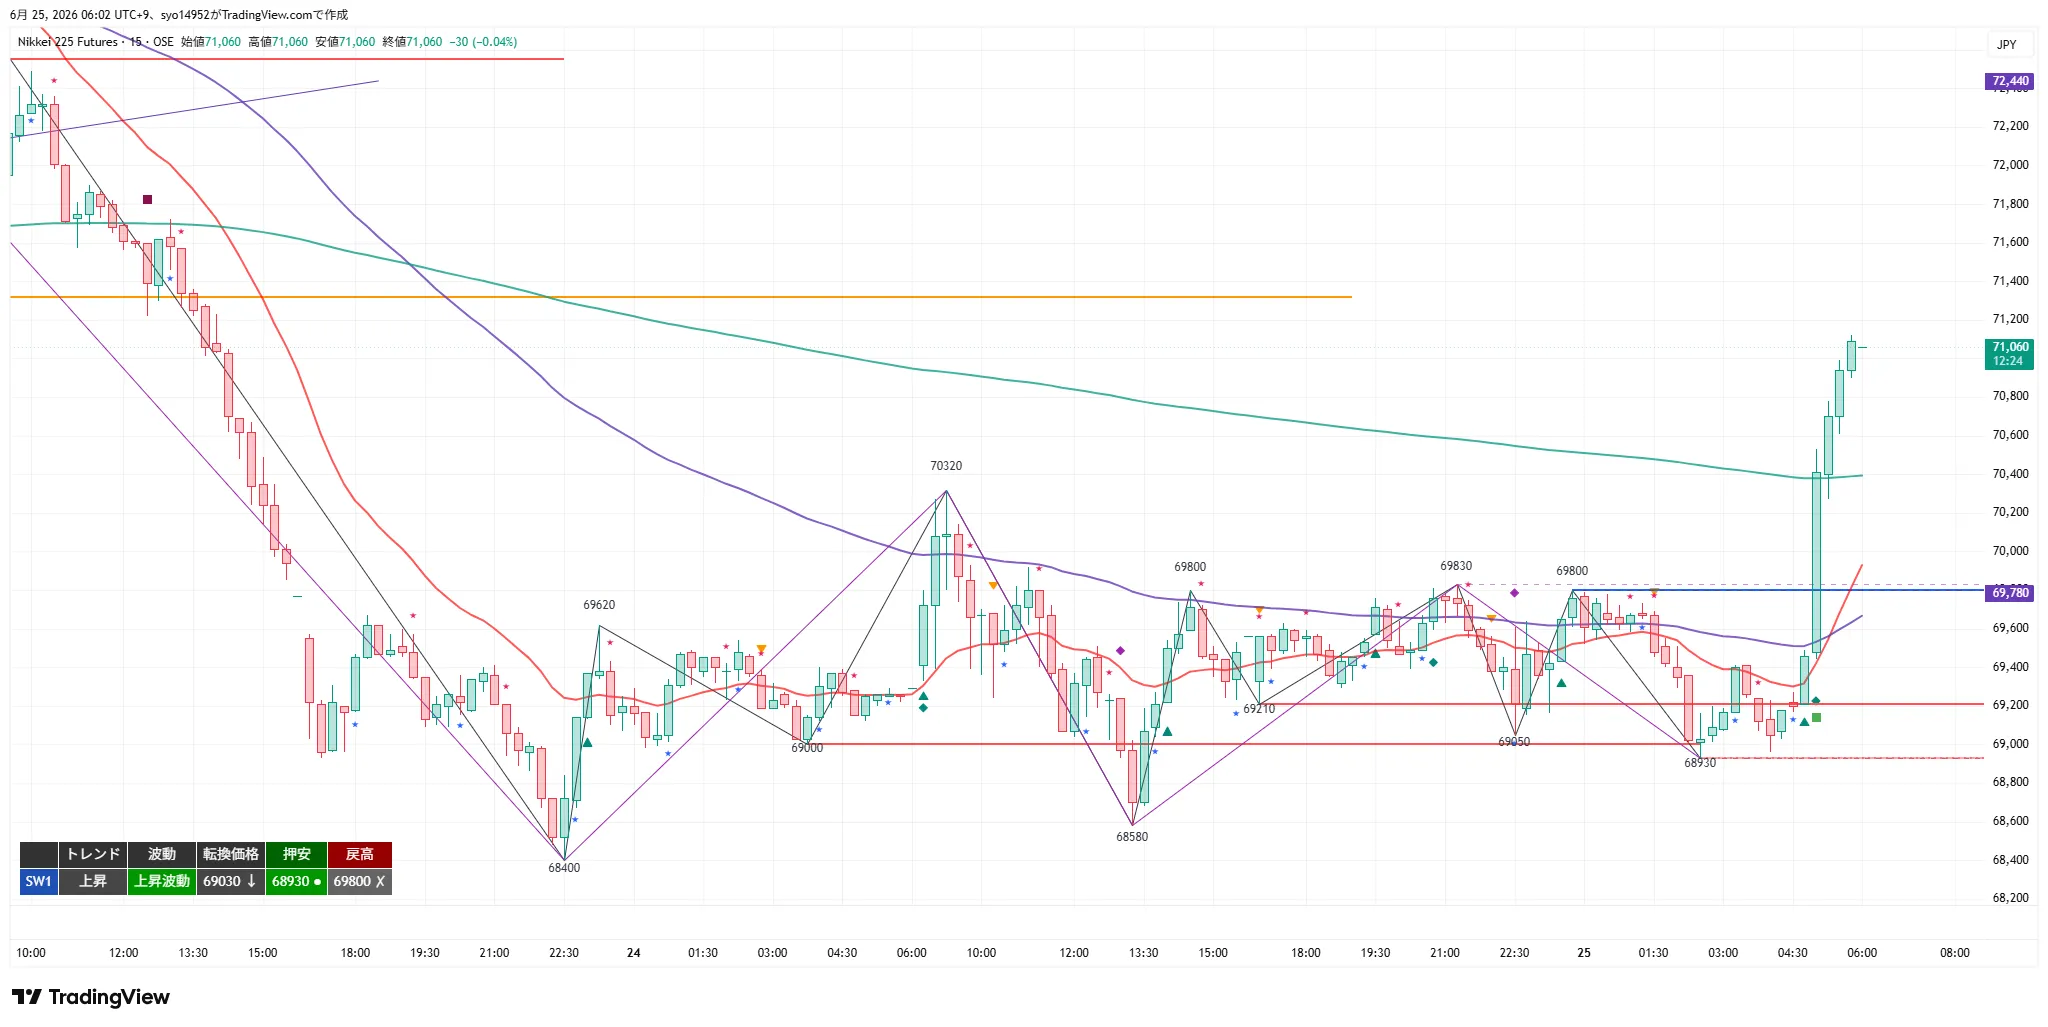
15m Analysis
15m shows uptrend/upward wave. Turning price 69,030, pullback low 68,930, and pullback high 69,800 (X breakout completed). Price surged from 68,930 to break 69,800 and 70,320 in one go, chasing new highs to 71,060. 20EMA, 80EMA (1H 20EMA equivalent), and 320EMA (4H 20EMA equivalent) are all upward and prices sit above them.
No new high for a pullback high yet. Short-term pullbacks lie at 70,320–69,800; if maintained with a rebound, uptrend continues; breaks below 69,030 (turning) or 68,930 (pullback low) threaten the short-term structure. Chasing new highs tends to be impulsive; waiting for pullbacks is the baseline.
MTF Status
- 4H:レス / Upward wave. Turn 68,580; recent low 68,400; pullback high 73,760. +2.30% big bullish candle triggers a transition from down to up; breaks above 20EMA; above 120EMA (daily 20EMA equivalent).
- 1H:Up / Upward wave. Turn 68,930; pullback low 68,930; pullback high 73,760. Rally from 68,930; breaks above 70,320. All MAs rising.
- 15m:Up / Upward wave. Turn 69,030; pullback low 68,930; pullback high 69,800 (X breakout done). Break above 69,800 and 70,320 to chase new highs. All MAs rising.
- Consistency: All four timeframes show rising waves and aligned direction, favoring higher timeframe-driven dip-buying and break-following longs as the core strategy. Pullback selling is contrary to the ongoing uptrend across all TFs; wait for stall in the 72,000–72,330 zone or a break below 68,930 before considering shorts.
OI & Gamma Analysis
OI is a mid-term target based on the previous business day’s (6/24) flow. Gamma intensity numeric values (gex_mag) are omitted; OI is described as the mid-term target and anchor, not a short-term trigger, and to be used for weighting targets (T2) and key levels.
- Upper wall = 72,000 JPY: After yesterday’s drop, this was a distant ceiling, but today’s 1,800-point rebound brought price within about 900 JPY of the current level. Throughout the day, 70,000 calls were most traded (order book), while nighttime saw calls dominate in alignment with a rebound.
- Midpoint around 71,000–69,000: The center of gravity where prices tend to stall lies between 69,000 (pivotal pullback point) and the 71,000s (pullback targets). Today’s activity concentrated around 69,000–70,000, with sizable off-market blocks indicating positions built during the sharp drop, likely for hedging.
- Lower floor = 65,000: Mid-term put support.
- Direction uncertainty: Latest intra-day position data updates tonight; whether today’s active trading represents new versus closing positions remains unclear. The big players’ choice of put-based downside protection during the sharp drop will influence the market into early next week; hedging sales could amplify declines for sellers, while buyers may seek to ease over-extensions. Monitor volatility and shifts in this dynamic.
Elliott Wave Perspective
EW analysis organized as a primary source, connecting with other structures. Since wave interpretation can vary, present both primary and alternative counts and confirm stages with a close above key levels.
Wave Positions (Primary Count)
- Daily: Not breaking 62,350; within an uptrend correction. Potential for a rebound to 71,060 and further upside after a deep correction, though a 5-wave extension beyond 73,760 is not yet confirmed.
- 4H: 62,350 → 70,140 (Wave 1) → 68,870 (Wave 2) → 73,760 (Wave 3) → 68,400 (deep correction) rebound. If 70,140 closes above, the uptrend strengthens again.
- 1H/15m: 73,760 → 68,400 (down Wave 3) → 70,320 (Wave 4 retracement) → 68,580 (Wave 5 feeder) → 68,930 as latest pullback low, with 70,320 broken to indicate a new upwave, suggesting an incoming new up 3-wave count.Potential new up 3-wave entry。
Alternative (Bearish) Count
- View this rise as Wave B retracement from 73,760 (73,760→68,400 = Wave A, 68,400→71,060 = Wave B). If 73,760 is not broken and it stalls, expect Wave C down. Alternative count remains.
Dow Alignment (Key Overlaps Increase Confidence)
- 70,320: Primary EW long confirmation = Dow break level; Trigger = previous trigger (now broken upward).
- 68,930: EW short-term negation = Dow 1H/15m pullback low; aligns with 15m turning point.
- 68,580: EW structure negation = Dow 4H turning price (alignment).
- 68,400: EW final negation = Dow recent low; strong support band (alignment).
- 71,320 / 72,210–72,330 / 73,180 / 73,760: EW upside targets = 1H upper resistance band / Dow retracement highs (alignment).
Role of EW in This Report
- Dow and EW share a directional bias leaning toward long positions (all TF rising waves / new up 3-wave primary). This provides a basis for heavier emphasis on dip-buying and break-following longs.
- Conversely, EW alternative (Wave B retracement) and Dow’s note that “4H is stillレス and 73,760 not yet updated” reinforce caution against chasing highs; wait for dips (70,320–69,800) and manage exits (71,320 → 72,000 → 72,210–72,330 → 73,180 → 73,760). EW is not a standalone entry justification.
Key Price Levels
- 73,760 JPY: 4H/1H retracement high; near-term all-time high. Final target for upside (line for 5th wave extension).
- 73,180 JPY:EW15m 2-wave down retracement high node (Long T3).
- 72,210–72,330 JPY: 1H upper resistance band (EW upper resistance; Zone 3 retracement area).
- 72,000 JPY: OI barrier (mid-term; calls; approaching about 900 JPY higher).
- 71,320 JPY: 1H pivot (next retracement high candidate). Trigger for Break-following Long; EW next upside target T1.
- 71,060 JPY: Current price / Night close.
- 70,320 JPY: 1H turning node / Break level = support-turned. Primary long confirmation; upper bound of Zone 2.EWUpper bound of Zone 2; corresponds to Zone 2 pullback target.
- 69,800 JPY: 15m retracement high (X breakout completed).EWLower bound of pullback candidate zone 1. Zone 2 lower bound.
- 69,030 JPY: 15m turning price.
- 68,930 JPY: 1H/15m pullback low (EW short-term negation). Core short-term support axis.
- 68,580 JPY: 4H turning price (EW structure negation). Break below warns of a rising wave collapse.
- 68,400 JPY: Recent low, strong support band (EW final negation). Break below indicates ongoing decline.
- 65,000 JPY: OI floor (mid-term; puts).
- 62,350 JPY: 4H/Daily structure low. Downside key level.
Trading Ideas
① Break-following Long
- Trigger: Break above 71,320 (1H pivot / next retracement high candidate) on a 15m close (continuation of new high).
- Setup: After breakout, pullback toward breakout price vicinity or a measured move near the tilted 20MA on a shorter time frame (back-entry, breakout-price basis).
- Positioning: 71,320 recovery on a 1H close.
- Stop/Invalidate: Break below 70,950 for the breakout leg; main entry below 70,320.
- Targets: 72,000 (partial profit + cost basis, near OI barrier), 72,330.
- RR: T1 (72,000) = 1.8 / T2 (72,330) = 2.7.
- EWBreak above 71,320 confirms strong continuation of the new up 3-wave, with targets 72,210–72,330 → 73,180 → 73,760.
- MFE protection: exit at +200 or hold small gains to +300 for at least +100; near 72,000 OI barrier, protect early.
② Dip Buying (Long)
- Standard: A shallow dip zone 70,320–69,800 (support-turned; 15m retracement high X pullback zone 1) or deeper 69,030–68,930 (15m turning; pullback low zone 2). Confirm rebound on 15m close.
- Setup: Shallow pullback around 70,100 (LC 69,700), deep pullback around 68,980 (LC 68,830). Entry above the rising 20MA.
- Positioning: 70,320 recovery on a 1H close.
- Stop/Invalidate: Break below 69,700 for shallow pullback or 68,830 for deep; main entry below 68,930. Full exit below 68,580.
- Targets: 71,320 (partial profit + cost), 72,000.
- RR: T1 (71,320) = 3.1 / T2 (72,000) = 4.8.
- EWEW’s strongest entry is a pullback that maintains 70,320–69,800 and then resumes. Dip-buying candidate for the new up 3-wave.
- MFE protection: exit at +200 or +300 for at least +100; protect early due to ongoing uptrend across TFs.
③ Sell the Retracement (Short)
- Standard: In Zone 1 (72,000–72,330; OI barrier; 1H upper resistance), confirm stall with a 15m close (limit retracement). In deep retracement, confirm stall in Zone 2 (73,180–73,760) high band.
- Setup: Look for stall in retracement zone and confirm with 15m close (guide 72,050). Since the 20EMA is rising, avoid early shorts above the 20MA.
- Positioning: 70,320 break below on 1H close (rebreak of break level).
- Stop/Invalidate: Break above 69,260 for early leg; main leg recovers 69,800. Fully exit above 70,320.
- Targets: 70,320 (partial profit + cost), 69,800–68,930.
- RR: T1 (70,320) = 5.2 / T2 (69,800) = 6.8.
- EWMainly a new up 3-wave; retracements are limited. If using EW alternative (Wave B retracement), stall below 73,760 can justify a C-wave decline. Before 68,930 breach, keep retracement rights limited.
- MFE protection: exit at +200 or hold to +300 for at least +100; risk management emphasized since all TFs are rising; avoid chasing, exit if trigger confirmed and T1 reached.
④ Break-following (Short)
- Trigger: Break below 68,930 (1H/15m pullback low) on a 15m close (break in the upward structure).
- Setup: After breakdown, pullback toward break price vicinity or tilted 20MA with small-timeframe checks (back-entry, breakout-price basis).
- Positioning: 68,400 break below on 1H close (downtrend continuation).
- Stop/Invalidate: Break above 69,260 recovery; main leg recovers 69,800; full exit above 70,320.
- Targets: 68,400 (partial profit + cost), 68,000 / 67,000 (final target based on OI floor 65,000).
- RR: T1 (68,400) = 1.6 / T2 (68,000) = 2.8.
- EWBreaching 68,930 negates the new up 3-wave; a break below 68,580 indicates a failed rebound; break below 68,400 indicates continued decline (consistent with EW negation).
- MFE protection: exit at +200 or hold to +300 for at least +100; contributions across all TFs suggest staying bearish beyond 68,930 break is not pursued; beware of false break and sharp reversals.
Current Actions
- Most important line 1: 71,320 JPY. Break-following long on 15m close above this level (targets 72,000 → 72,210–72,330).EWBreak above 71,320 strengthens the continuation of the new up 3-wave, with targets 73,180 → 73,760.
- Most important line 2: 70,320–69,800 (pullback candidate zone) / 68,930 (break point). Uphold pullbacks as buying opportunities; a close below 70,320 weakens momentum; a break below 68,930 signals uptrend erosion; a break below 68,400 signals further decline.
- Alignment of directional view: Dow and EW both favor longs (consensus). With new highs and the EW alternative Wave B retracement remaining, caution remains: avoid chasing highs, wait for dips.
Entry prices, triggers, and stop levels are set based on the chart shape at the close of each timeframe. If structure changes over time, and unless higher-timeframe structure changes, entry prices on lower timeframes (e.g., 15m) will be adjusted using the approach described, selecting the option that better reflects actual conditions.
※ This report is for information purposes and not investment advice. Please make your own investment decisions at your own risk.