
June 25 (Thu): 【BB & HM】 Nikkei 225 vs. U.S. 10-Year Treasury Yield
[Notice]
There were requests for GOLD, so
we will distribute on TuesdayNASDAQasGOLD.
This time
will compare with the
‘US 10-year Treasury yield’
.
[Overall Scenario Probability]
This week's overall market is…
“Rise: 40% / Fall: 60%”
※ Presented as a reference level.
【This Week's Market Focus Points】
This week's market shows stronger downward pressure, with NASDAQ and S&P500 breaking below their MAs among the four major US indices.
Meanwhile, the so-called “canary in the coal mine,” Russell2000, still holds its MA, making it difficult to determine whether this signals a reversal to a downtrend or a temporary pullback within an uptrend.
In the Nikkei 225, distinctive waveforms appear and are attracting attention as important signals for future direction. Movements in the US 10-year yield are also likely to have a major impact on each market, so you cannot take your eyes off this week's price action. Detailed analysis will be in the paid section.
➥The continuation is explained in detail in the members-only report.
If you have not registered yet, please click here ↓
[Integrated Edition]
‘Why does the market stop there?’ Bollinger Band ✕ Harmonic: A fusion of statistics and geometry to capture turning points in the market with high precision!
https://www.gogojungle.co.jp/finance/navi/series/1613?via=articles_detail_aside
[Notice]
[YOSSY] Harmonic AutoDrawing System
will be updated!!!
You will be able to grasp all situations with alerts!
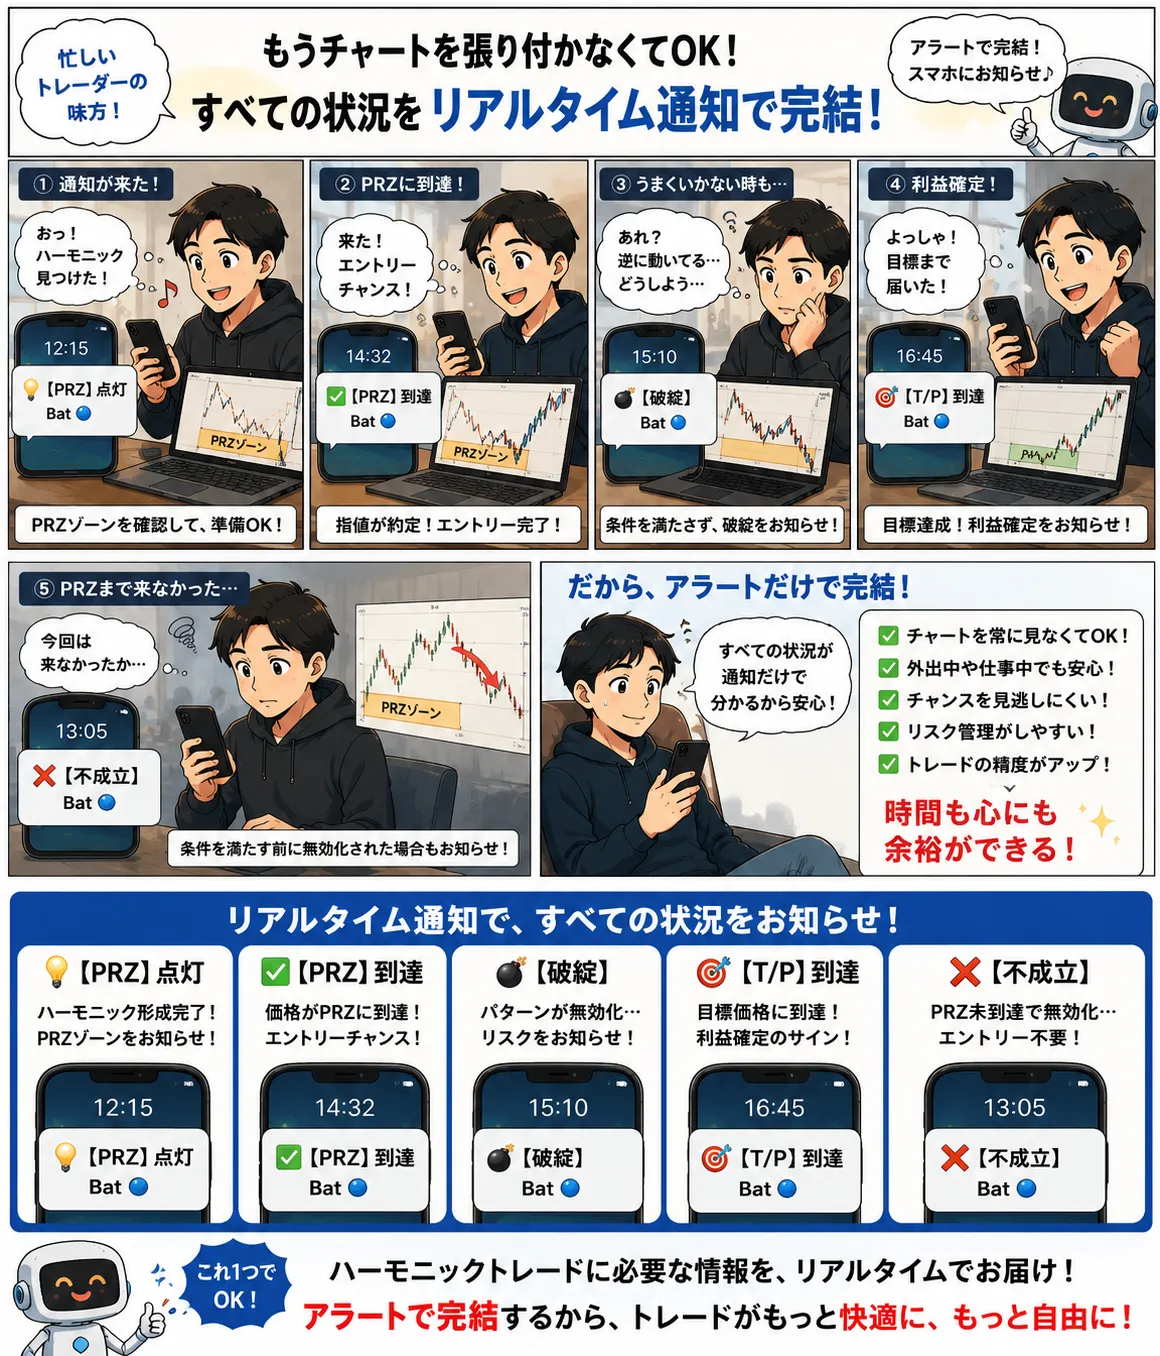
Please look forward to it!
(*The following is for members only。)
--------------------------------
【Environment/Context】