

[Practical Verification] Exposing the "Liquidity Imbalance" in TradingView Options Chain and the Yen Futures (6J) Realities
【Practical Verification】Unveiling “Liquidity Imbalance” in TradingView Options Chain and Realities of the Yen Futures (6J)
Even when you entered according to signals from the indicator’s golden cross or clean chart patterns (buying on dips, selling at resistance, etc.), for some reason you suddenly move against you and get caught in a stop-out—this is a common experience among traders.
In modern forex markets, HFT (high-frequency trading) and algorithmic trading dominate, and it’s no longer possible to analyze large investors’ intentions solely from the candle shape or technical indicators calculated from past prices. What truly moves the market are not the lines drawn on the chart, but the liquidity lurking behind the scenes in“Depth of Orders (Liquidity)”and“Future hedging needs”.
Recently, terms like “liquidity pools” and “option hedging” have become common on social media, but much of it remains a surface-level explanation, and practical know-how for building strategies from actual data is often boxed off. In this article, we use TradingView’s newly implemented “Options Chain” feature and examine CME (Chicago Mercantile Exchange) Yen futures (6J) real data to explore market psychology biases and liquidity in a highly practical manner.
1. Why do top-tier traders deem “options and futures data” indispensable?
The biggest reason many individual traders hit a wall with technical analysis is that information is a “lagging indicator.” Meanwhile, the options market’s “volume” and “open interest” provide extremely vivid leading information about how market participants are hedging risks at present for future price movements, i.e., how much cost they are currently paying to hedge risk.
These core data, once accessible mainly to institutions or some hedge funds, are now observable in real time by individual traders through tools like TradingView. This represents market democratization, but also marks an era where interpreting data as mere numbers is insufficient; discretionary interpretation adapted to market conditions—i.e., the execution of logic—becomes the decisive factor.
2. [Case Study] Screening CME Yen Futures (6J1!) Option Chain
To explore the direction of USD/JPY, let’s look at the option chain for CME Yen Futures (6J1!) with 9 days to expiration (9 DTE), a crucial source of interbank backing data.“CME Yen Futures (6J1!)”and examine the option chain.
↓ Here’s what the actual options screen looks like!
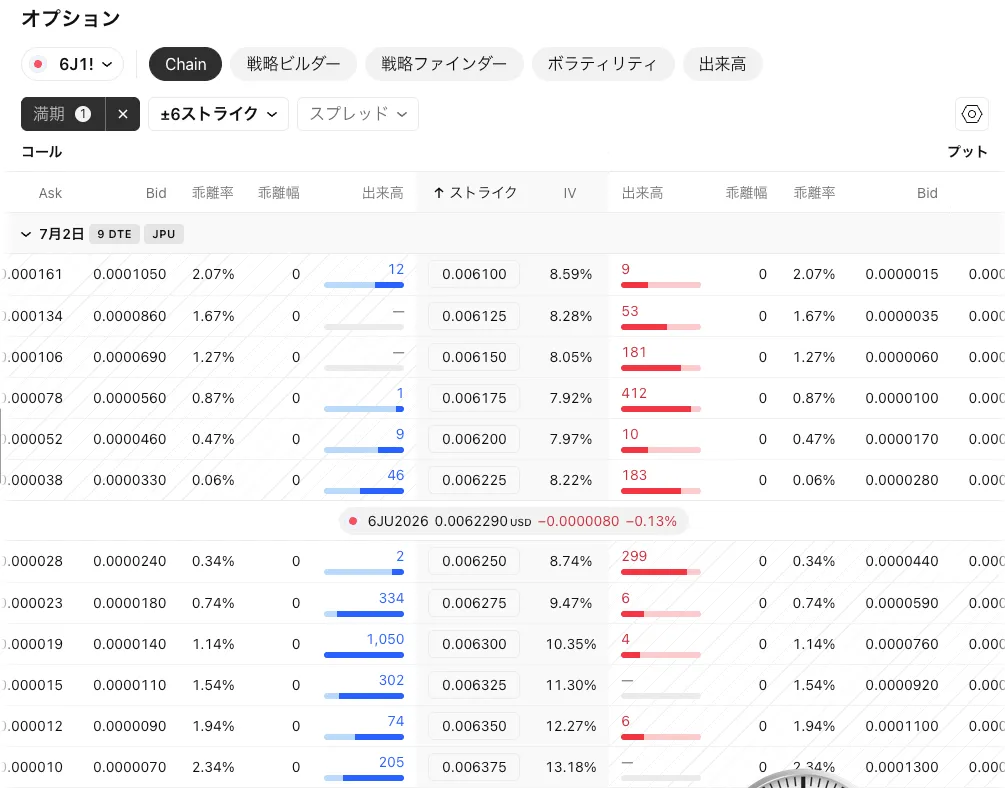
※ Key premise for trading strategy: Inverse correlation between Yen futures and USD/JPY
When traders familiar with USD/JPY charts check Yen futures data, they must not confuse the chart orientation. Yen futures express value as how many USD per 1 yen, so the relationships are as follows.
- Yen futures (6J) rising → Yen strengthening, USD/JPY falling
- Yen futures (6J) falling → Yen weakening, USD/JPY rising
The following is an extraction of real-volume data for option chains under a particular market environment (current underlying around 0.0062290 USD).
| Call volume (yen appreciation rights) | Strike price (exercise price) | Put volume (yen depreciation rights) |
|---|---|---|
| 12 contracts | 0.006100 | 9 contracts |
| 1 contract | 0.006175 | 412 contracts |
| 9 contracts | 0.006200 | 10 contracts |
| 【 Current underlying (6J front month): around 0.0062290 USD 】 | ||
| 2 contracts | 0.006250 | 299 contracts |
| 1,050 contracts (★突出) | 0.006300 | 4 contracts |
| 302 contracts | 0.006325 | ― |
3. Professional Insight: What the data reveals about distortions and investor psychology
How should we incorporate this data into a system or discretionary trading? Here are three steps to systematize the interpretation.
Step 1: Identify the liquidity pool (concentration band of orders)
The overwhelming “distortion” in the data is the exact concentration of 1,050 contracts at the call strike 0.006300. The wall at 0.006325 (302 contracts) outside it is also clear. By comparison, the maximum volume on the put side (yen depreciation, 0.006175) is only 412 contracts, making the difference obvious.
Step 2: Infer insider psychology from hedging needs
The fact that such a concentration exists for a slightly out-of-the-money call option (current price is 0.0062290) indicates strong evidence that large speculators and real-money players are highly wary of, or are setting up for, rapid yen appreciation (USD/JPY drop) by expiration (within 9 days).
Step 3: Quantitative assessment of position tilt
In a short-term deal with 9 days remaining, the presence of a call wall exceeding the put maximum by more than a double is a signal that the market tilt (distortion) is excessively biased toward yen appreciation. The 0.006300 level can act as a liquidity pool or pivotal point likely to trigger squeezes or forced hedges, attracting short positions and driving price action.
4. Break the trap of pattern blindness: dynamic filtering based on environment (bond correlations)
The most important caveat here: assuming that “more call volume equals a guaranteed yen strengthening” or “a wall guarantees a rebound” is dangerous. A fully patterned, fixed-rule approach can be a trader’s fatal flaw. Market context can change, and the same data may lead to 180-degree different strategies—dynamic discretionary filtering is required.
【Environmental factor: applying US-Japanese bond yield spread (bond correlation)】
Filter by the long-term dominant factor of USD/JPY and Yen futures: the US-Japan interest rate differential.
- Scenario A (true trend): there is a narrowing of the US-Japan rate difference
When US Treasuries are in a downward trend and macro conditions imply dollar selling and yen buying, the appearance of this 0.006300 call peak indicates a true yen appreciation trend driven by both demand and speculative alignment. Price tends to be drawn toward this liquidity, and after reaching the line, gamma-short hedges by market makers can drive a breakout and accelerate yen strength. - Scenario B (overreaction or trap): rate difference is widening or high
If the rate difference is not contracting, yet the options market balloons this peak, it indicates speculation aiming for a temporary short-cover or excessive hedging ahead of an event—lacking fundamental backing. In this case, market psychology tilts toward yen appreciation, but the draw toward the 0.006300 liquidity pool is short-lived, offering a highly effective contrarian strategy of selling into the bounce (USD/JPY rising, yen weakening).
5. Conclusion: Surviving the “Zero-Click Era” by not relying on search engines
Today, a quick search on the internet reveals someone’s supposedly correct trading method. Yet merely following surface-level know-how makes sustained profits in a market that evolves daily impossible. A trusted edge exists only in the process of hypothesis testing against dynamic data, refined through experience and practical reasoning.
First, immediately perform the following verification steps in your TradingView:
- Open the chart for “6J1! (CME Yen Futures).”
- Display the nearest option chain from the “Options” tab.
- Identify the strike price where the maximum volumes for both calls and puts occur, and plot horizontal lines on the actual chart at those levels.
- When price approaches those lines, track for a few days whether liquidity breaks through (breakout) or reverses (retraces).
Visualize the breath of large investors behind the data on the chart and refine your own market sense (discretionary judgment). That is the only path to evolve from being exploited by information to turning market distortions into profits.
"""