
If you know FVG, you will see the " footprints of large players" on the chart【Full explanation of FVG】 ICT/SMC
Introduction — Do you notice the strength of a trend?
When you look at the market, haven’t you felt differences like this?
When the pullback is large and the direction is hard to determine.
When it rebounds right around the previous high and the trend continues with a balanced up-and-down movement.
And when it keeps rising strongly with almost no pullback, the momentum is clearly different.
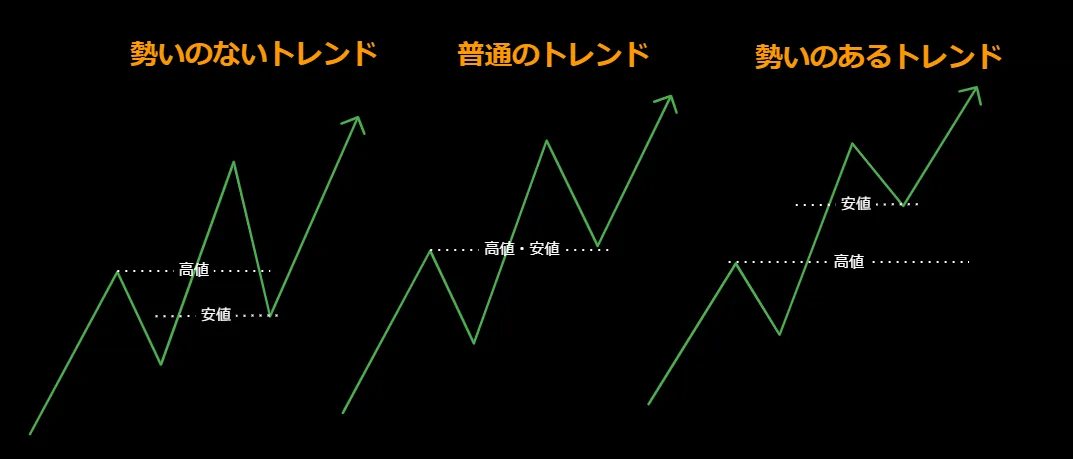
In fact, this “depth of the pullback” isthe barometer of trend strength.
When the trend is weak: The pullback is large and deep
During an ordinary trend: It rebounds around the previous high and repeats a balanced up-and-down movement
When the trend momentum is strong: The pullback is shallow and it keeps rising without returning to the previous high
What is the essence of this “strong momentum”?
Now, consider one important thing.
That strong movement of “pullback is shallow and it keeps rising.”
Even if individual investors buy or sell all at once, that momentum cannot be produced.
Because the scale of money required to move the market is too different.
That intense one-directional move is born when
the big players like central banks, institutional investors, and hedge funds participate.
The balance between buying and selling collapses in one go. Big players hold that much capital.
And there are “footprints” on the chart that can only be seen when big players move.
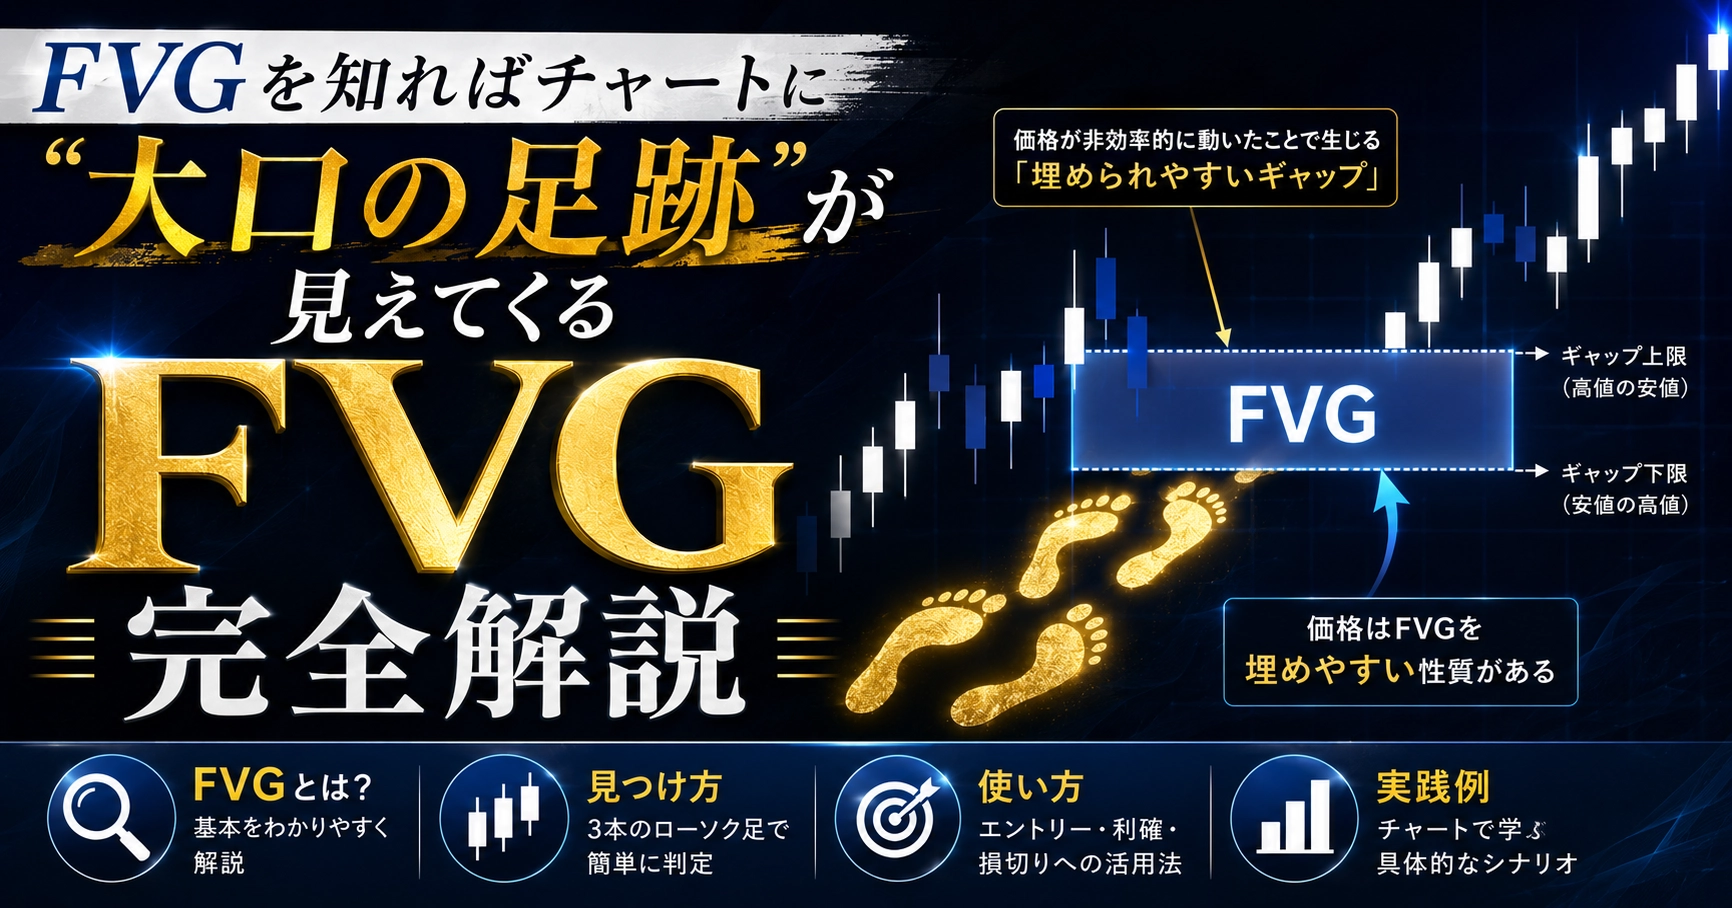
That is the FVG (Fair Value Gap).
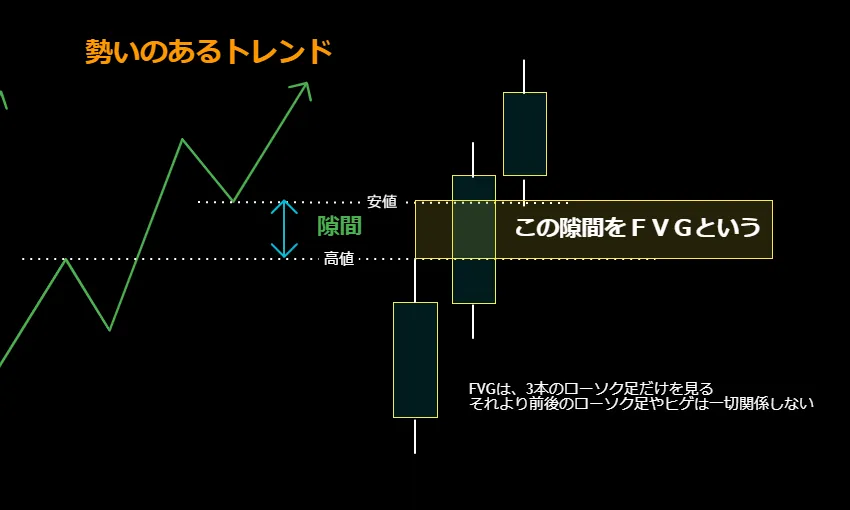
What is FVG? — Found with just three candles
FVG is extremely simple.
It can be judged with only three candles.
The bodies of the prior and subsequent candles’ wicks are not involved at all. No indicators. No difficult patterns.
Just look at the pattern of three candles.
【There is a gap between the high of the preceding candle and the low of the next candle】
That’s all there is to it.
When you find this gap, it means
“Ah, the big players moved.”