
NK225 Futures MTF Dow Theory: 4-Scenario Analysis Report 2026-06-23 (For the Asian session)
NK225 Futures MTF Dow Theory Analysis Report
Date and Time: June 23, 2026 06:03 JST / Night Session
Current Price: 73,090 yen
Target: For Day Session
Conclusion
In conclusion, on 6/22 during the day session, price clearly broke above the 72,000 call wall and moved up to 72,550; into the night session it continued to new highs up to 73,760 and closed at 73,090. The 72,000 wall, which had stalled at the night session previously, was突破 (broken) on the day session, and gamma squeeze worked to accelerate upward. The 4H shows an uptrend and up-move, the 15m also maintains an up-move, while the 1H shows a minor pullback from the 73,760 peak. During the day session, the basic strategy is to buy on dips and follow the breakout, with a breakout above 72,990/73,760 to ride the upside; in the dips (72,550–72,000 / 72,250–72,000 in two ranges) aim to rebound. The upper side has thinning gamma and the next thick wall is at 75,000, so breakouts tend to extend upward, but after breaking 72,000 there is heat, so buyers should protect with MFE early.
Maintain rising dips with a rebound at 72,550; if ending price closes above 72,990→73,760, it signals a breakout and continuation long (upside gamma is thin and the next thick wall is 75,000). Dip candidates are the two ranges: 72,550–72,000 (shallow) and 72,250–72,000 (deep; 72,000 is old call wall turned into support). If 72,000 is breached on a 15m close, expect deeper correction toward 71,320. Because of the overheating right after breaking 72,000, protect with MFE early.
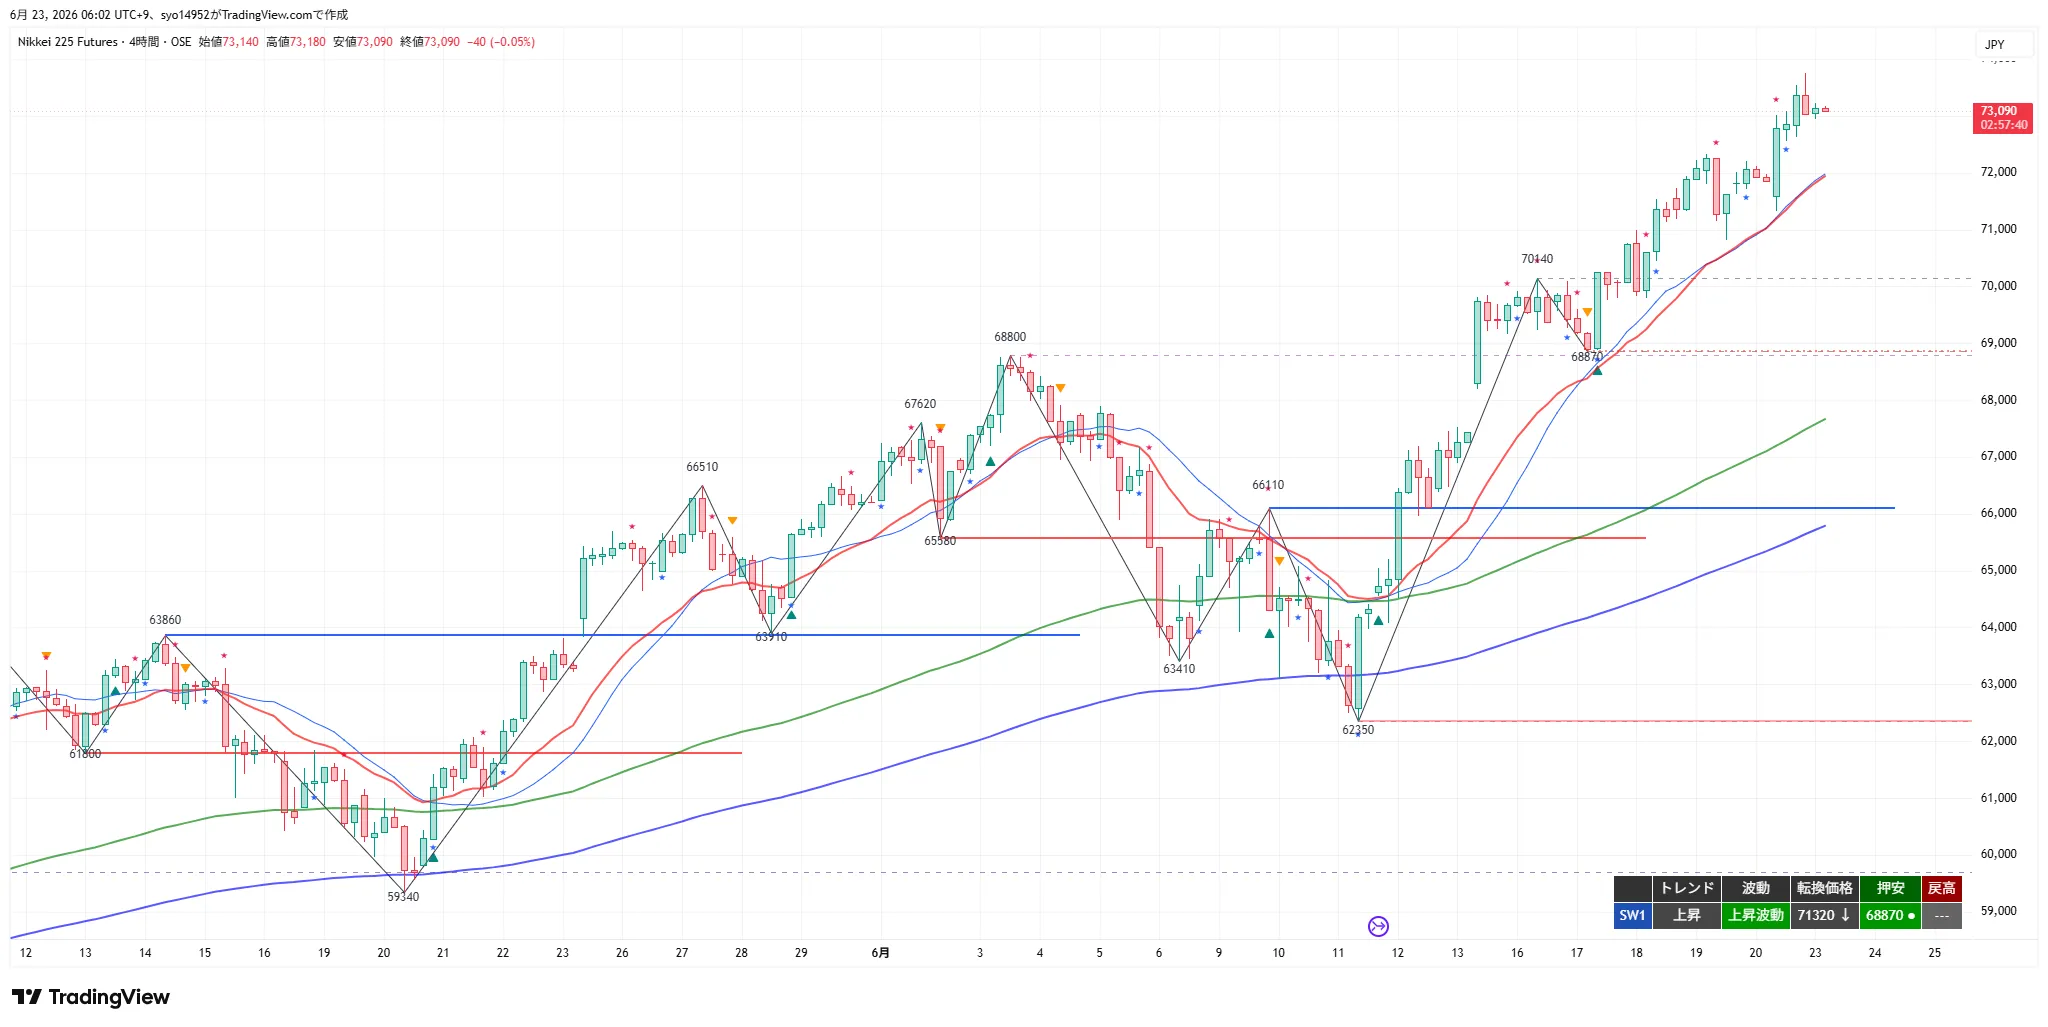
4H Analysis
The 4H remains in an uptrend and up-move, extending highs from day into night. The day session clearly broke above 72,000 to 72,550, and the night session pushed to a new high of 73,760, closing at 73,090. The recent swing low is 71,320. The 20EMA/20SMA are rising, price is well above the 120EMA (roughly 68,500 on the daily) and the 200EMA (psych level), indicating a strong bullish bias.
The upper target is unlimited in theory with 73,760 at night high; beyond that, gamma-thin regions lead to the next thick wall at 75,000. The lower bound is 72,550 (15m swing low), 72,250 (gamma node), 72,000 (old call wall = support turned), 71,320 (4H/1H conversion), 70,810–70,140, 68,870, and ultimately 62,350. As long as 62,350 is not breached, the major trend remains up. Be cautious of a sharp pullback at high price levels right after breaking 72,000 due to overheating.
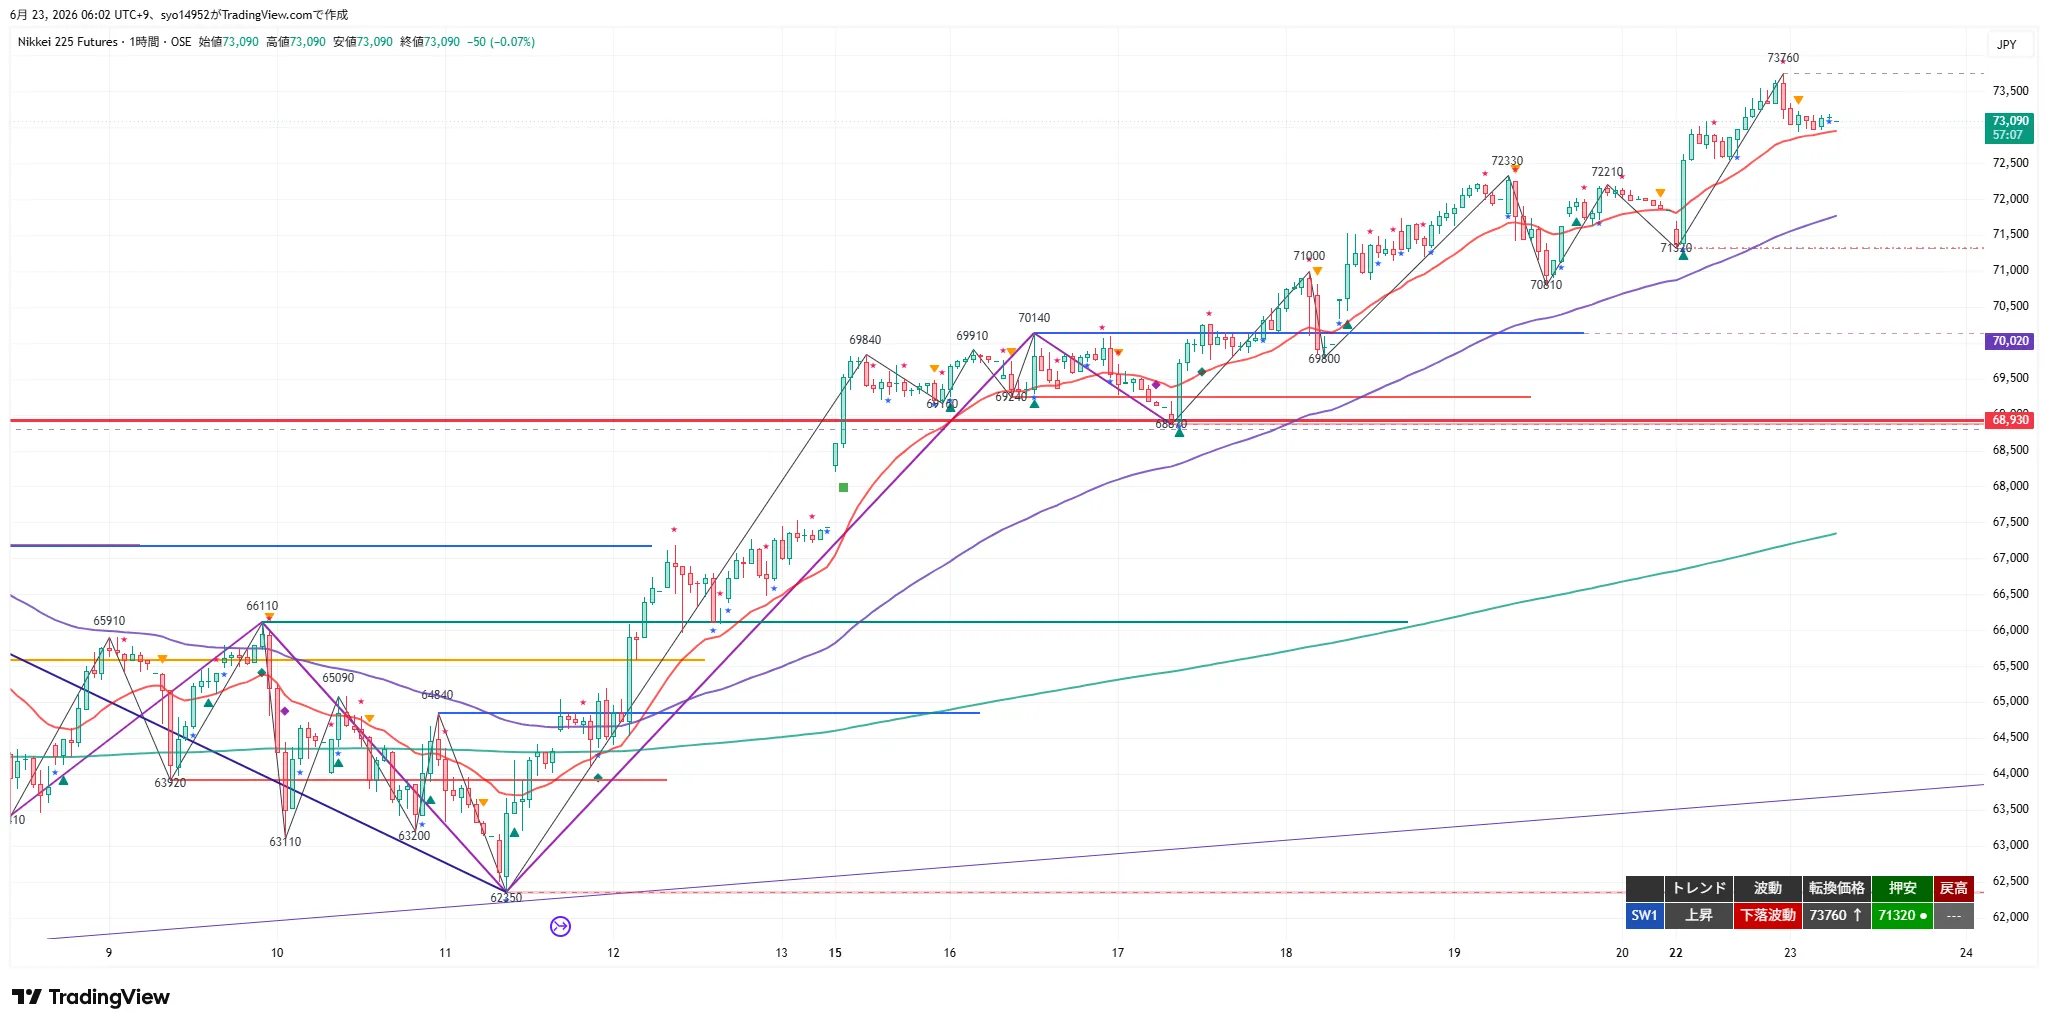
1H Analysis
The 1H is in an uptrend but after hitting the high of 73,760, prices retrace slightly into a down-move. The recent swing low is 71,320 and the pivot is 73,760. The 20EMA, 80EMA (4H 20EMA equivalent), and 480EMA (daily 20EMA equivalent) are rising, and price sits above them.
We expect continued upside with 72,550–72,000 as a base for upward trend. If 73,760 closes above on the 1H timeframe, the up-move resumes and new highs are pursued; if 72,550 closes below, expect a short-term correction, and a break below 71,320 would raise concerns for the up-move.
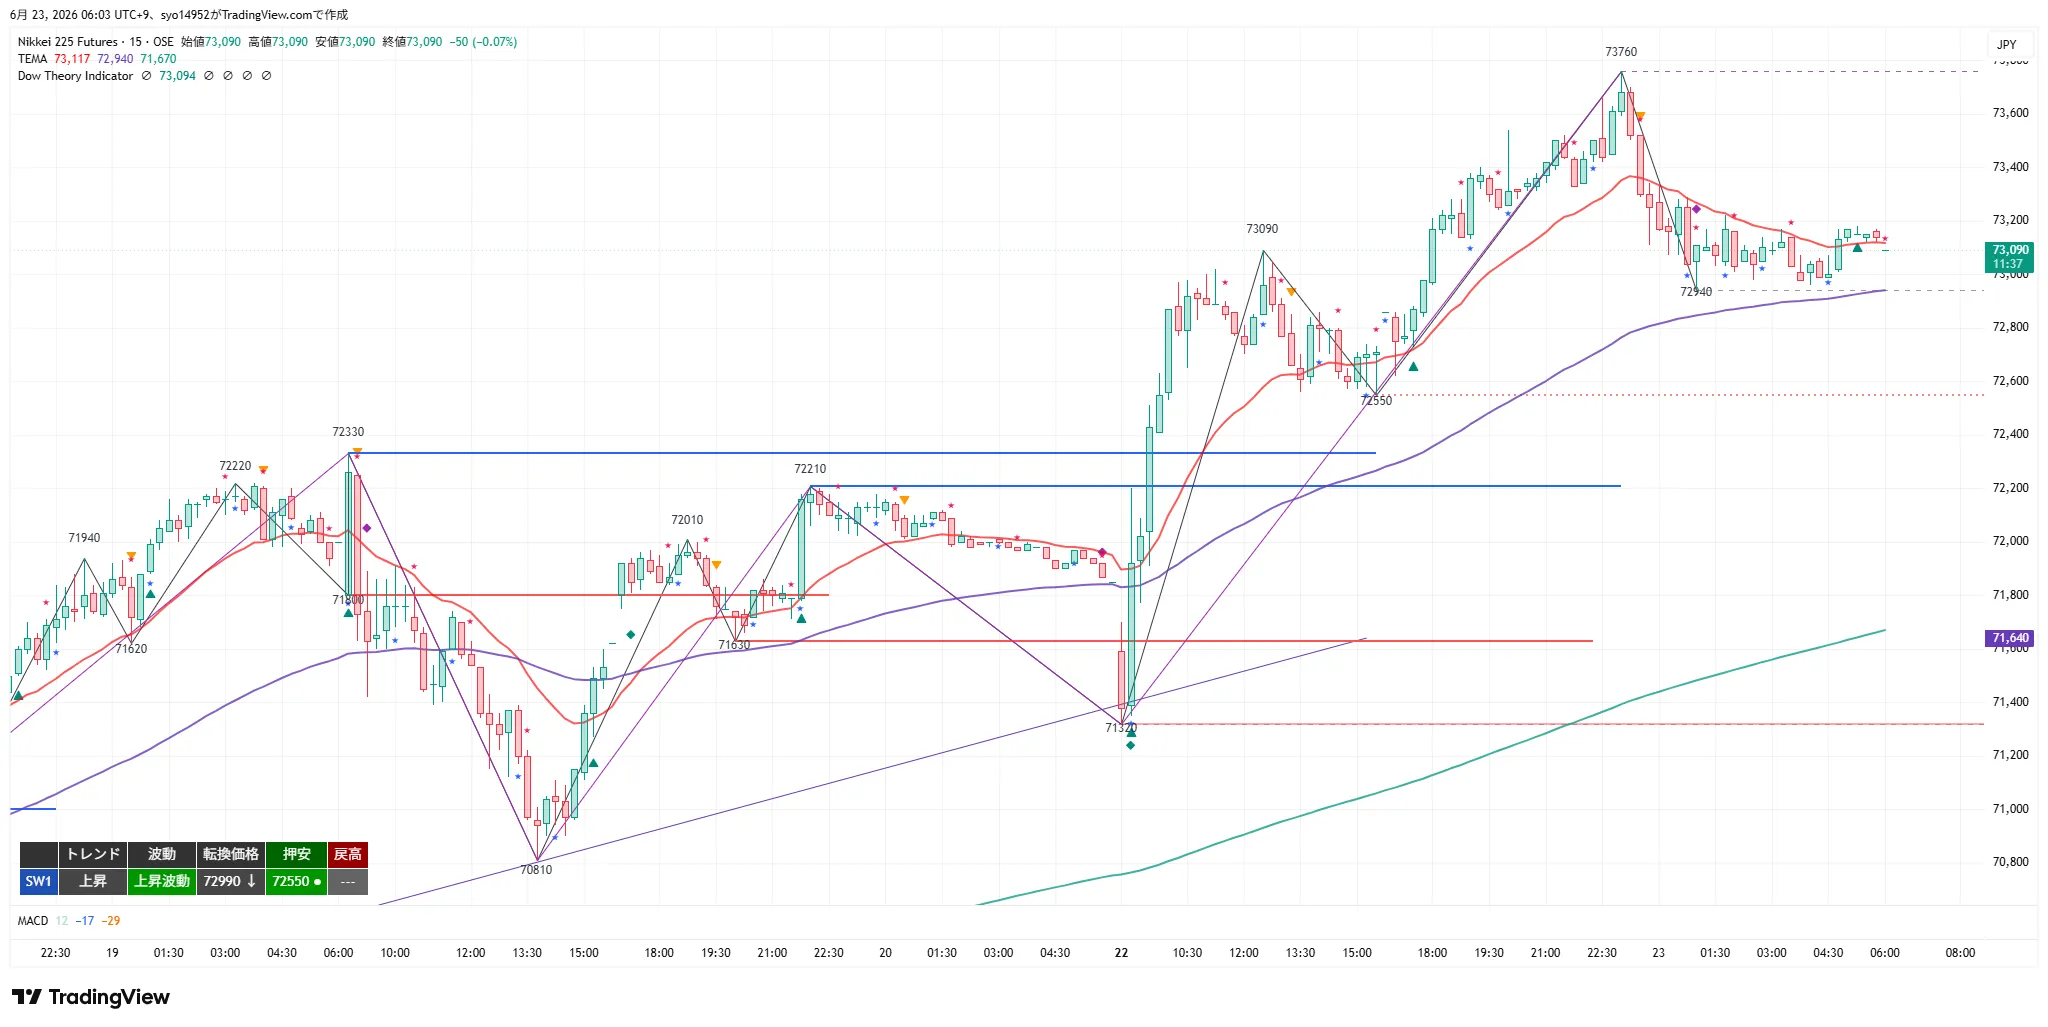
15m Analysis
The 15m is in an uptrend and up-move (turning point 72,990, support 72,550, resistance 73,760). After advancing to 73,760 during the day, it pulled back to 72,940 but did not break 72,550 support, then rebounded to close at 73,090. The 20EMA is flat to up, while the 80EMA (1H 20EMA equivalent) and 320EMA (4H 20EMA equivalent) are rising, with price around them.
In the short term, supports at 72,550 to 72,000 (shallow) and 72,250 to 72,000 (gamma nodes to old call walls) allow for continued rise with a close above 72,990 on the 15m to maintain the up-move and push to 73,760 on a close. Avoid premature reversals since the 20EMA is flattening.
MTF State
- 4H: Up / Upward wave. Day session breaks above 72,000 → Night session reaches 73,760 new high and closes at 73,090. 20EMA/20SMA rising. Conversion at 71,320; support at 68,870; resistance etc.
- 1H: Up / Downward move. After 73,760 high, slight pullback, closes at 73,090. Conversion at 73,760; support at 71,320. All MAs rising; price above them.
- 15m: Up / Upward wave. Conversion at 72,990; support at 72,550; resistance at 73,760. After 73,760, pullback to 72,940 but does not breach 72,550; rebounds. 20EMA flat to up; 80EMA and 320EMA rising.
- Consistency: 4H uptrend and upward wave, 15m also upward wave, aligning direction, while 1H shows a small pullback from the 73,760 top (a down-move). Prioritize higher timeframes; buy the dips as the core approach, with 1H down-move seen as a pause at high prices. Sell the rallies as a counter-trend in the context of higher-timeframe uptrends; limit pullback plays to counter-trend in higher timeframes.
OI & Gamma Analysis (June 22 Confirmed)
Based on option positions and gamma (how much hedging activity occurs when price moves), identifying upside targets, downside supports, and price zones where price tends to stall.
- 72,000 yen call wall has already been breached.Previously the strongest magnet and price ceiling at 72,000 (highest gamma) accelerated to 73,760 after the night breakout (gamma squeeze occurred). 72,000 is now left behind and has become a support turned level for downside nodes.
- On the upside, gamma is thin and the next thick wall is 75,000.Minor resistance steps are 72,250 → 73,000 → 73,500 → 74,000; the gap to 75,000 is relatively wide, making breakouts above 75,000 more feasible. The thinner the gamma area, the more easily price can break higher.
- A new pillar is forming at 73,000.On 6/22, large foreign buyers boosted call positions near this price (positions +836). This area is likely to be a key near-term focal point.
- Downside supports at 72,000 and 70,000 are gamma supports.Zones around 72,000 (old pin) and 70,000 have dense gamma, making downside moves harder; put positions are also sizable (PCR around 1.6), limiting sharp declines.
- Center of gravity (max pain) is mid-term around 65,000.
Note: The strength of gamma is based on real data, but the direction (long or short) held by dealers is estimated for the current price region. Gamma effects are strongest near July options expiration.
Important Prices
- 73,760 yen: Night high / most recent high. Break above may push to new highs.
- 73,500 yen: Thin gamma node (passing point).
- 73,090 yen: Current price / Night close.
- 73,000 yen: New gamma pin forming (large foreign accumulation on 6/22).
- 72,990 yen: 15m conversion. 15m up-move baseline.
- 72,550 yen: 15m swing low / major near-term support. Shallow pullback zone lower bound / short-term divergence.
- 72,250 yen: Gamma node. Upper bound of deep pullback zone.
- 72,000 yen: Former strongest gamma pin (breached). Now a downside node / support turned; lower bound of deep pullback zone.
- 71,320 yen: 4H/1H conversion / most recent supportive low. Most important support.
- 70,810 / 70,140 yen: Prior swing low / prior high (support turned).
- 68,870 yen: 4H swing low (recent structural support). Final candidate for deep pullback.
- 62,350 yen: 4H/1H swing low (structural low). Most important downside.
Trade Ideas
① Breakout Following (Long)
- Trigger: Break above 73,760 (night high) with a 15m close to make new highs. Confirm continuation by closing above 72,990 (15m conversion).
- Lead: After breakout, pullbacks toward breakout price area or around the inclined 20MA with short-term timing (back-entry, breakout-price basis).
- Entry Condition: 73,760 recrossed on a 1H close.
- Stop/Invalidation: If breakout portion falls below 72,940 (pre-break), or the main entry breaks below 72,550.
- Targets: 74,000 (partial take + cost basis), 75,000 (next thick gamma wall / medium-term target).
- Risk-Reward: T1 (74,000) = 0.3 / T2 (75,000) = 1.5. After closing above, use back-entry only for the main position; reward potential is mainly at T2. On the upside, gamma is thin making breakout easier to extend.
- MFE Protection: Exit or reduce to break-even at +200 yen, secure at least +100 yen or trail at +300 yen. Early protection is advised due to overheating right after breaking 72,000.
② Buy the Dip (Long)
- Standard conditions: Zone 1 (shallow pullback) = 72,550–72,000 (15m swing low to old call wall = support turned), Zone 2 (deep pullback) = 72,250–72,000 (gamma node to old call wall) with rebound confirmed by 15m close. If deeper, 71,320.
- Entry Condition: 72,990 recaptured on a 1H close.
- Stop/Invalidation: For the leader, 72,450 below Zone 1 or 71,900 below Zone 2; for the main position, 72,000 break. Fully exit below 71,320.
- Targets: 73,760 (partial take + cost basis), 74,000–75,000.
- RR: Zone 1 T1=5.6 / T2=6.8. Zone 2 T1=8.3.
- MFE Protection: Exit at break-even or small profit at +200, secure at least +100 with +300 trailing. The downside is supported by gamma nodes at 72,000 and 70,000, but due to high price area, prioritize shallow pullbacks and protect early.
③ Sell the Rallies (Short)
- Standard conditions: If 72,550 (15m swing low) is breached on a 15m close, targets are Zone 1 (shallow pullback) = 72,990–73,090, Zone 2 (deep pullback) = 73,500–73,760, with a close below to confirm (range-limited pullback).
- Entry Condition: Break below 72,000 on a 1H close.
- Stop/Invalidation: Leader recovers to 73,200 (Zone 1) or 73,790 (Zone 2); main position recovers to 73,760. Strong invalidation at 73,760 (night high recovery).
- Targets: 72,000 (partial take + cost basis), 71,320–70,810.
- RR: Zone 1 T1=5.0 / T2=8.4.
- MFE Protection: Exit at break-even or small profit at +200, secure at least +100 with +300 trailing. Since 4H and 15m are rising and the downside is gamma-supported, avoid deep chasing; use limited pullbacks and avoid going below the 20MA on expansions. If trigger confirmed and T1 reached, hold off.
④ Breakout Following (Short)
- Trigger: Break below 72,000 (old call wall = support turned ⟶ 15m structural support) with a 15m close (collapse of up-move).
- Lead: After the break, pullbacks toward breakout price area or inclined 20MA with short time frames (back-entry, breakout-price basis).
- Entry Condition: Break below 71,320 on a 1H close.
- Stop/Invalidation: Leader recovers to 72,310; main position recovers to 72,550. Full exit at 72,990.
- Targets: 71,320 (partial take + cost basis), 70,810 / 70,140.
- RR: T1 (71,320) = 2.2 / T2 (70,810) = 3.8.
- MFE Protection: Exit at break-even or small profit at +200, secure at least +100 with +300 trailing. With 4H and 15m in uptrend and downside gamma-supported, expect limited downside until 72,000 breach; be cautious of false breakouts and sharp reversals from new highs.
Current Actions
- Most important Line 1: 72,550. Maintain and rebound to continue dips-buying (trend-following). A close below 15m would signal a correction toward 72,250→72,000.
- Most important Line 2: 73,760. A close above on the 15m confirms new highs and breakout-following long (upside gamma is thin and likely to extend toward the next thick wall at 75,000). Due to overheating right after breaking 72,000, protect with MFE early.
Entry price, trigger, and stop levels are set based on the chart shape at the close of each period (conversion price of each timeframe, swing low, and swing high). If the structure changes over time but there is no higher-timeframe structural change, entry prices on lower timeframes (e.g., 15m) can be adjusted toward the form that matches reality better, comparing to the initially set values. Zones for Buying the Dip ② and Selling the Rally ③ are shown as two ranges (shallow and deep). In highly liquid periods (daytime opening to active hours, near NY Open), triggers may occur slightly before touching the zones. In that case, if the rebound/slowdown shape is confirmed by a 15m close near the zone, consider the trigger valid (do not enter far from zone). The OI and Gamma analysis (6/22 confirmed) shows the previously strong 72,000 ceiling was breached and squeezed; 72,000 became a lower-level support, while the next barrier is 75,000. Short-term triggers are judged by each timeframe’s structure.
Note: This report is for information purposes and not investment advice. Trading decisions are the responsibility of the reader.