
NK225先物 MTFダウ理論 4シナリオ分析レポート 2026-06-22(日中セッション用)
NIKKEI 225 Futures MTF Dow Theory Analysis Report
Date and Time: June 20, 2026 09:02 JST / Night Session Close
Current Value: 71,850 JPY
Subject: For Intraday Session (Starting Monday, 6/22)
Conclusion
In summary, the night session broke above 72,000 to 72,330 but could not sustain it, and slipped to 71,850 by closing after a 72,210 dip. The 4H chart maintains a bullish trend and upward wave, but the 1H shows a range/declining wave, and the 15m shows an uptrend/decline wave, with a congestion around the 72,000 call wall. Through Monday, the basic strategy is to buy dips and ride breaks backed by the 4H upmove, with an upside break on a 71,980/72,210 close above, and a rebound in the dip zones (71,630–71,000 / 70,810–69,800). The 72,000 call wall is heavy in front; if a definitive close above it occurs, gamma squeeze could accelerate to the upside (72,250→75,000), while the downside is likely to be supported by long gamma on the put side and less prone to sharp drops. Watch for a gap at Monday open due to the weekend.
A dip-buying rally maintaining 71,630 and closing above 71,980→72,210→72,330 would imply an upside break and breakout-following long (72,000 breakout would imply squeeze toward 72,250→75,000). Dip targets are 71,630–71,000 (shallow) and 70,810–69,800 (deep). If 70,810 is breached on the 15m close, deeper correction toward 69,800 is possible. The 72,000 call wall is a heavy overhead; until a confirmed breakout, protect MFE with early exits.
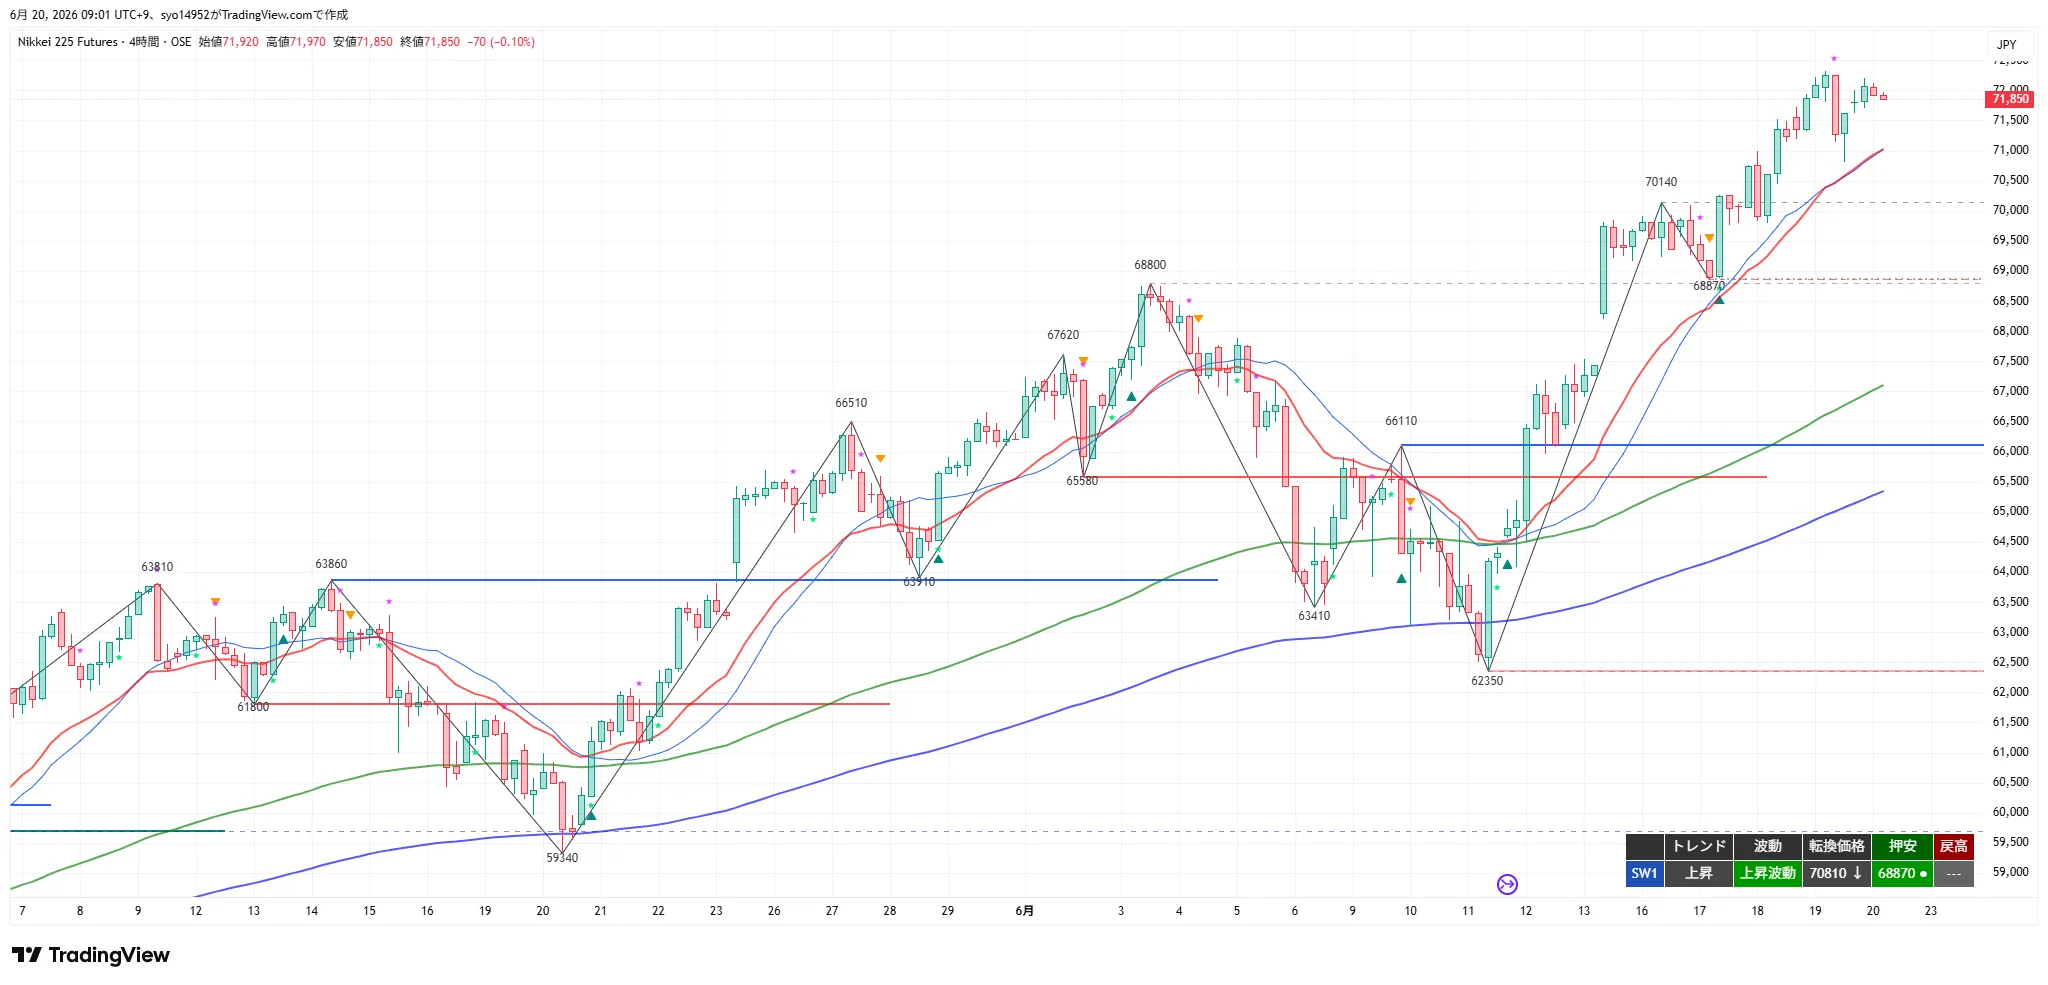
4H Analysis
The 4H chart continues the uptrend and upward wave, but it closed around 71,850 in the high zone near 72,000. The latest swing low is 70,810. The 20EMA/20SMA are rising, and price remains well above the 120EMA (roughly 67,000 on daily) and 200EMA (psychological landmark), supporting the bullish tone.
Resistance is open-ended toward 72,330 (night high), with the next level near 72,250–(72,000 breakout would push toward 75,000 if a squeeze forms). Support is at 71,630 (15m swing low), 71,000 (support turn), 70,810 (4H turning point), 70,140–69,800 (previous highs / 1H swing lows), 68,870 (4H swing low), 66,110 (support turn), and ultimately 62,350. As long as 62,350 holds, the overall trend is up, but be wary of the heavy wall at 72,000 and overheated high-price zone.
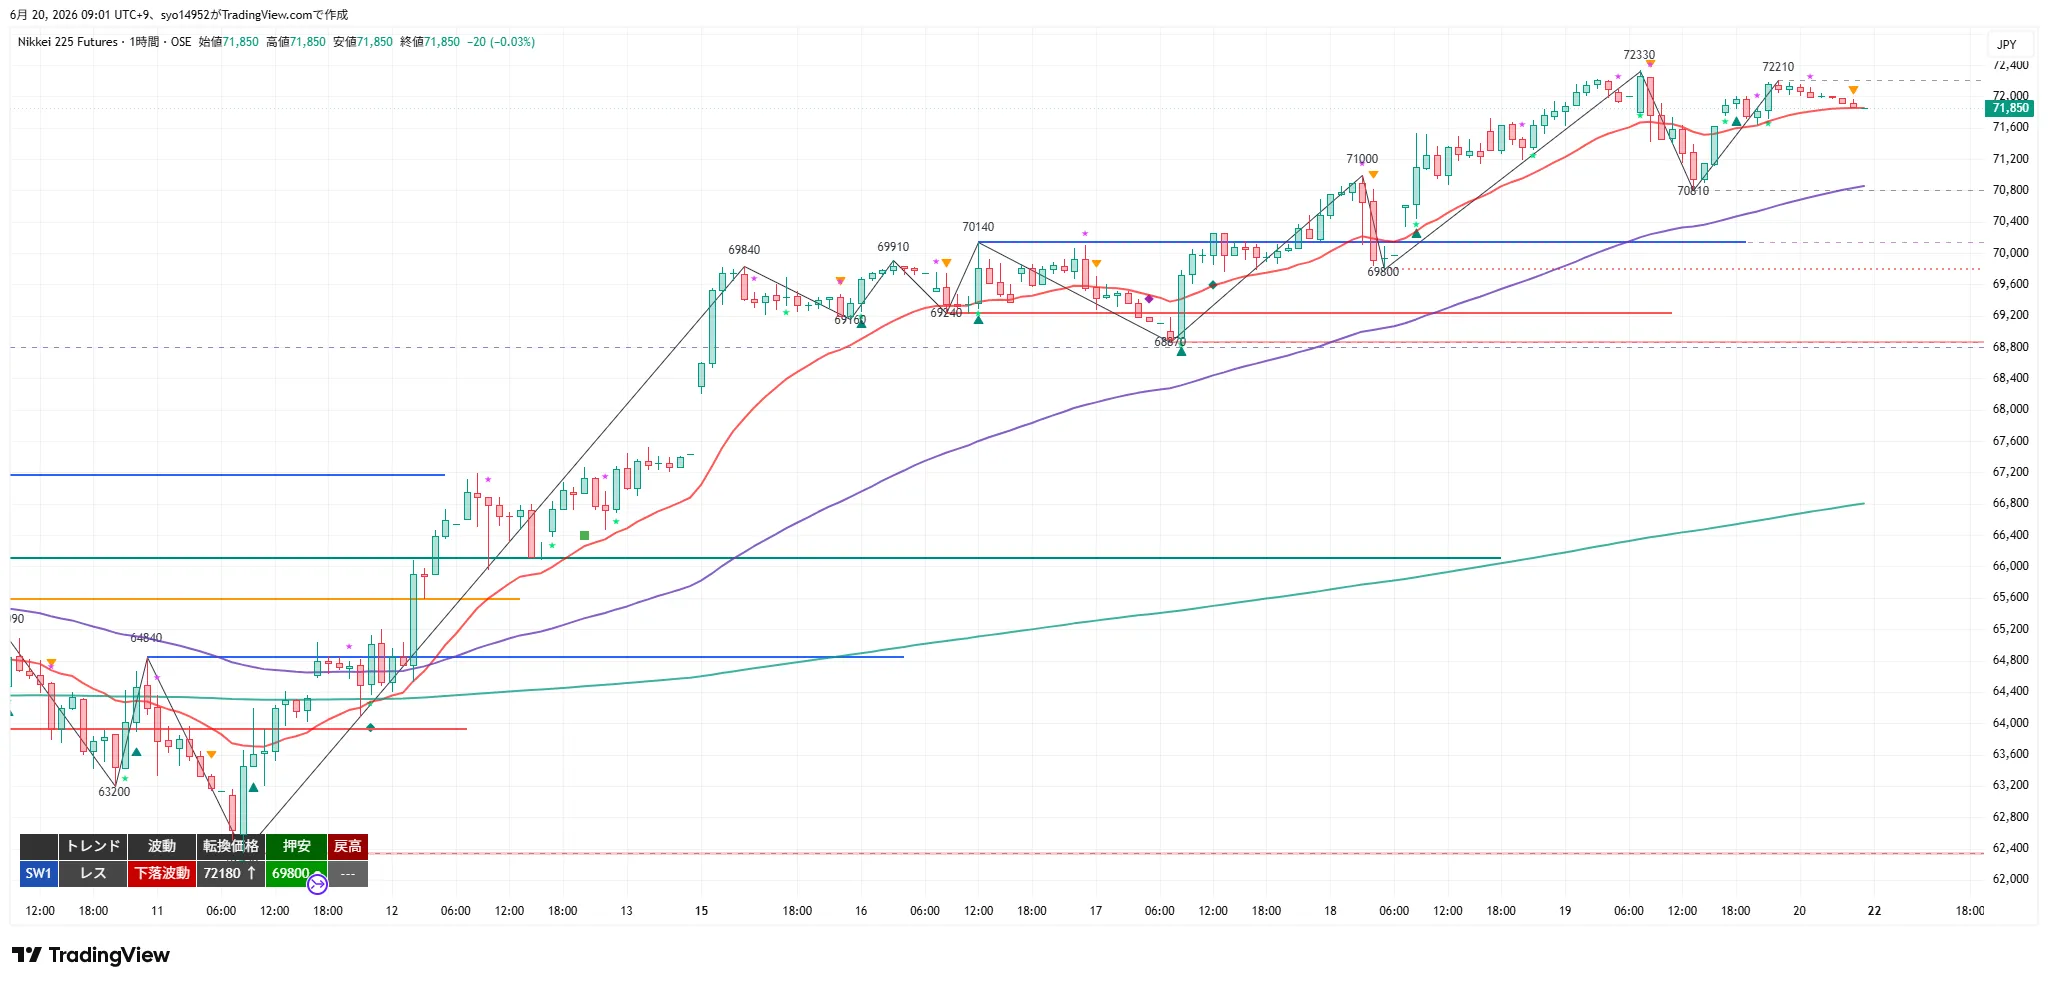
1H Analysis
The 1H trend has become range-bound and turned into a down wave. The latest swing low is 69,800, with a turning point at 72,180. The 20EMA/80EMA (4H 20EMA equivalent) and 480EMA (daily 20EMA equivalent) are rising, with price around their upper vicinity.
Expect further upside in the 71,630–71,000 dip-buy zone, and a return to uptrend if the 1H close recovers above 72,180, putting new highs in reach. If the 1H close breaks 70,810, a downtrend continuation signal appears, with 69,800 as a deeper correction target.
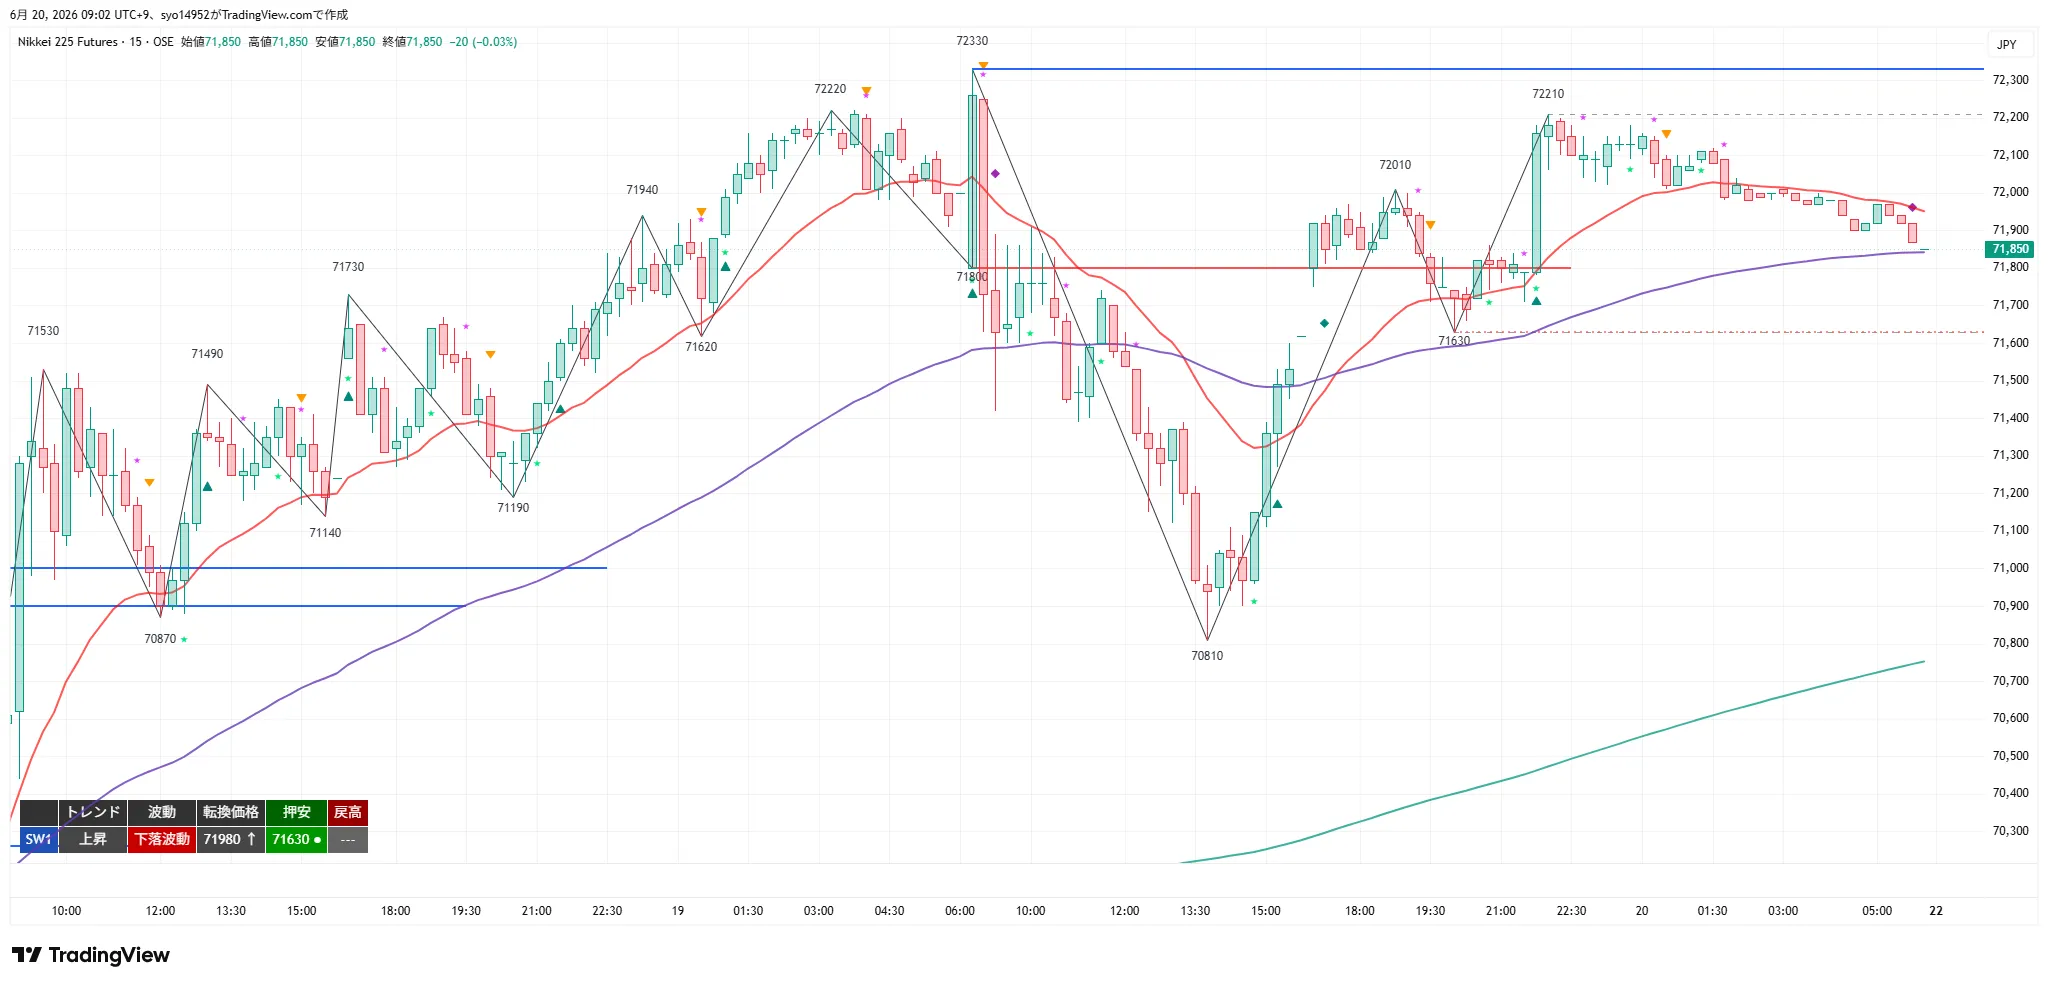
15m Analysis
The 15m chart shows an uptrend but has entered a down-wave phase (turning at 71,980, dip at 71,630, high retest at 72,210). After the 72,210 peak, prices trend lower, with the 20EMA flattening, while the 80EMA (1H 20EMA equivalent) and 320EMA (4H 20EMA equivalent) rise, keeping price near the 20EMA.
In the short term, support at 71,630 holds and a close above 71,980 on the 15m chart would revert to an uptrend, with a close above 72,210–72,330 confirming a new high. If 71,630 closes below on the 15m, deeper adjustment toward 71,000 is favored. Since 20EMA is flat, avoid early counter-trade entries.
MTF State
- 4H: Upward trend / Upward wave. Price ranges around the 72,000 high area with a close at 71,850. 20EMA/20SMA rising. Turning point at 70,810; dip low at 68,870; rebound high near …
- 1H: Range / Downward wave. After 72,330 high, price retraced to 72,210 but faced selling pressure and closed at 71,850. Turning point at 72,180; dip low at 69,800. All moving averages rising; price around their upper vicinity.
- 15m: Upward trend / Downward wave. Turning at 71,980; dip low 71,630; retrace high 72,210. From the 72,210 top, price drifts lower. 20EMA flat; 80EMA & 320EMA rising.
- Consistency: 4H shows an uptrend/upward wave, while 1H is range/downward wave and 15m is uptrend/downward wave. With higher timeframes in control, use dips to buy but confirm with 15m down-wave retreat or 15m up-trend resumes before entering with trend-following moves. For rallies, only buy on pullbacks after higher-timeframe uptrends are confirmed; selling on pullbacks is limited to counter-trend actions in downtrend conditions of lower timeframes.
OI & Gamma Analysis (Mid-term Outlook / June 19 Confirmed)
From option positions and gamma (how much dealers hedge when prices move), the mid-term upside targets, downside supports, and price zones where prices tend to stall are identified.
- 72,000 JPY = strongest magnet and a ceiling for upside.Call open interest is largest (July: 5,788) and gamma strength is outstanding among all strikes (roughly double that of the next strongest 72,250). Prices tend to gravitate toward this level and stall (pin). This barrier also tends to cap upside. The previous night’s move to 72,330 extended but did not sustain and faced rejection near this wall.
- Upside target beyond the wall is 72,250→73,000.If price clearly closes above 72,000, hedge unwind could accelerate the rally (gamma squeeze), with next targets at 72,250 and 73,000. In a strong uptrend, dealers are assumed to be on the short side (selling into breaks). On 6/19 some positions around 72,000 were reduced (mostly by foreign participants), but it’s unclear whether buyers or sellers dominated; the ceiling may unwind and price could break higher. Whether a breakout is genuine should be judged by the close.
- Support at 70,000 is a key level.This zone also harbors gamma clusters (both calls and puts), making downside less likely to accelerate. Put open interest is relatively thick (PCR 1.66), giving additional downside support.
- Center of gravity (max pain) for the mid-term is around 65,000.Toward expiry, prices are likely to be pulled toward this center over the longer term.
Note: The “strength” of gamma is based on real data, but whether dealers are net long or short is an inference given current price ranges. Gamma effects are strongest near July options expiry.
Important Prices
- 72,330 JPY: Night high / most recent high. Break above signals new highs.
- 72,250 JPY: OI call cluster (upside outlook). Potential target after clear breakout above 72,000.
- 72,210 JPY: Recent pullback high / 15m retrace high. Break above implies resumed uptrend.
- 72,180 JPY: 1H turning point. Upward retrace target.
- 72,000 JPY: Maximum open interest wall. Front is heavy; a close above may imply a squeeze.
- 71,980 JPY: 15m turning point. Baseline for 15m uptrend rebound.
- 71,850 JPY: Current price / Night close.
- 71,630 JPY: 15m dip low. Lower bound of shallow dip zone; short-term inflection.
- 71,000 JPY: Milestone / support turn. Upper bound of deeper pullback zone.
- 70,810 JPY: 4H turning point / latest dip low. Lower bound of deeper dip zone; key support.
- 70,140 JPY / 69,800 JPY: Previous high (support turn) / 1H dip low. Potential deeper dip targets.
- 68,870 JPY: 4H dip low (recent structural support). Final candidate for deep pullback.
- 66,110 JPY: 4H prior retrace high = support turn. Medium-term support.
- 62,350 JPY: 4H/1H dip low (structural low). Most important downside.
Trading Ideas
① Breakout Following (Long)
- Trigger: Break above 72,330 (Night high) on a 15m close (new high). Supporting: close above 71,980→72,210 signals upward trend regression.
- Pre-conditions: After breakout, a pullback near breakout price or around the steeply rising 20MA on short-term charts, acting as a back-entry signal.
- Activation: Price recovers above 72,330 on 1H close and clearly breaches 72,000.
- Stop/Cancel: If breakout is not sustained and 71,630 or 71,000 break, exit.
- Targets: 72,250 partial profit plus cost basis; 75,000 as mid-term outlook and next OI level if 72,000 close breaks higher.
- Reward/Risk: T1 ≈ cost basis around 72,250; T2 ≈ 75,000. Use breakout confirmation before targeting higher rewards.
- MFE protection: Exit at +200 with break-even; or +300 to secure at least +100 or trail. Protect early since the 72,000 wall is overhead and could headwind the breakout.
② Buy the Dip (Long)
- Standard conditions: Zone 1 (shallow dip) = 71,630–71,000 (15m dip low–support turn), Zone 2 (deep dip) = 70,810–69,800 (4H turning point–previous high / 1H dip low); confirm rebound via 15m close. If deeper, 68,870.
- Activation: 71,980 recovers on 1H close.
- Stop/Cancel: For the lead position, Zone 1 break below 70,900 or Zone 2 break below 69,700; main position breaks 69,800. Full exit at 68,870.
- Target: 72,210 partial profit + cost basis; 72,330–75,000 if 72,000 breakout squeeze occurs.
- RR: Zone 1 T1=5.6 / T2=6.2. Zone 2 T1=11.6.
- MFE protection: Exit at +200 to cost or minor profit; or +300 to secure at least +100 or trail. Support on downside is likely from put-side long gamma, but due to high-price zone, prioritize shallow dips and protect early. If trigger is confirmed, skip further entries until a clear breakout.
③ Sell the Rests (Short)
- Standard conditions: Break 15m close of 71,630 (15m dip low) into Zone 1 (shallow pullback) = 71,850–72,180 or Zone 2 (deep pullback) = 72,210–72,330; confirm stall with 15m close (pullback-taking only).
- Activation: Break 71,000 on 1H close.
- Stop/Cancel: Lead position recovers to 72,210 in Zone 1 or 72,360 in Zone 2; main position recovers 72,330. Strong invalidation at 72,330 (night high recovery).
- Targets: 71,000 (partial profit + cost). 70,810–69,800.
- RR: Zone 1 T1=4.8 / T2=5.7.
- MFE protection: Exit at +200 to cost or minor profit; +300 to secure at least +100 or trail. As 4H remains bullish and downside is supported by put gamma, limit pullback trades to pullbacks only; avoid deep chasing. If the trigger is confirmed and T1 is reached, consider waiting.
④ Breakout Following (Short)
- Trigger: Break below 70,810 (4H turning point / latest dip low) on a 15m close (breakage of uptrend).
- Pre-conditions: After break, pullback near breakout price or around the rising 20MA on a short timeframe, for a back-entry and breakout-price basis.
- Activation: Break below 69,800 on 1H close.
- Stop/Cancel: Lead position recovers to 71,120; main position recovers to 71,630. Full exit at 72,000.
- Targets: 69,800 (partial profit + cost); 68,870 / 66,110 (support turn / mid-term support band).
- RR: T1 (69,800) = 3.3 / T2 (68,870) = 6.3.
- MFE protection: Exit at +200 to cost or minor profit; +300 to secure at least +100 or trail. With 4H rising and downside supported by put gamma, expect a muted downside until 70,810 breach; beware traps and sharp reversals from new highs. A pullback from the new high can be a false breakout with a rapid rebound; monitor for such signals.
Current Action
- Most Important Line 1: 71,630 JPY. Hold and rebound to continue dip-buying (trend-following). If 15m close breaks, expect correction to 71,000→70,810→69,800.
- Most Important Line 2: 72,000–72,330 JPY. In front of this wall, price is heavy, but a clear close above 72,000 signals a gamma squeeze breakout with breakout-following long (72,250→75,000). Protect MFE early until breakout is confirmed.
Entry prices, triggers, and stop levels are set based on the chart shapes at close (turning prices, swing lows, and swing highs of each timeframe). If structures change over time but higher-timeframe structure remains, entry prices may be adjusted to reflect lower-timeframe turning prices (e.g., where a short-term timeframe first turns lower and then re-enters uptrend), selecting the option that better matches real conditions. Watch for gaps at Monday open due to weekend. Zones for Dip Buy ② and Pullback Sell ③ indicate two ranges (shallow and deep), but during liquid daytime hours (open to active period, and around the NY open), zones may not be touched and triggers can occur slightly before the zone. If the rebound or stall shape near zone confirms on the 15m close, consider the trigger valid. Open Interest is tied to the mid-term outlook (June 19 confirmed), with 72,000 acting as a near-term heavy wall, and the downside defended by put gamma; short-term triggers are determined by the structure of each timeframe.
※This report is for information purposes and does not constitute investment advice. Please make your own investment decisions.