
【June 21, 2026】Ten to Chi Series 3 Types × Chart Verification (Dollar-Yen)
This time is a chart validation for USDJPY (Dollar/Yen). I will introduce a discretionary trading method using the Heaven and Earth series. From this time, to increase entry opportunities, I would like to verify the entry timeframe on a 15-minute chart.


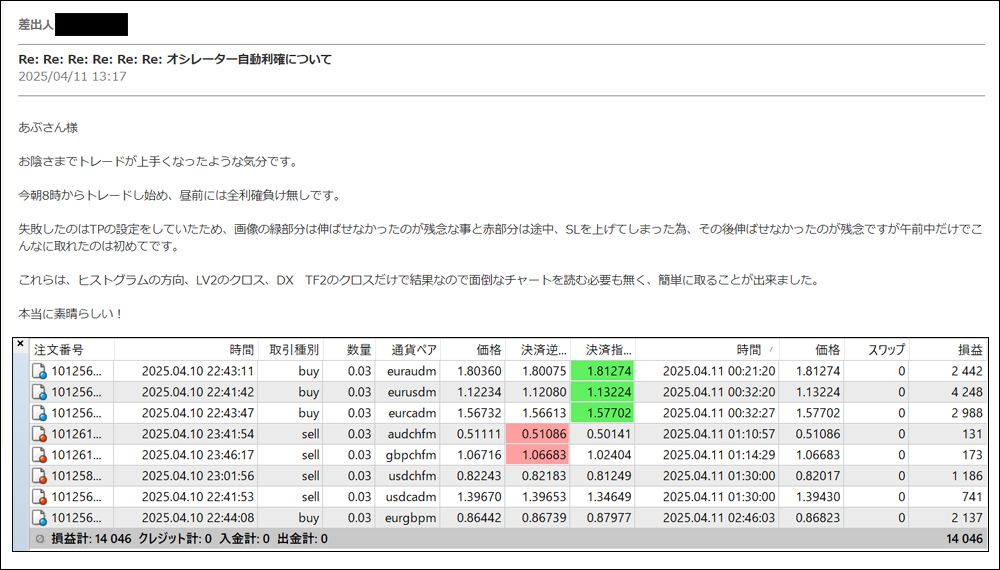
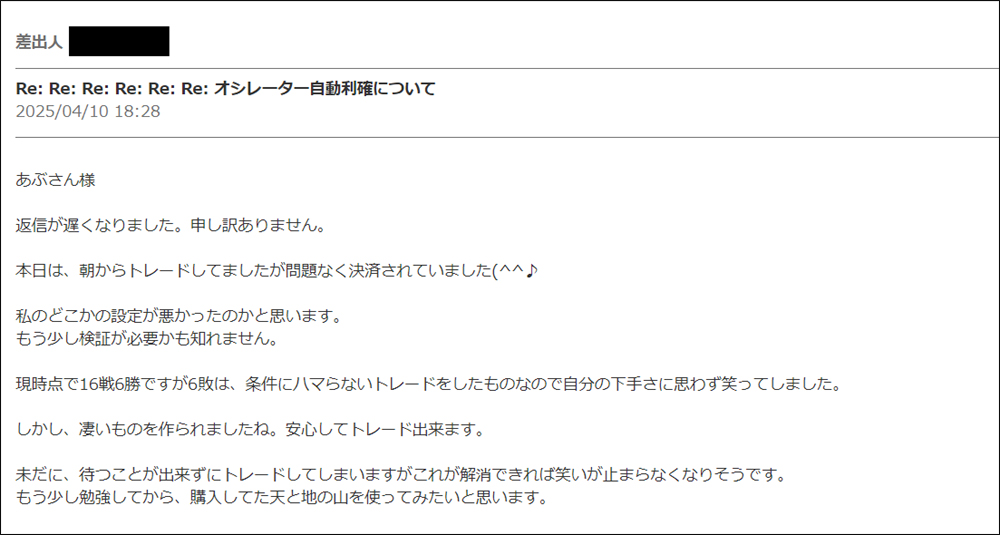
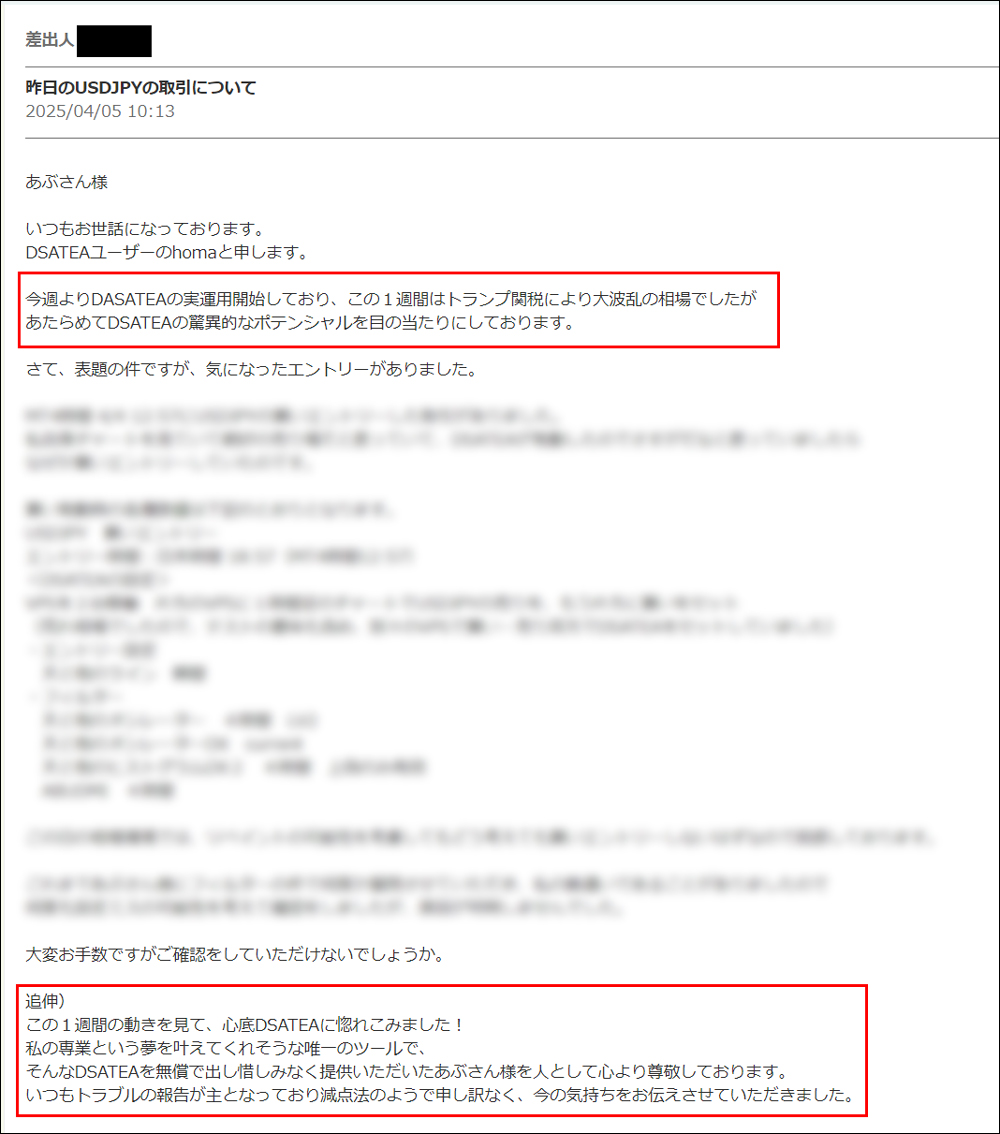
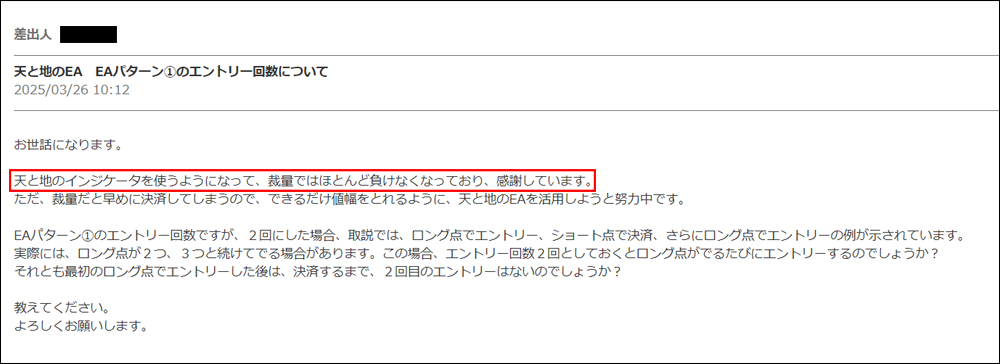
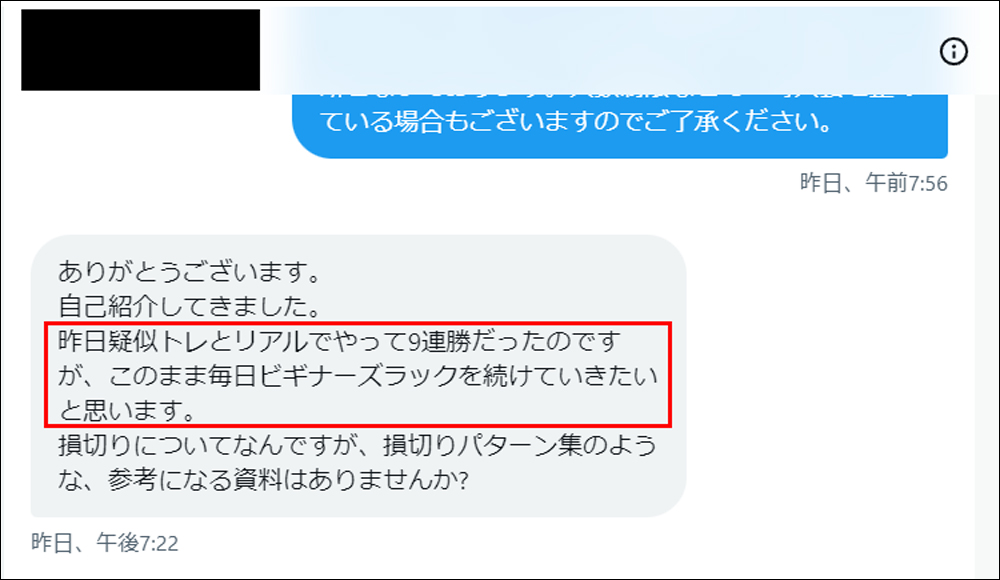
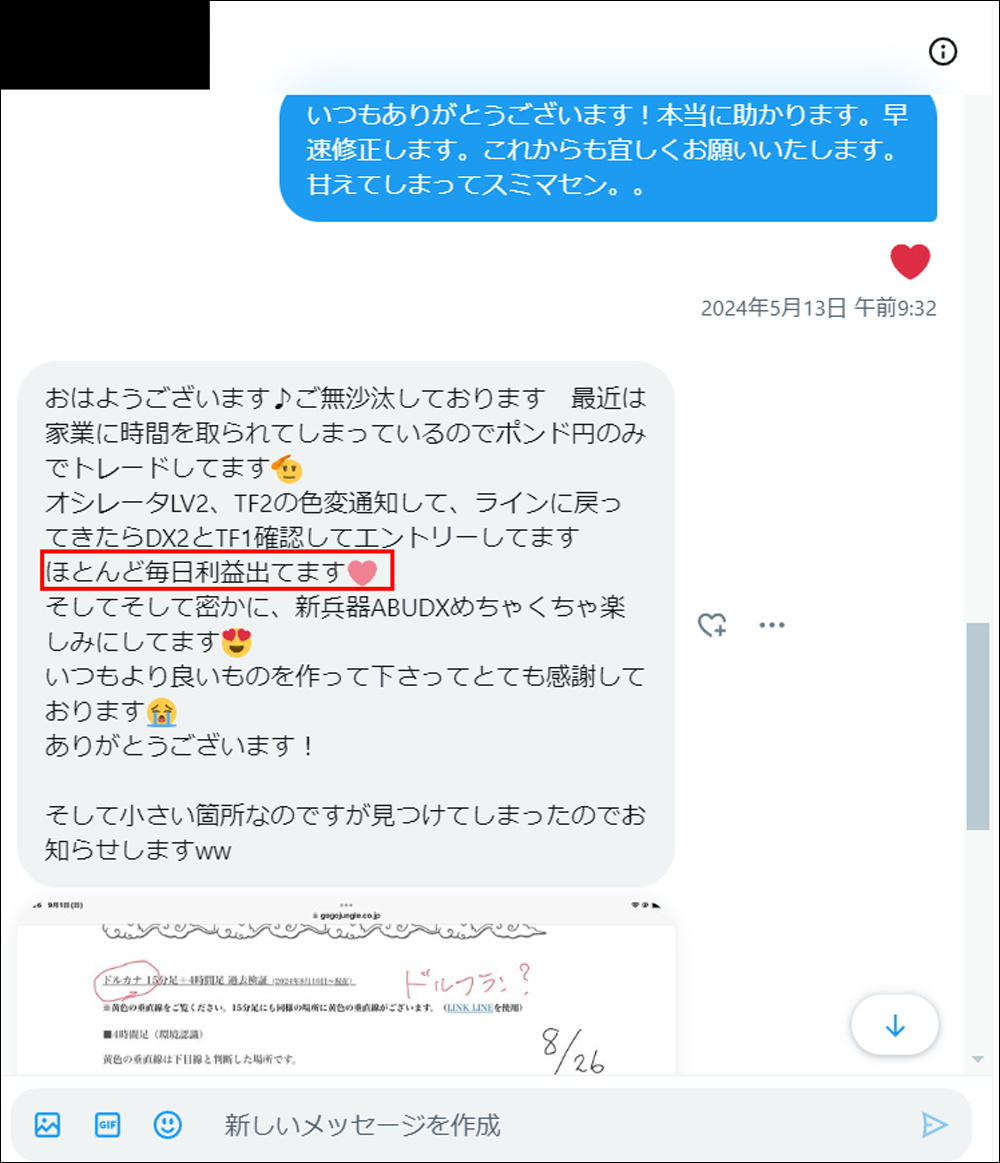
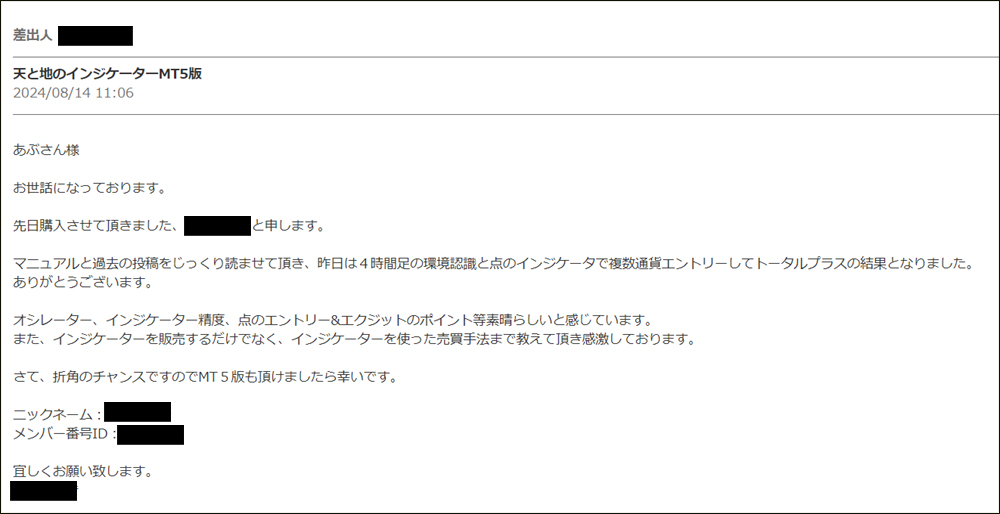
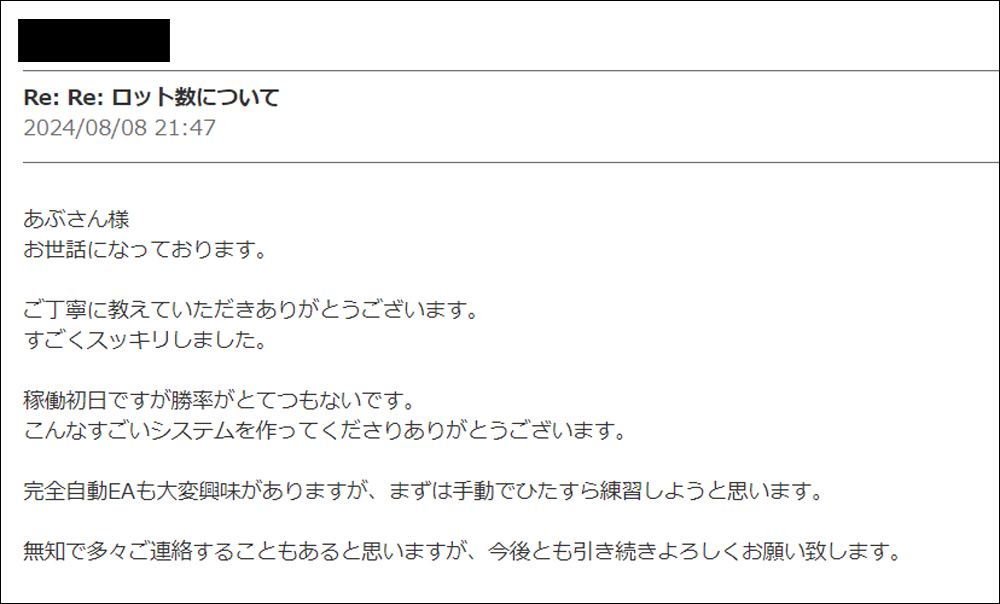
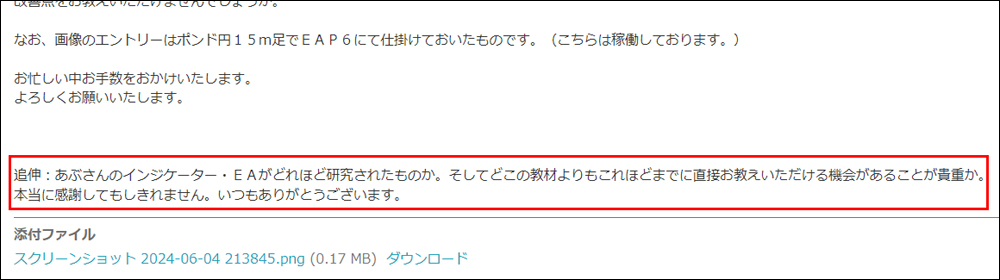
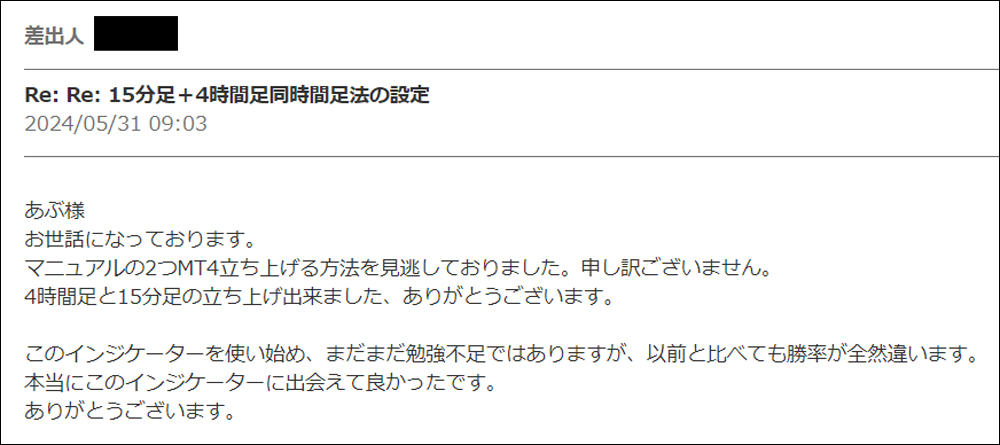
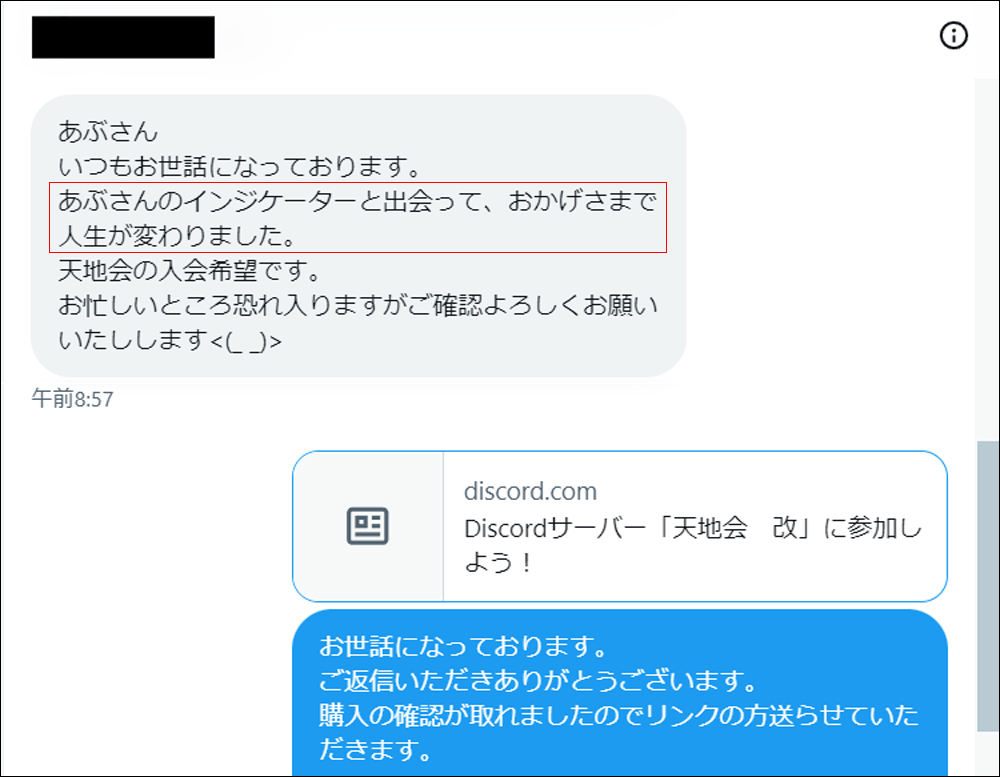
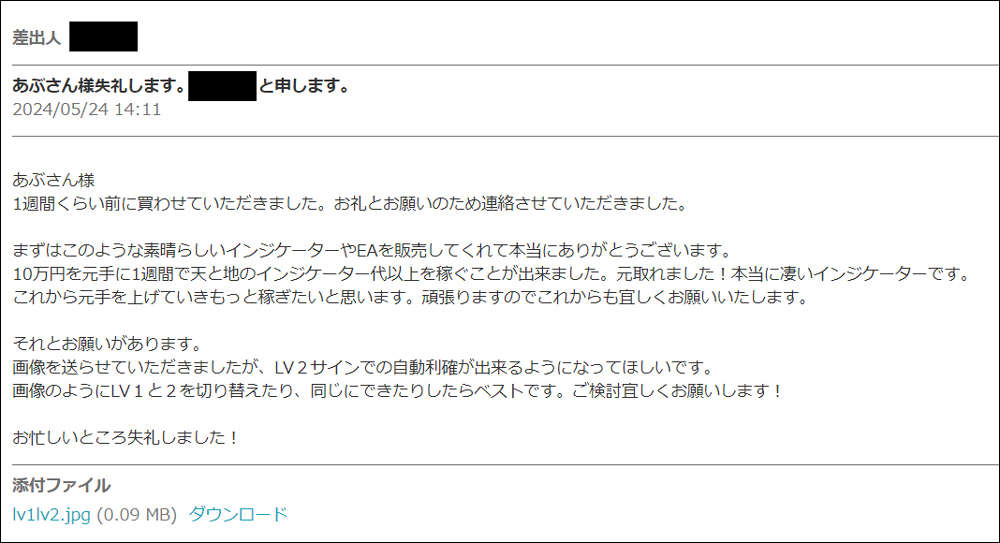
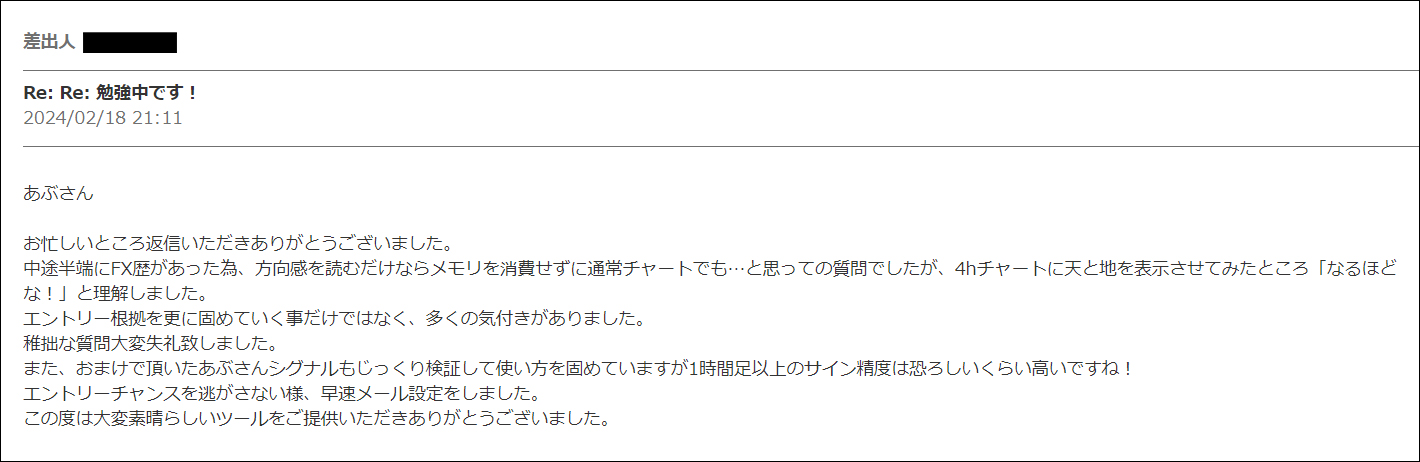
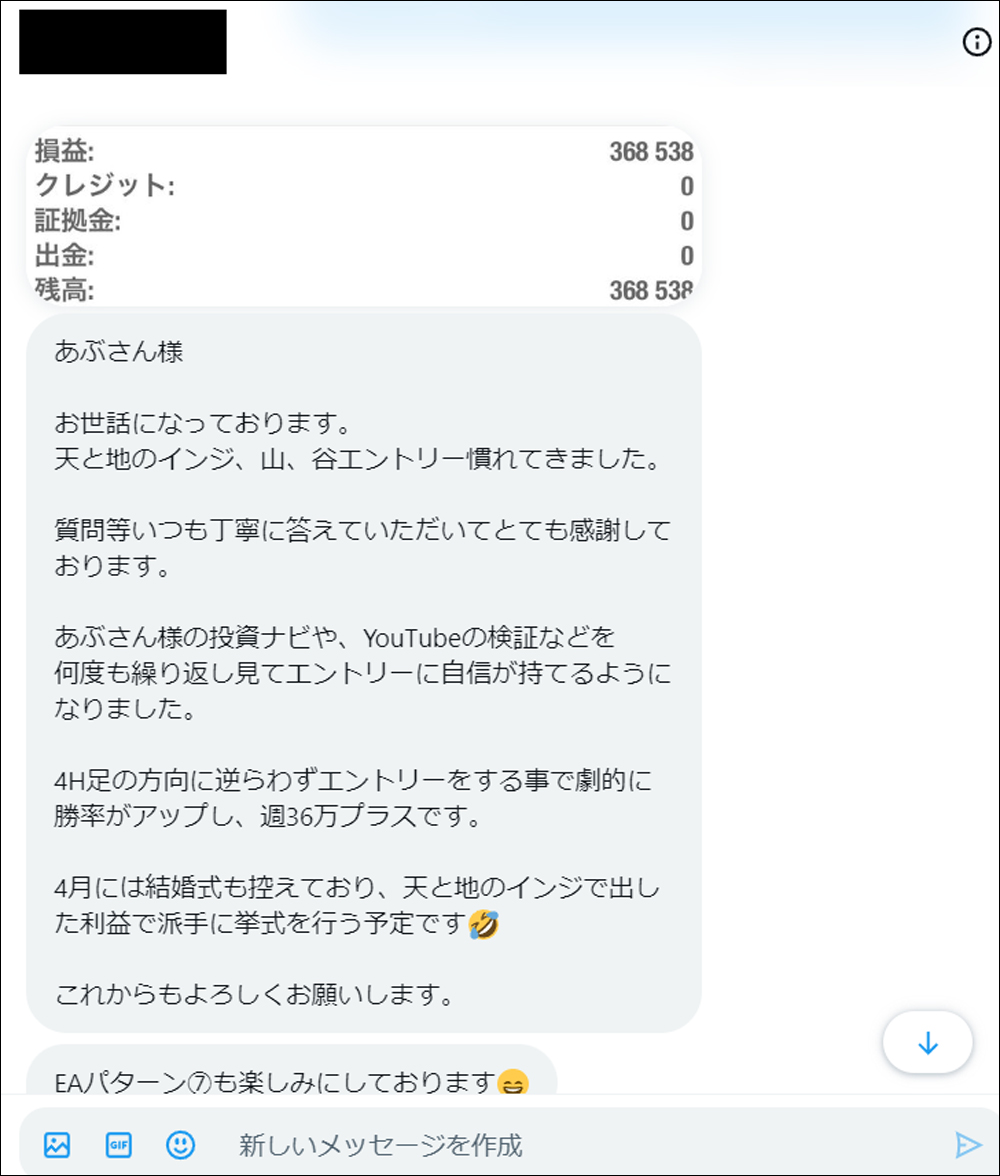

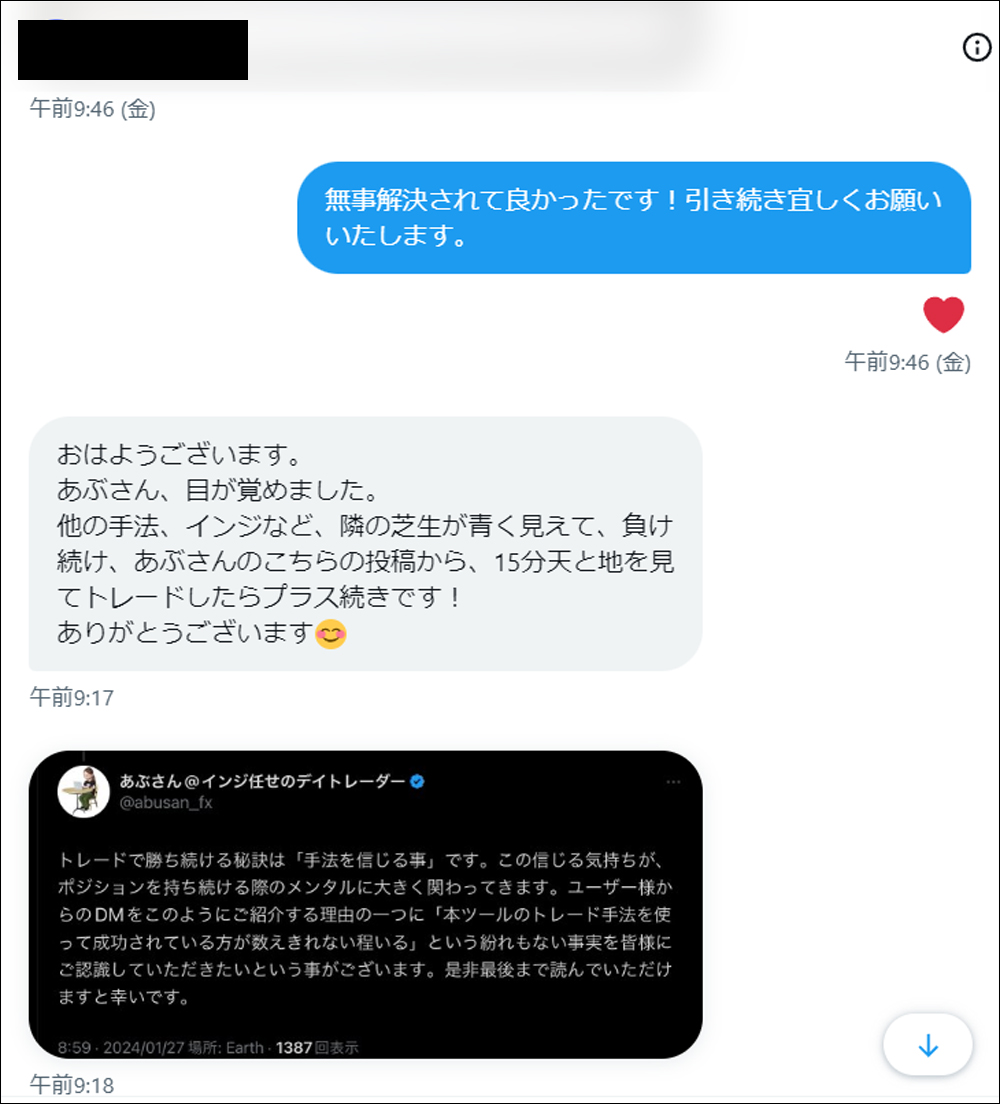
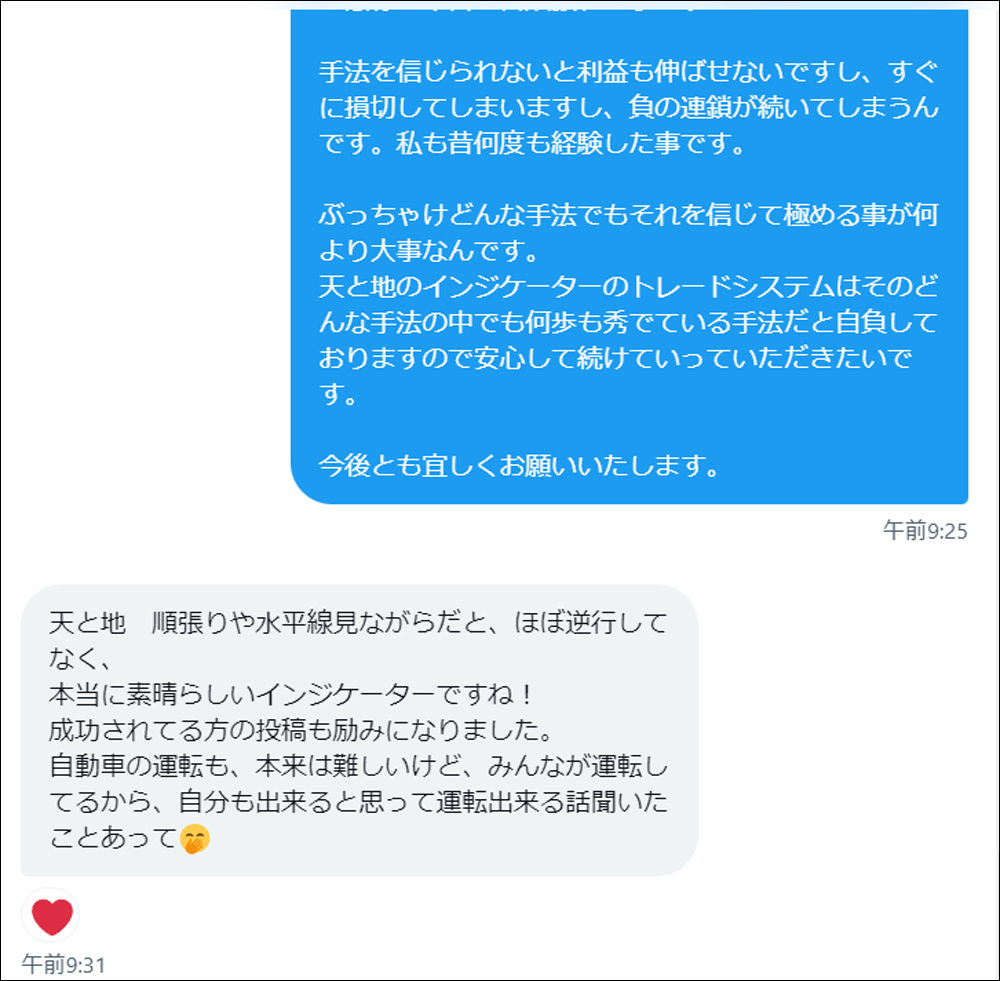
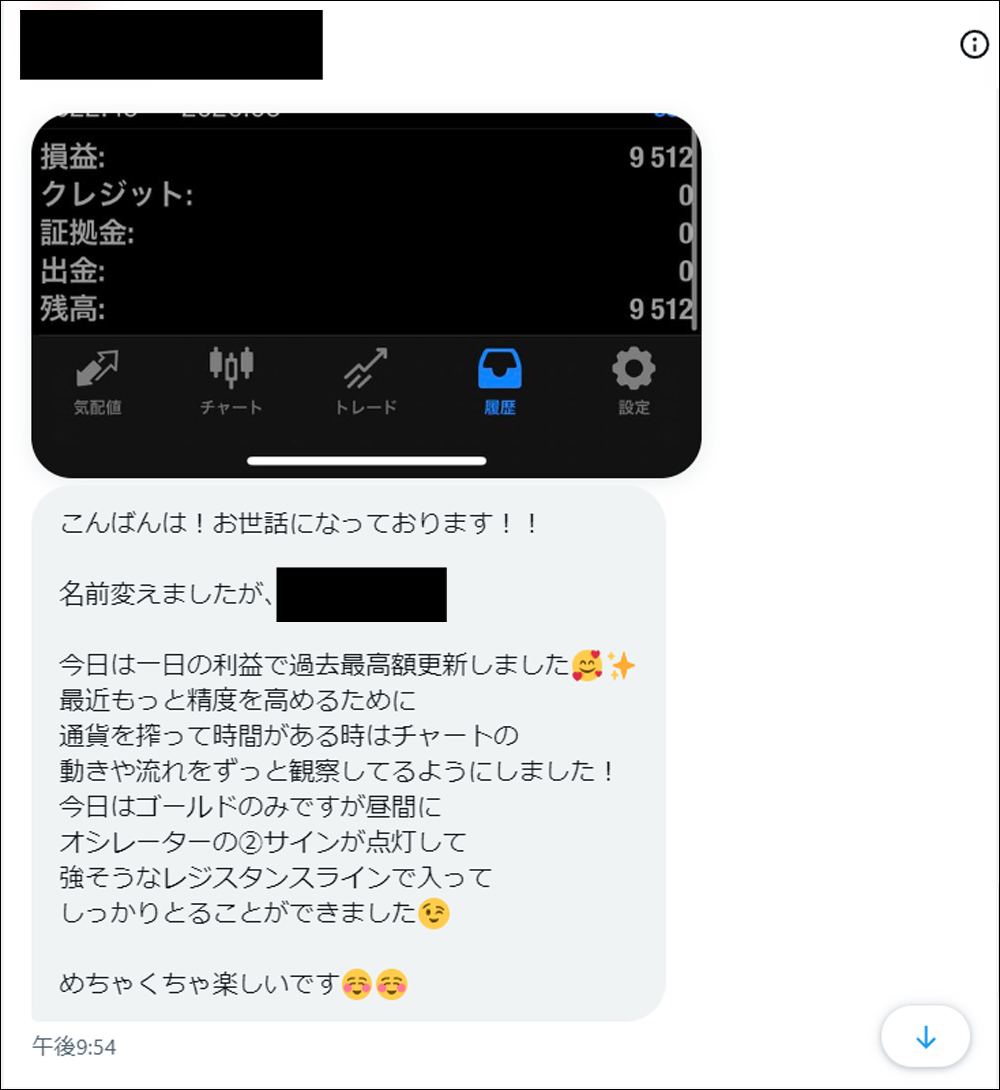
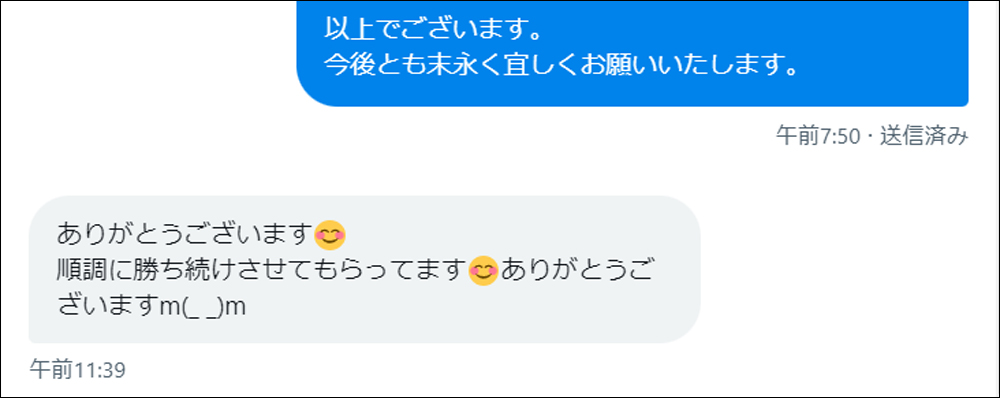
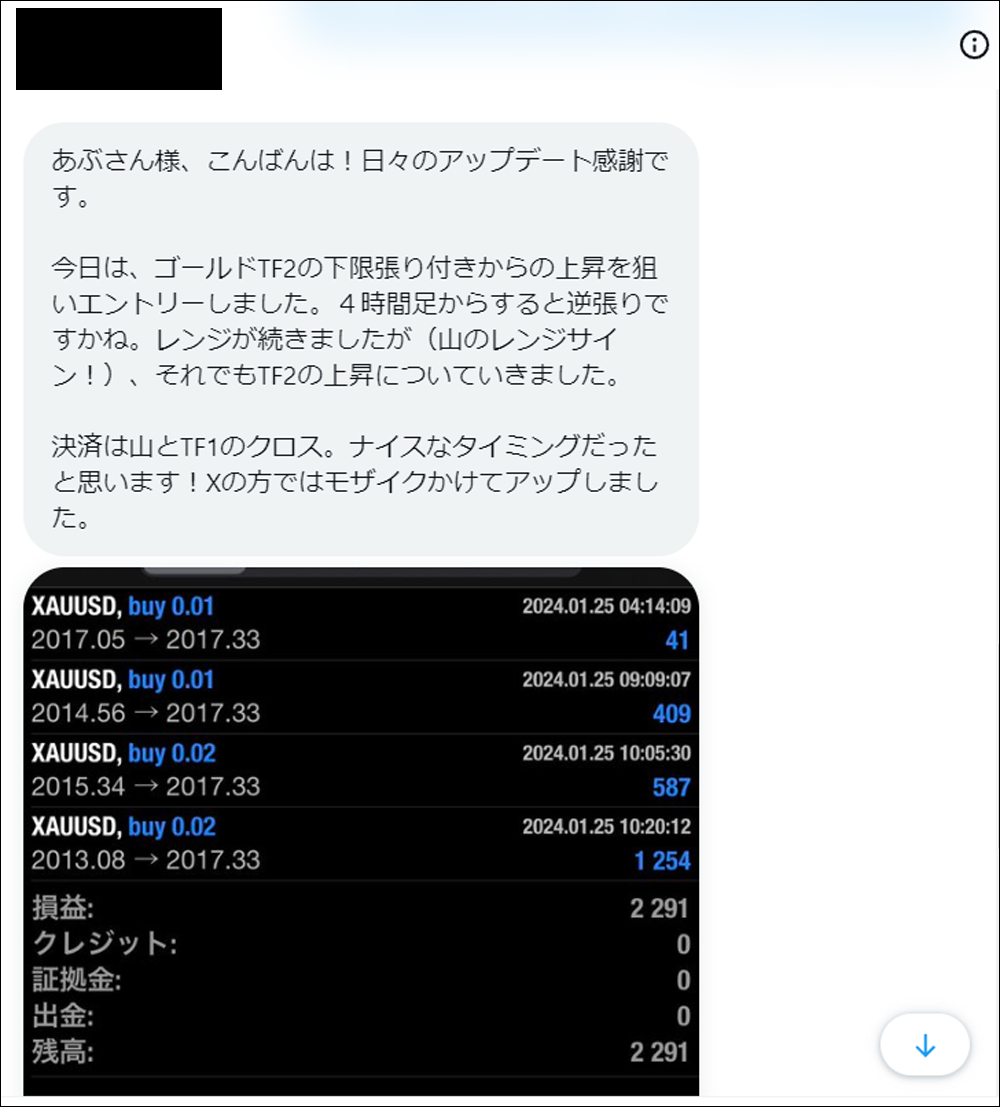
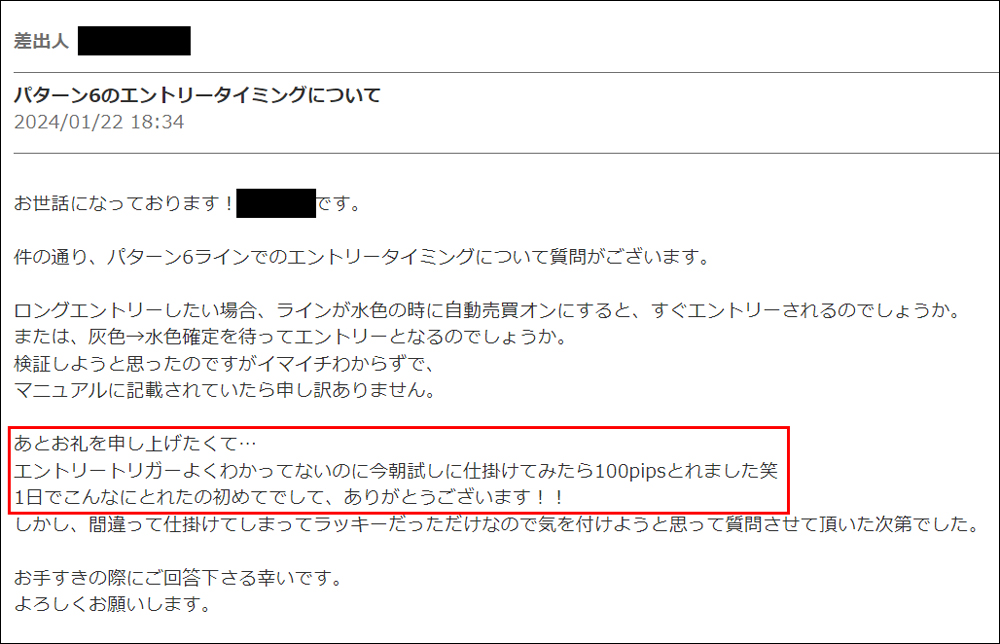
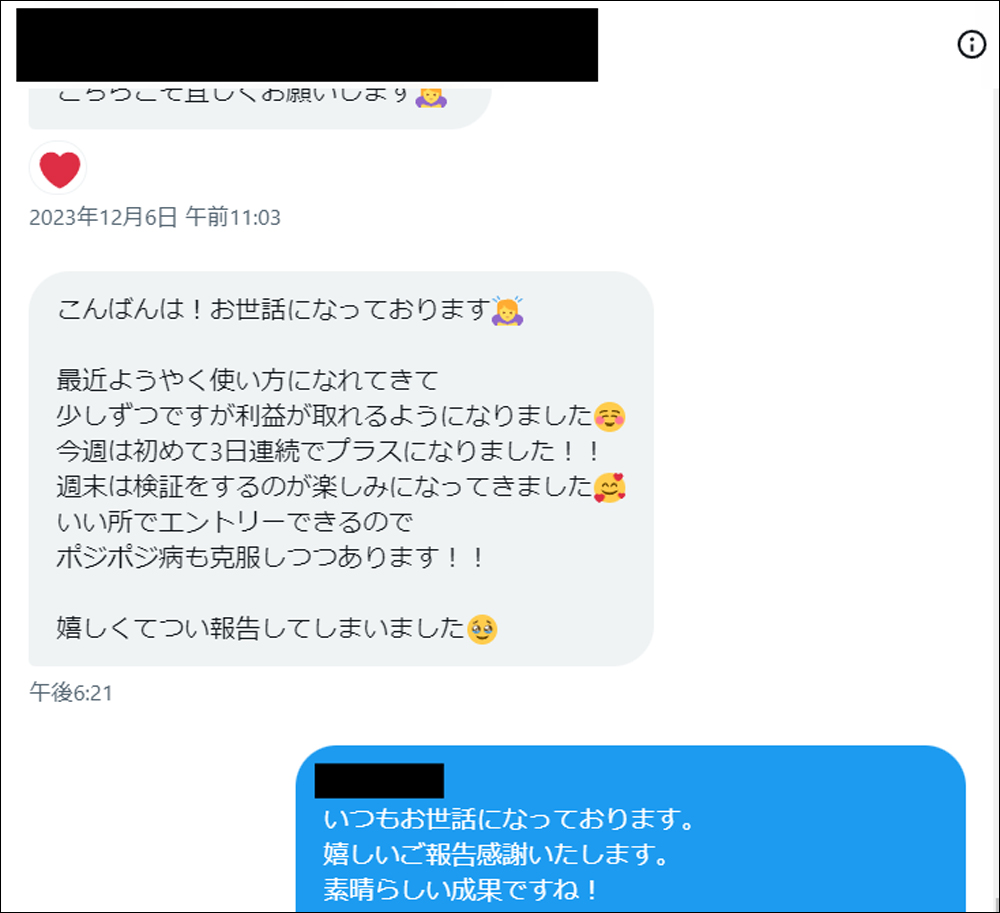
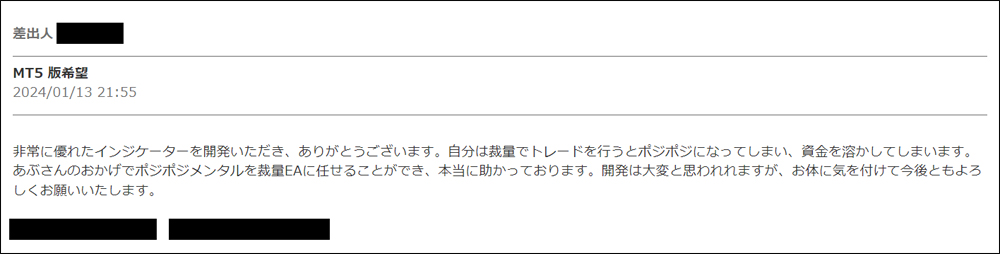
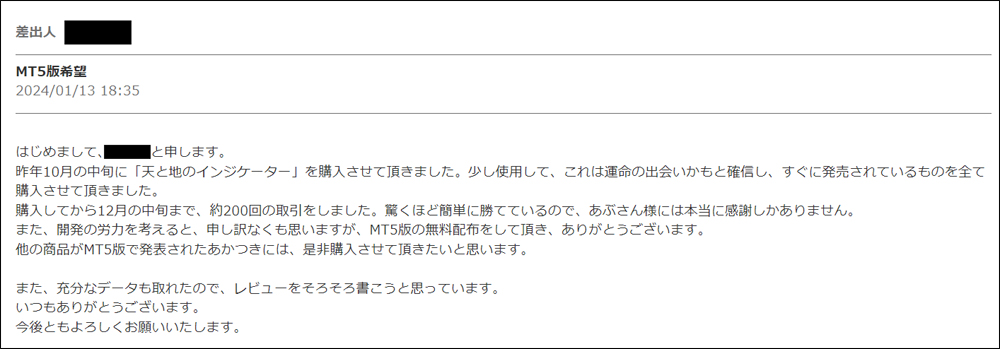
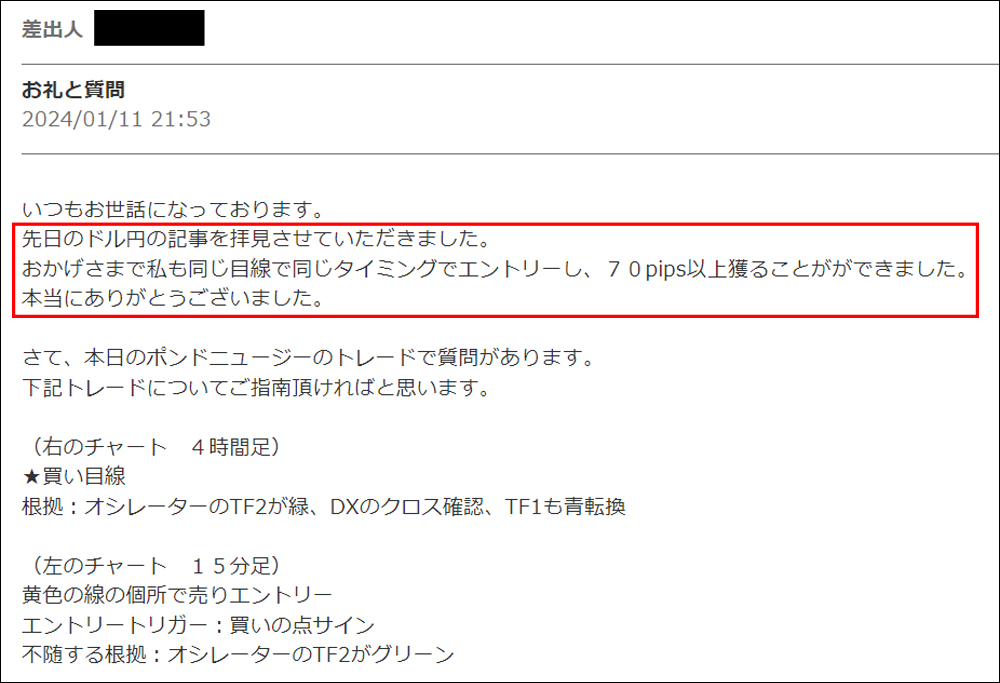
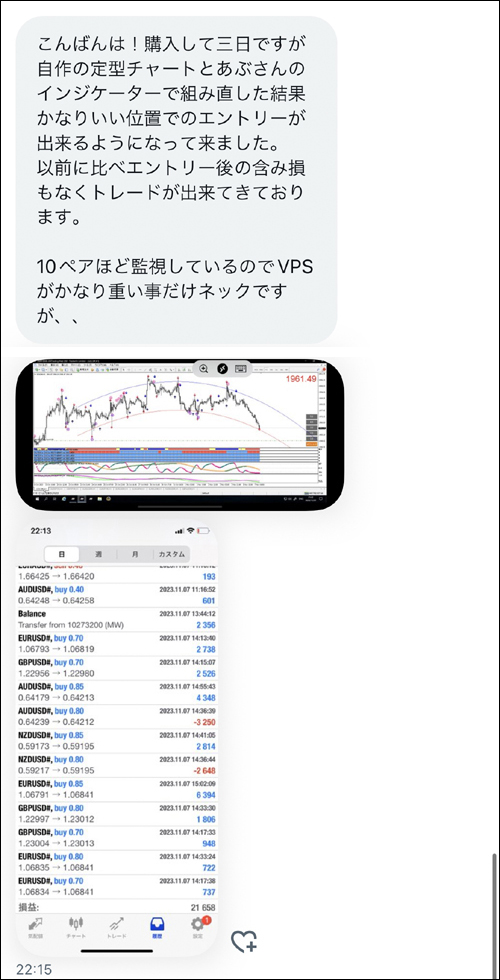
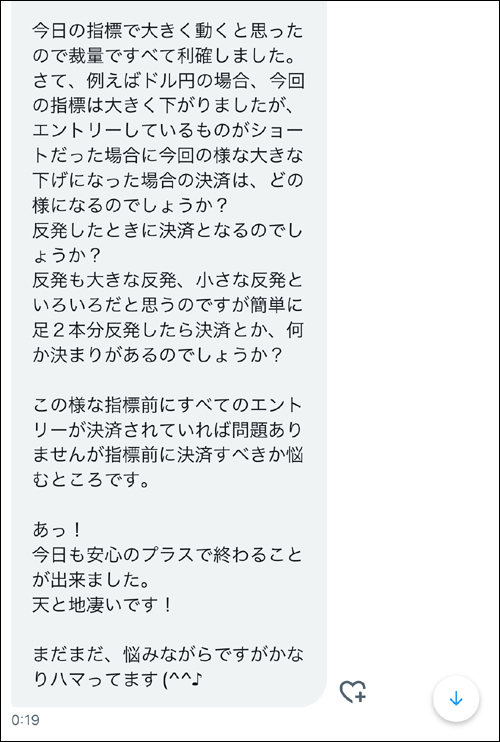
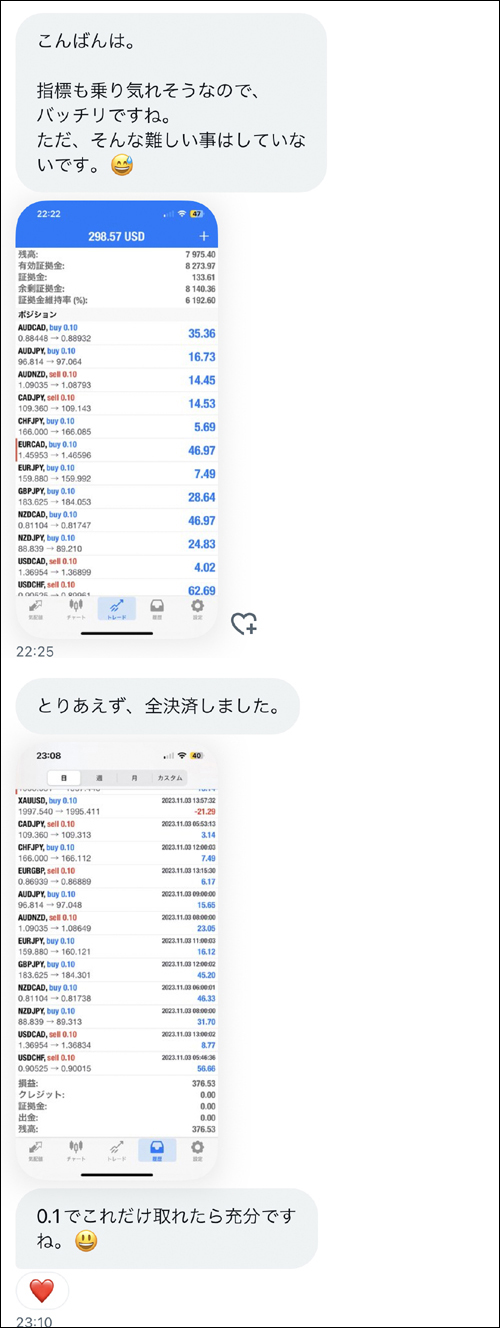
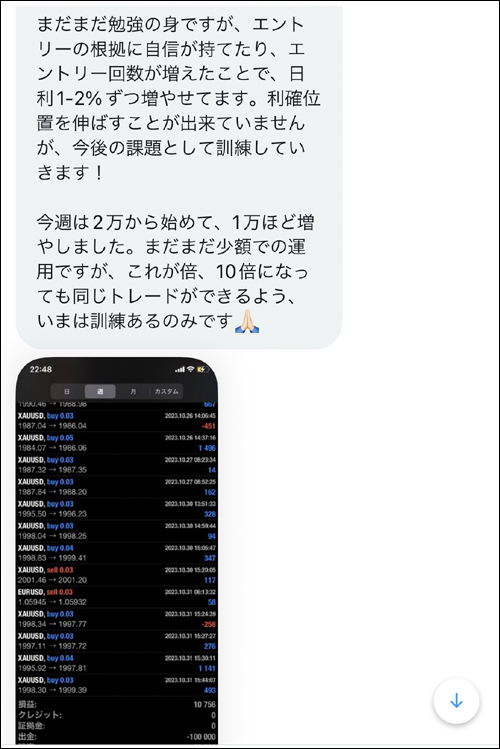
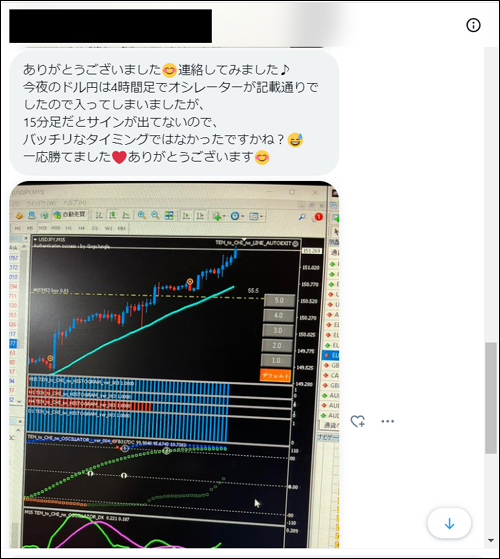
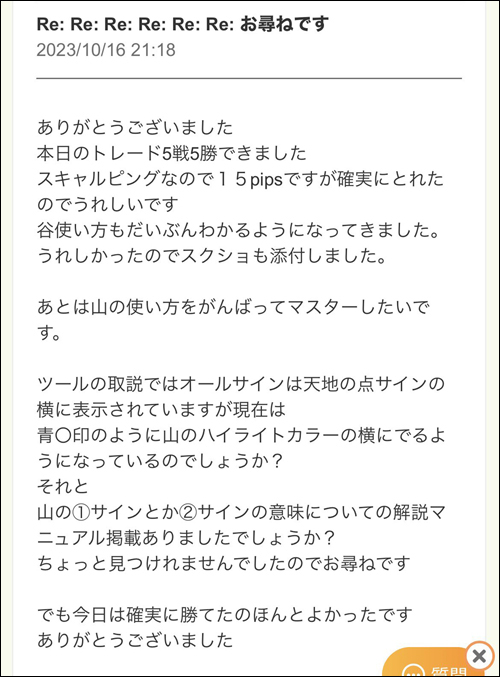
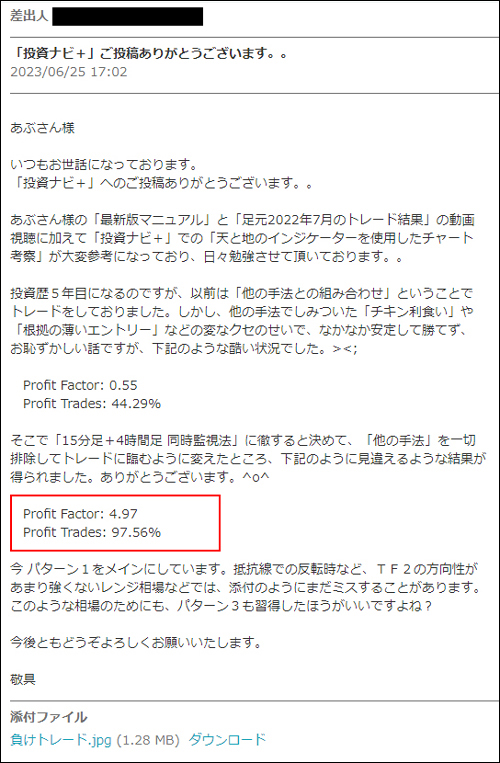
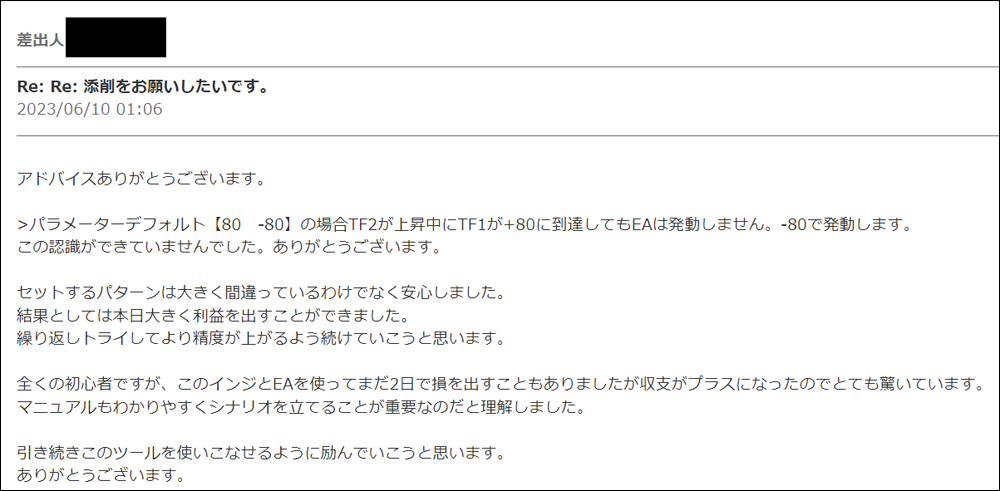
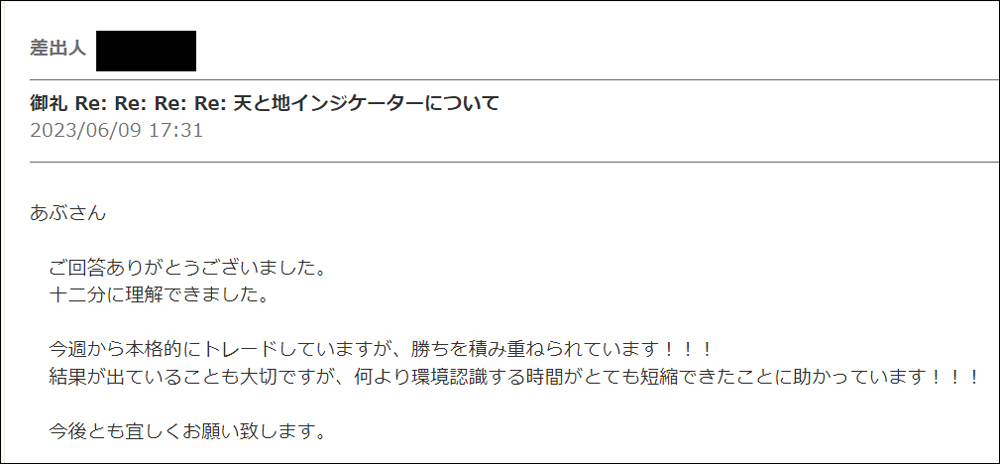
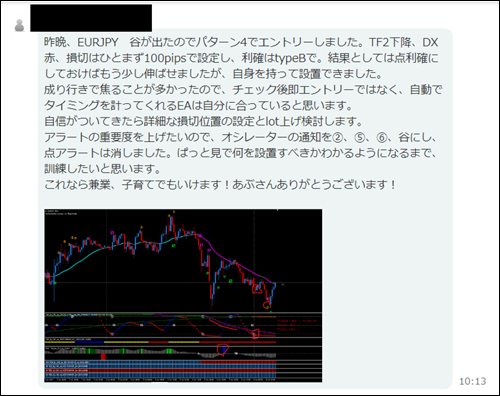


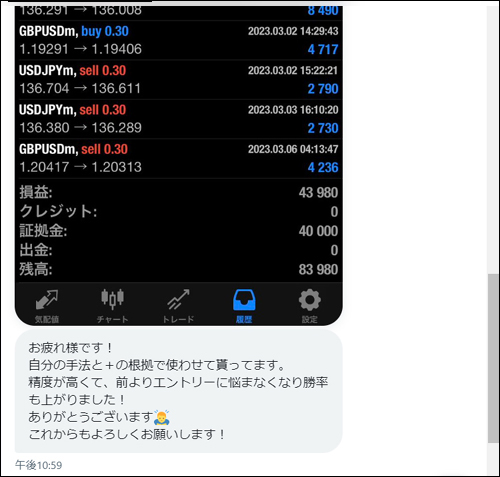
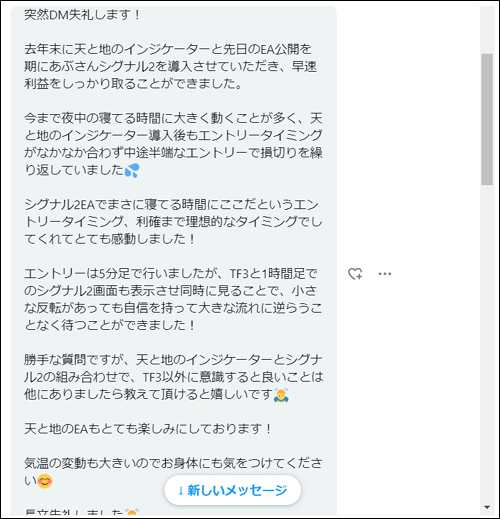
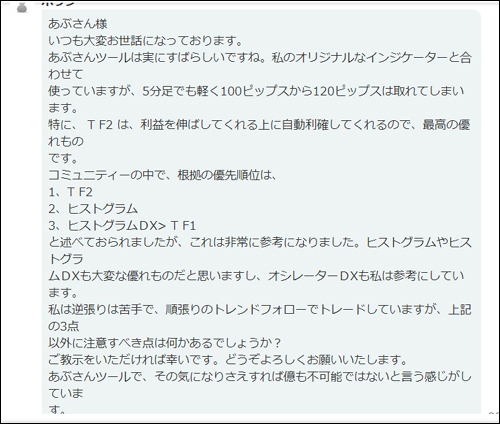
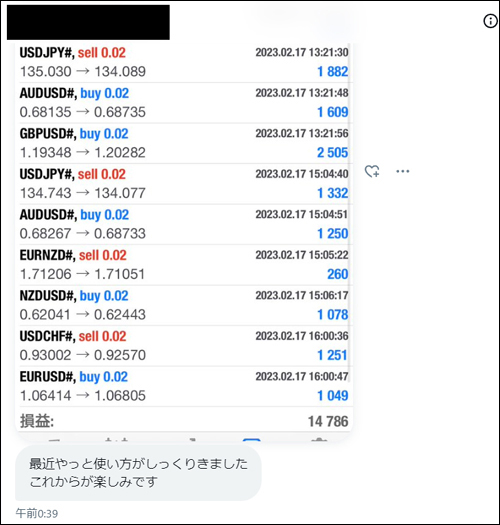
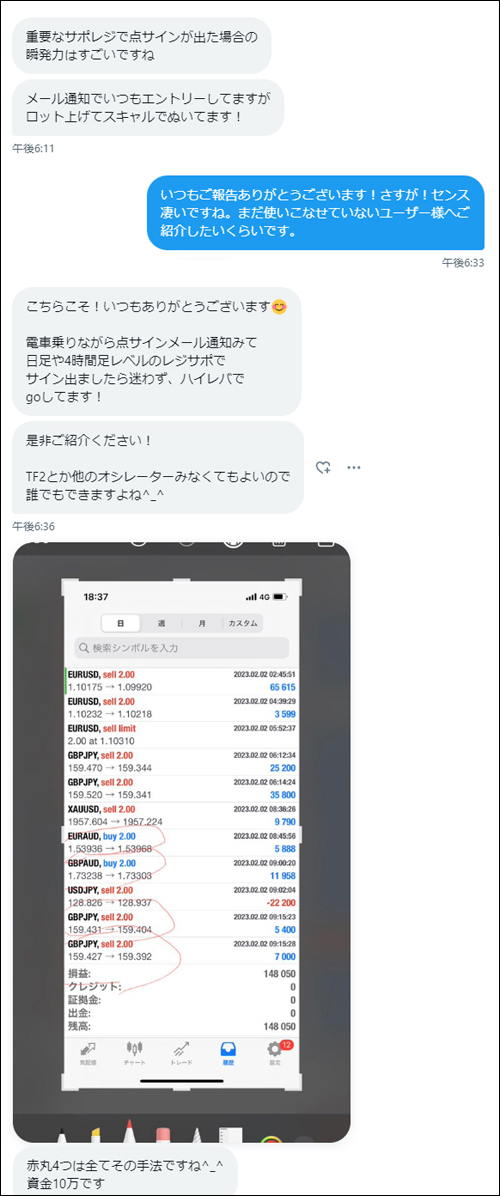
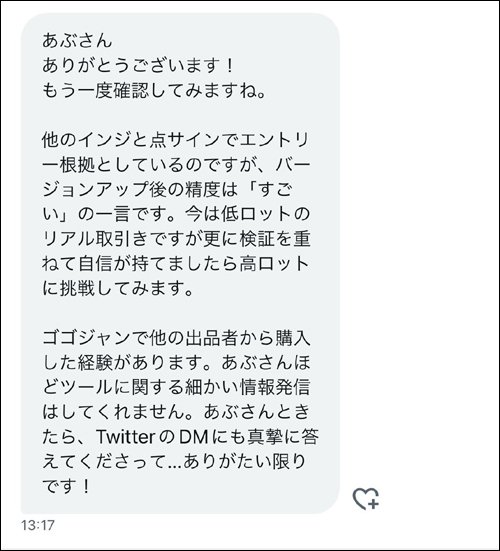
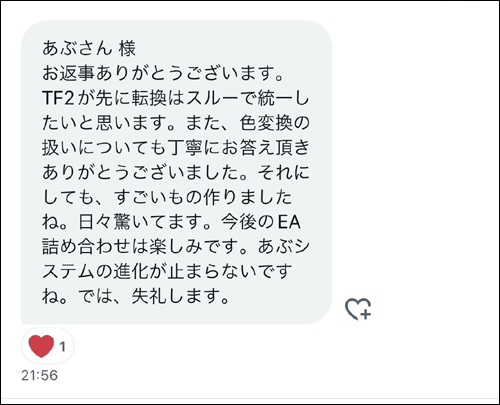
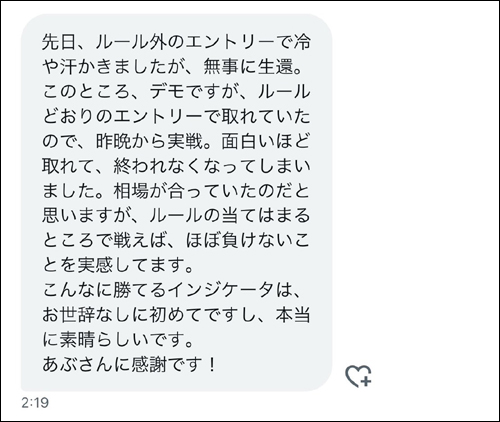
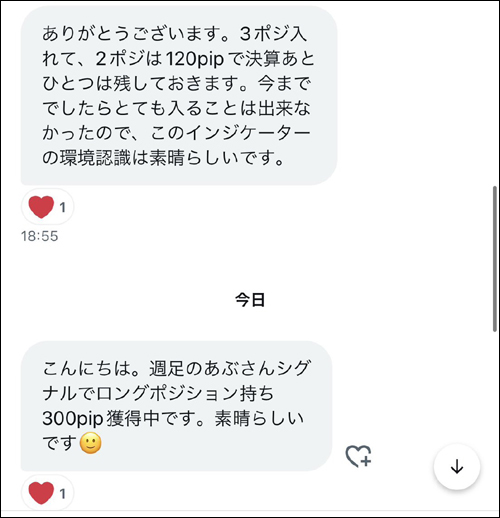
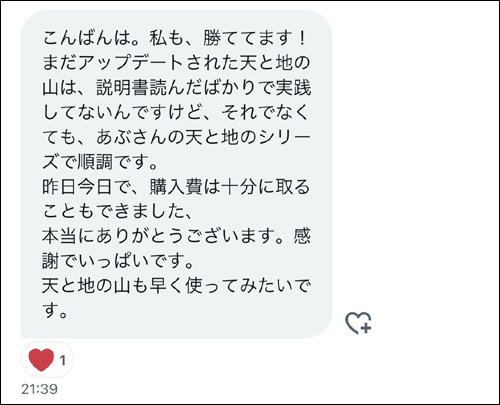
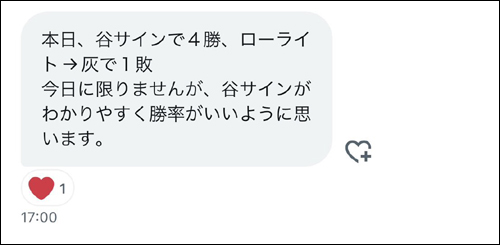
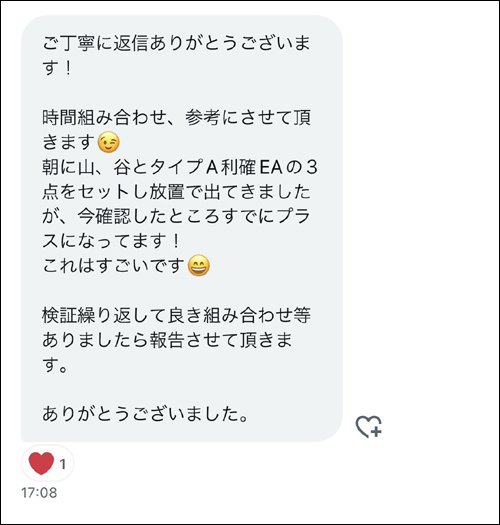
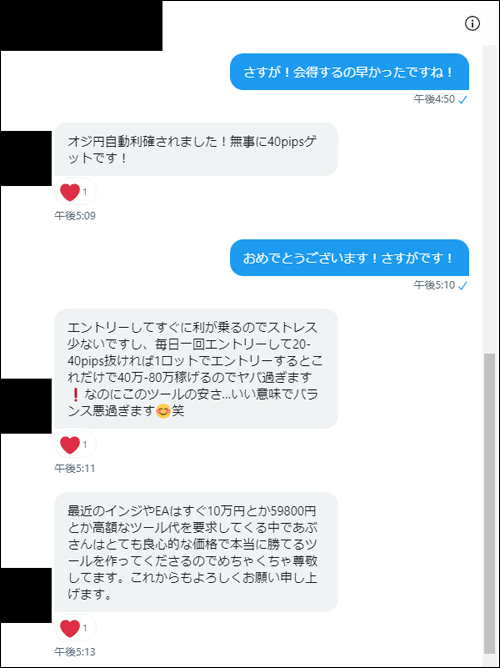
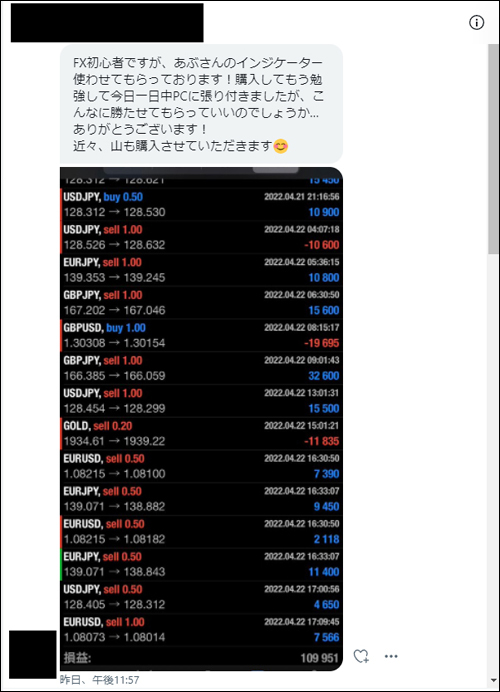
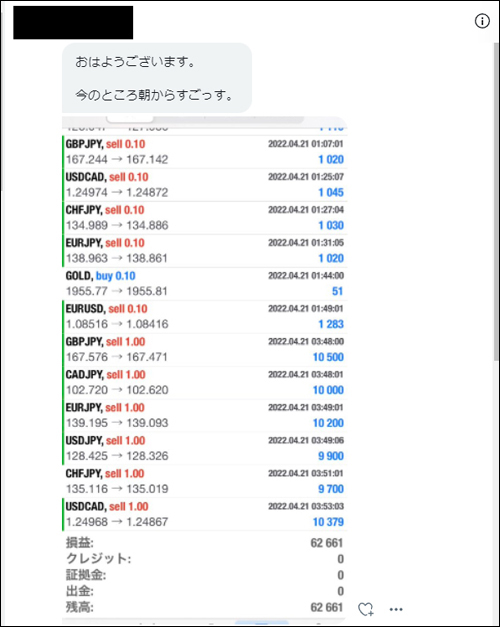
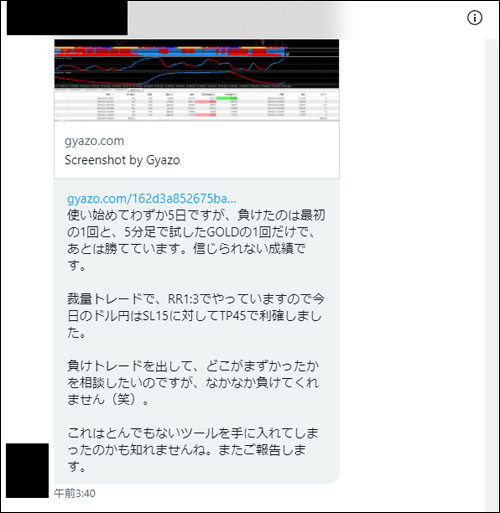
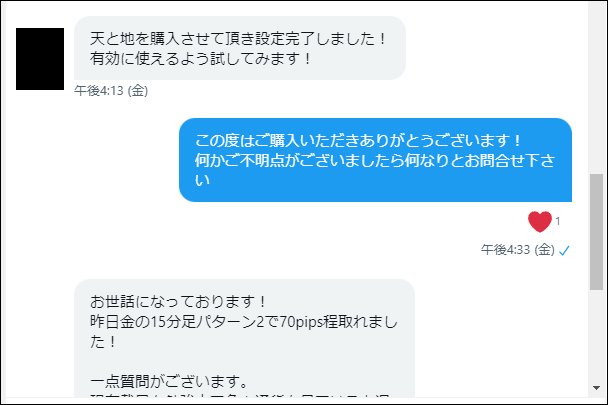
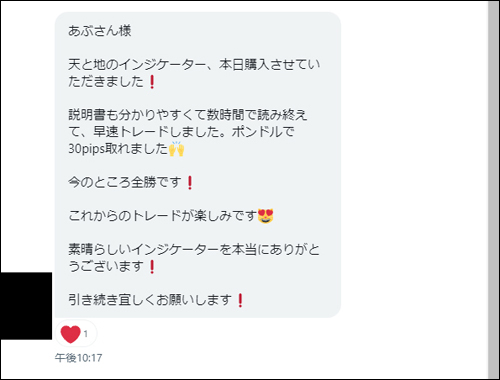
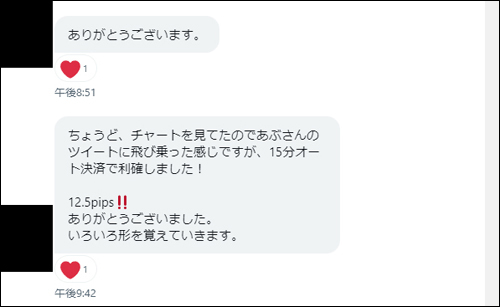
・In articles linked below, we introduce valuable DMs, reviews, posts, and other messages from users and monitor participants. We carefully select winning reports and other beneficial messages, so I’m sure they will be helpful to everyone. We update them periodically, so please take a look when you have time.
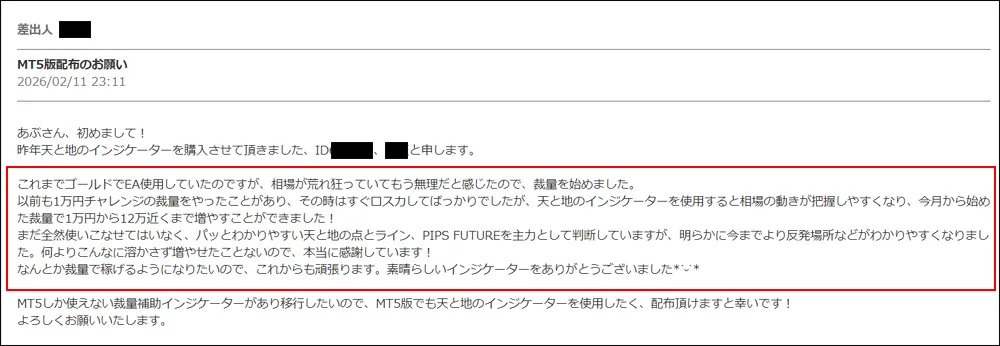
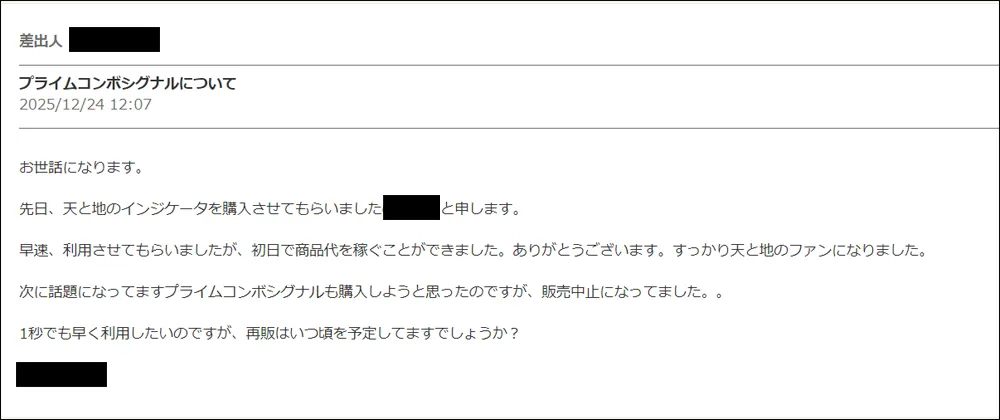
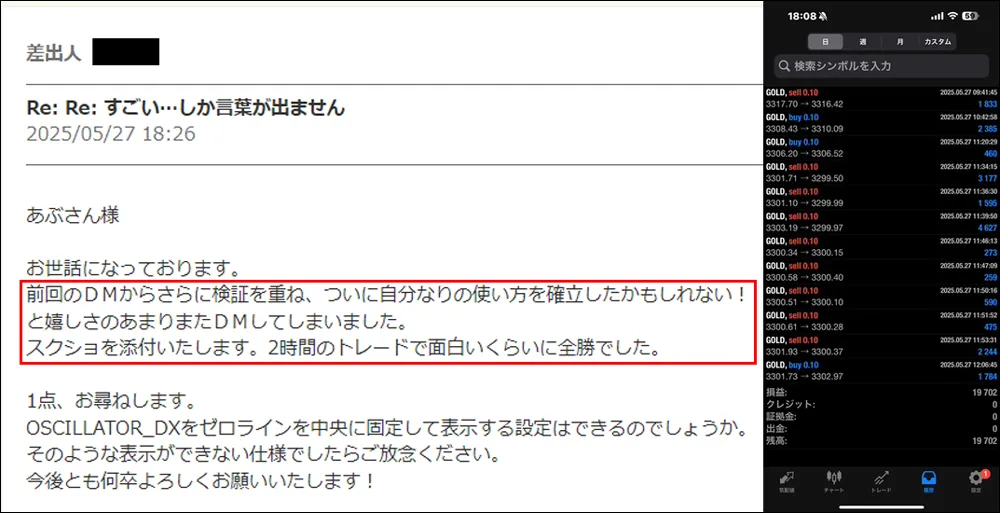
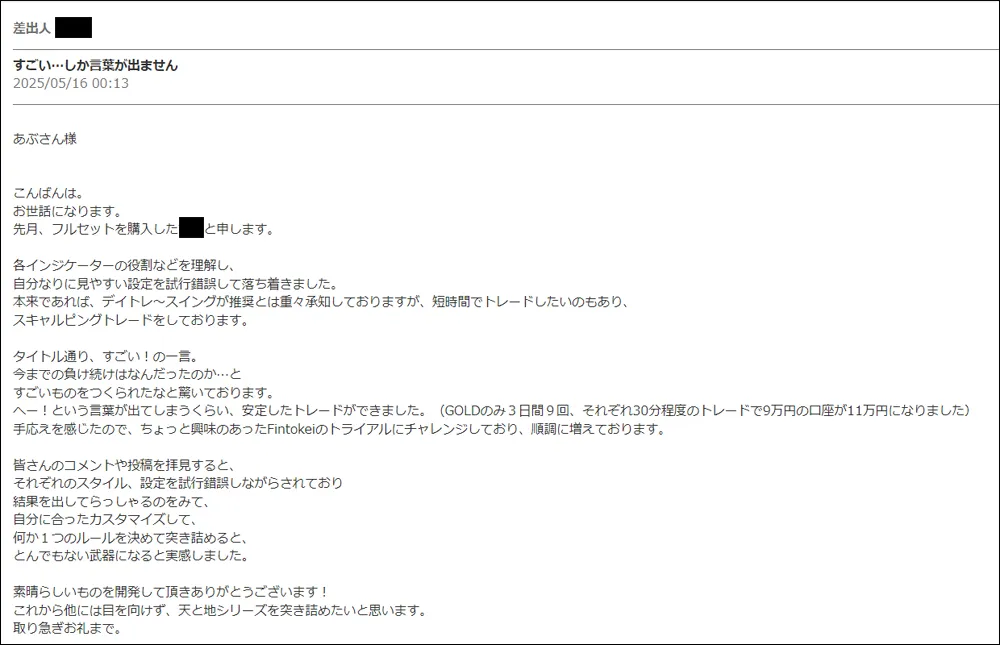
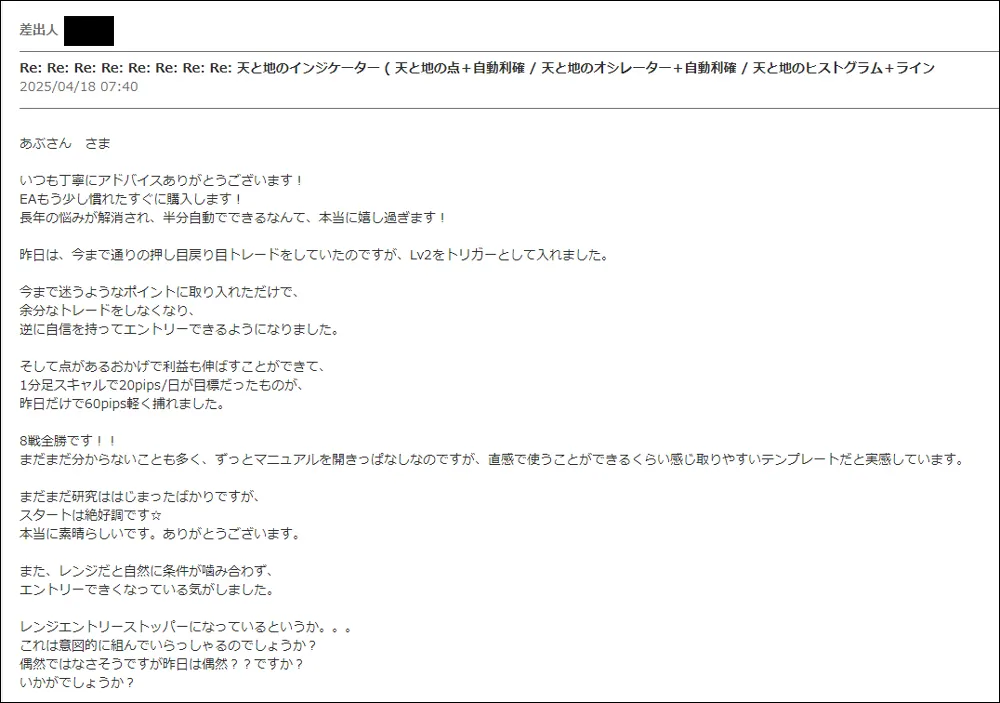
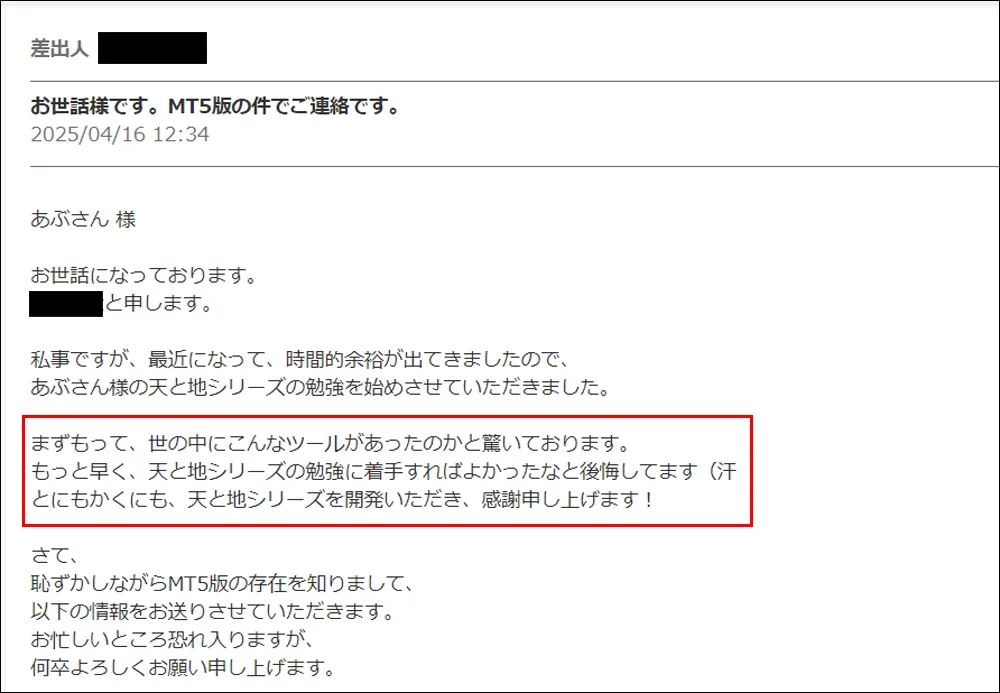
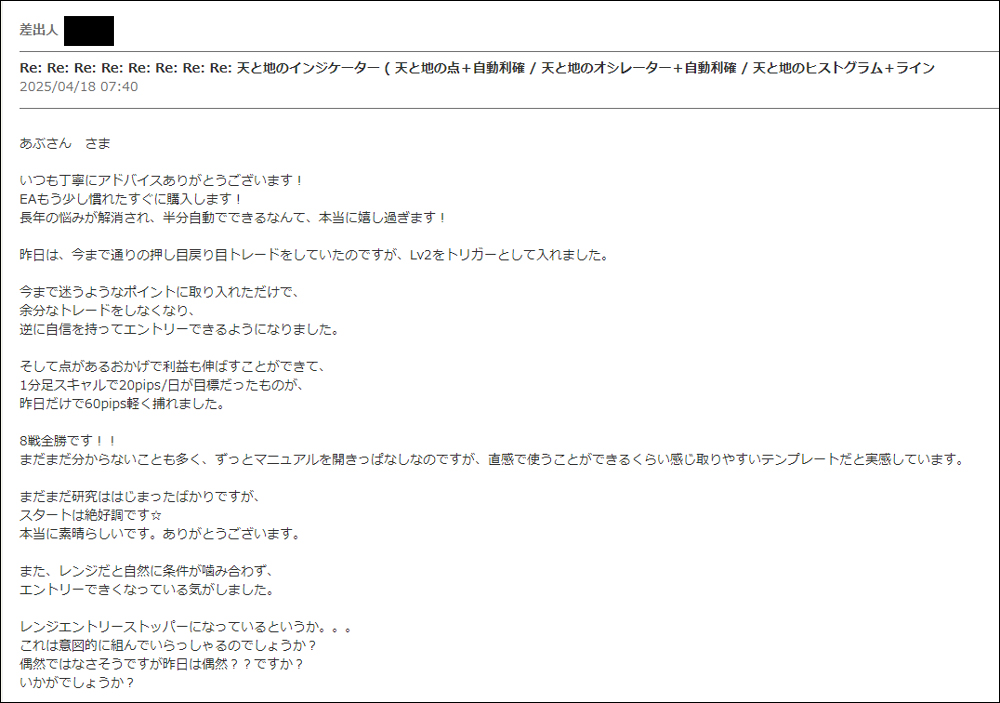
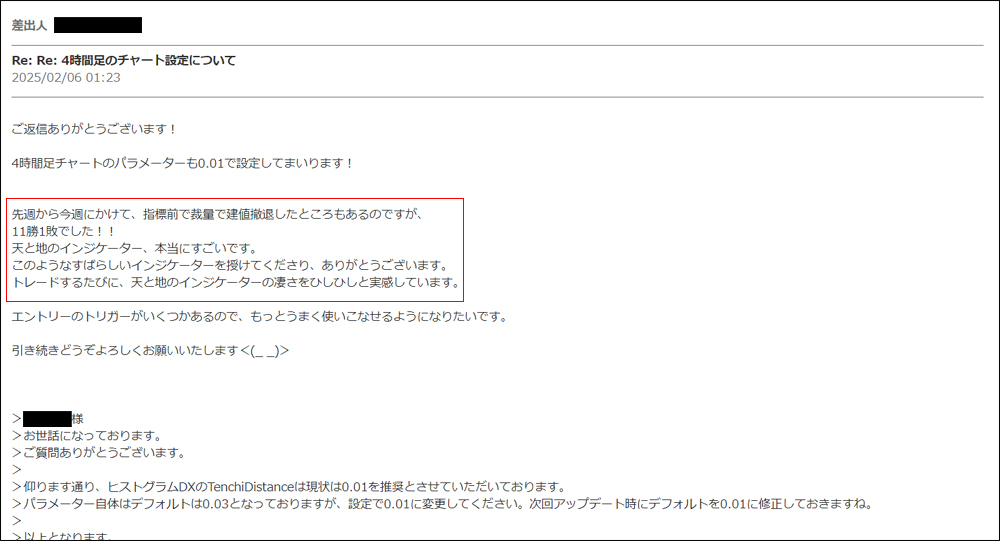
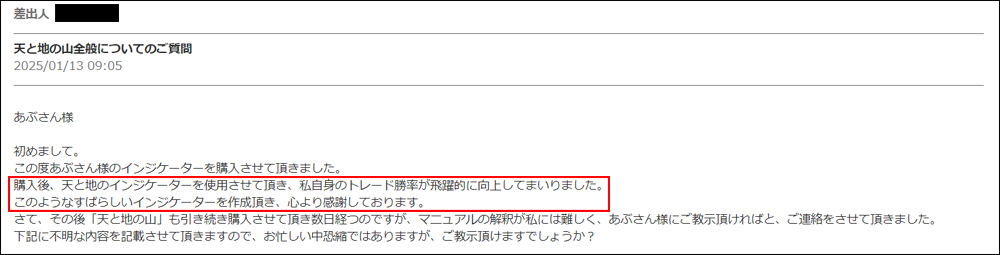
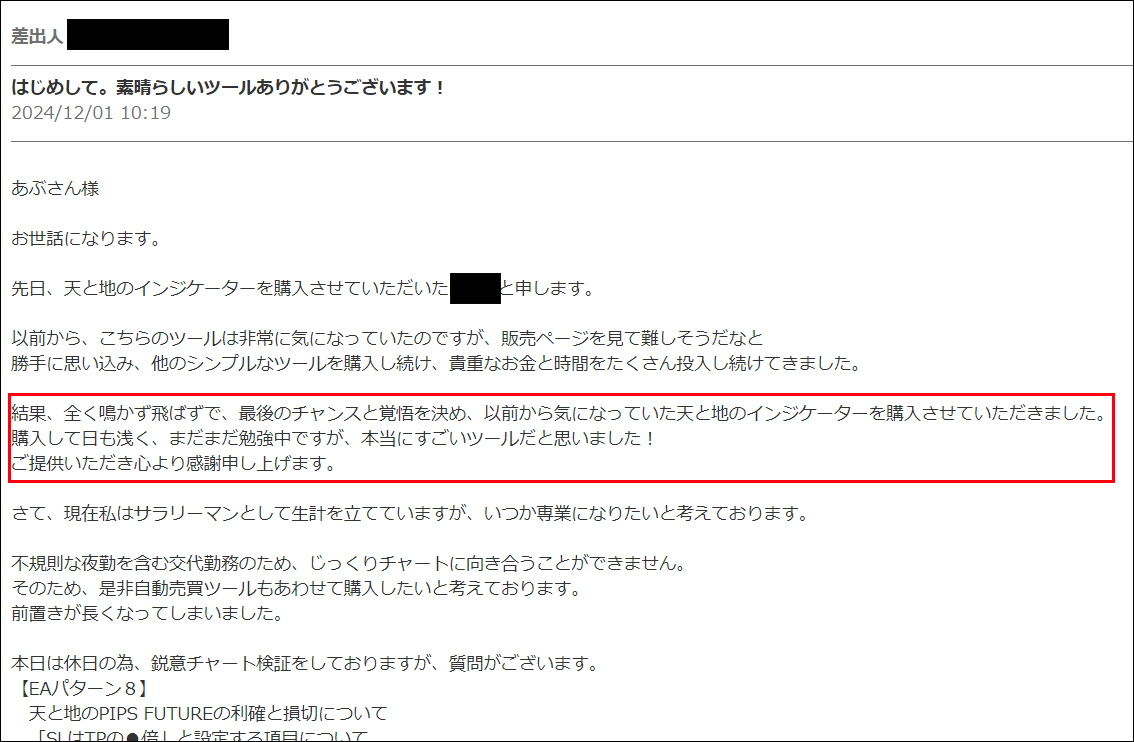
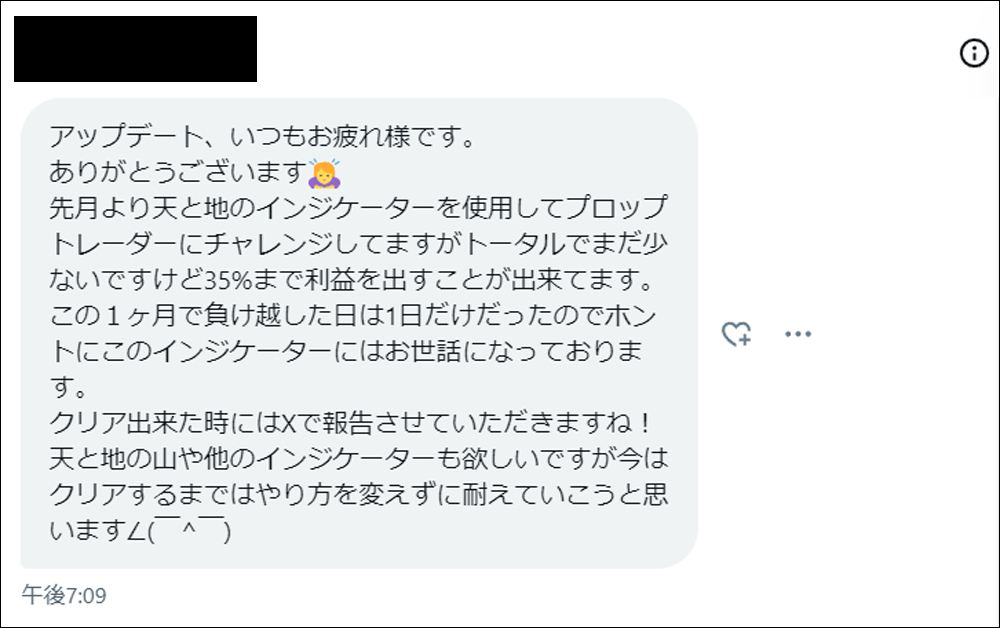
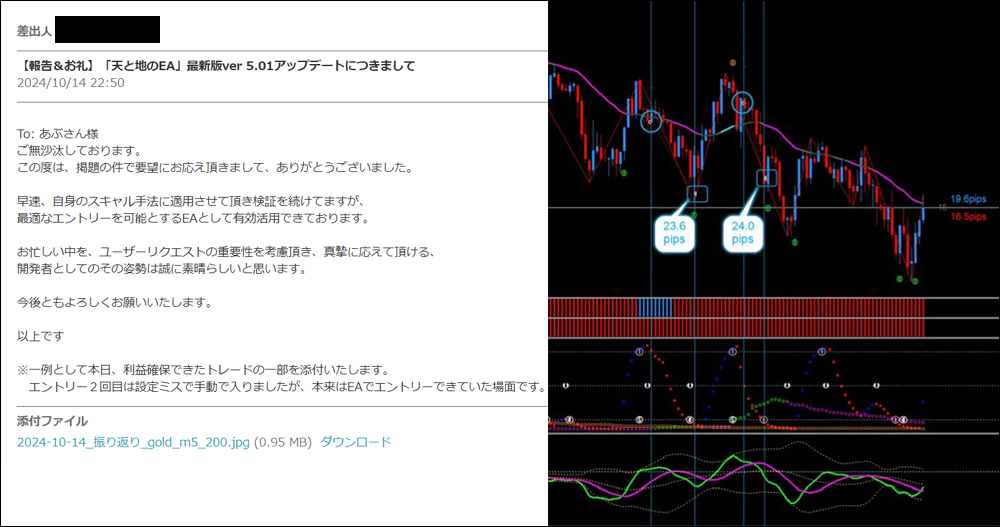
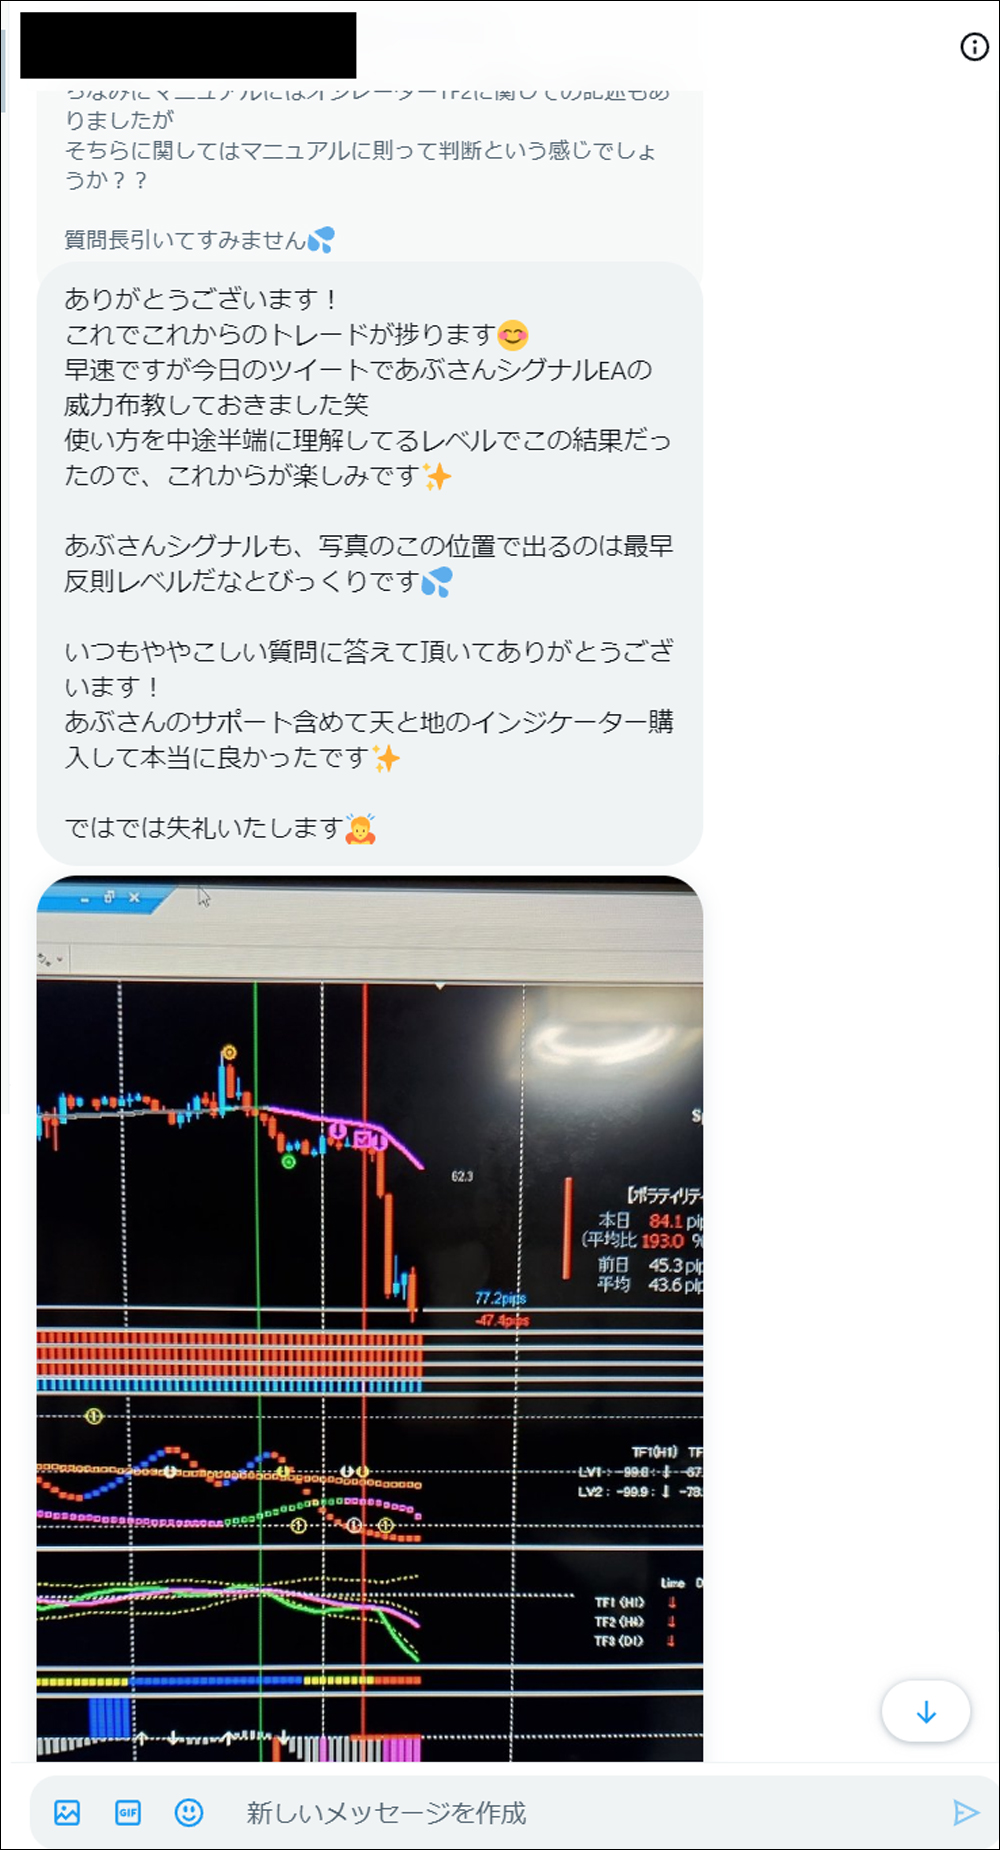
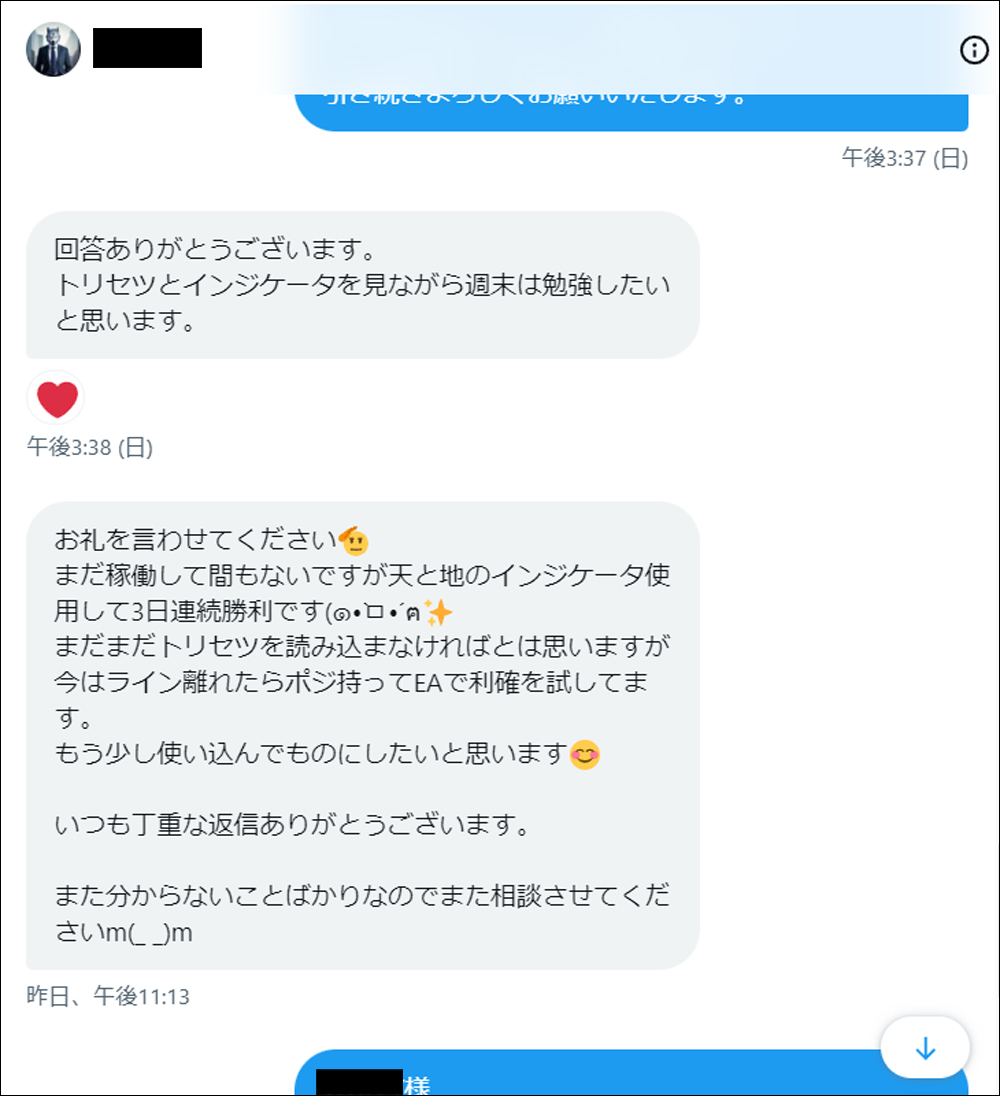
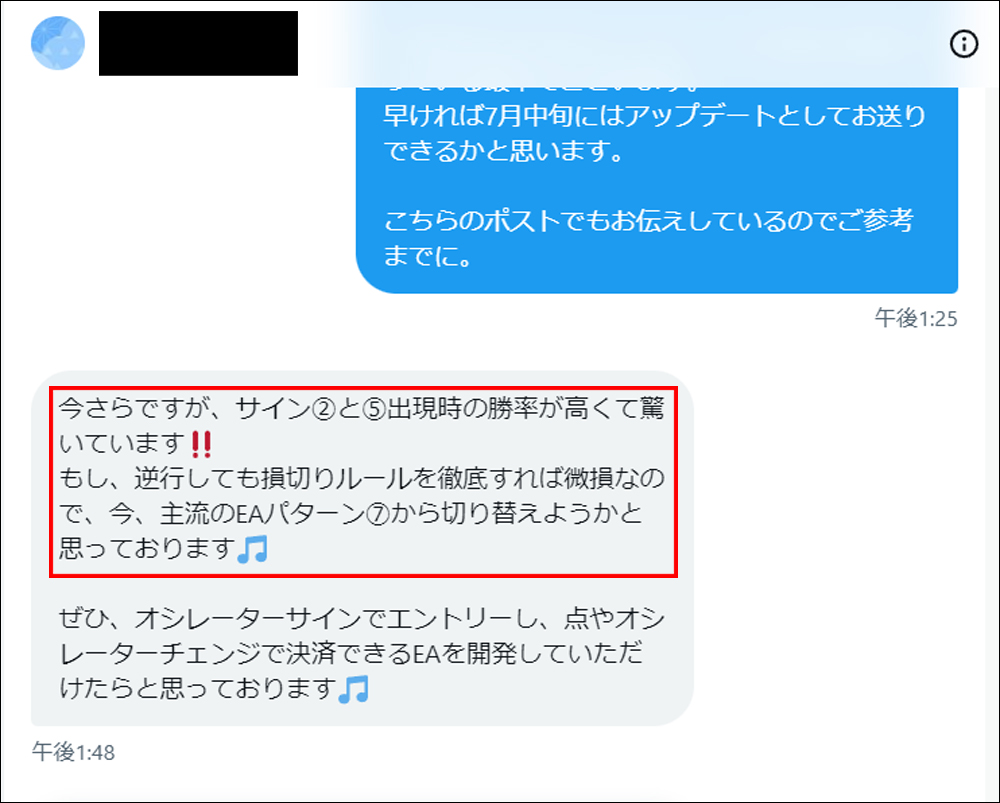
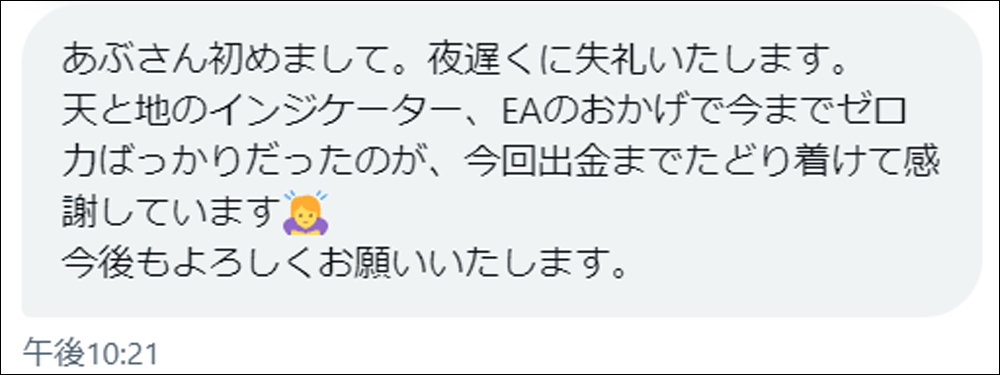
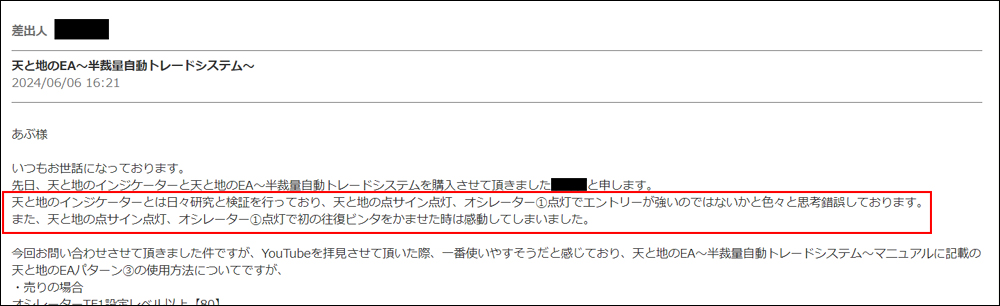
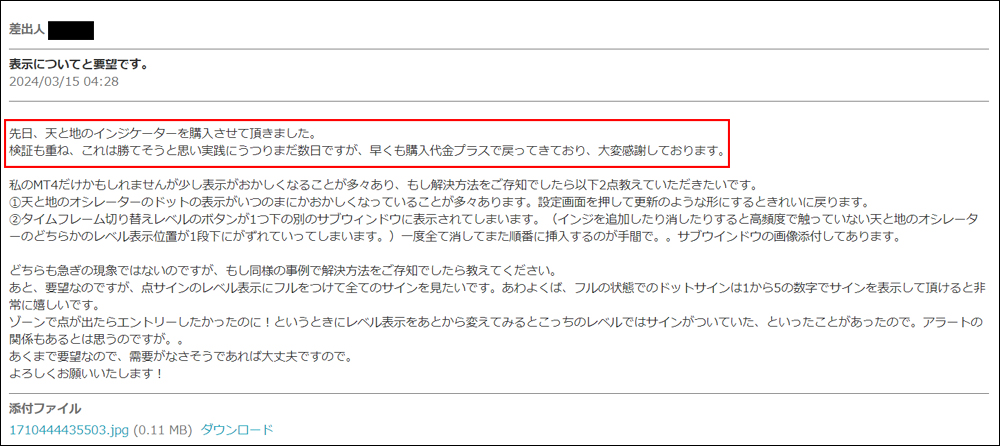
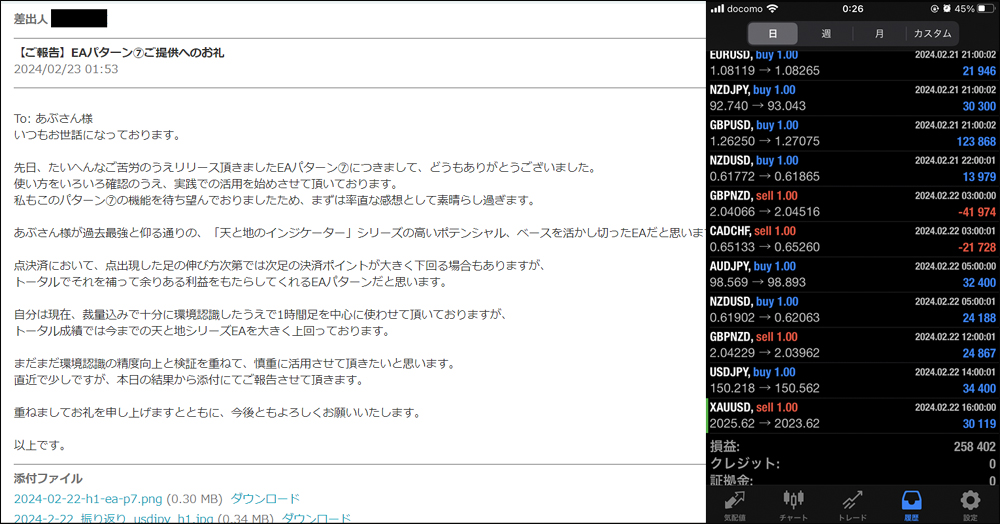
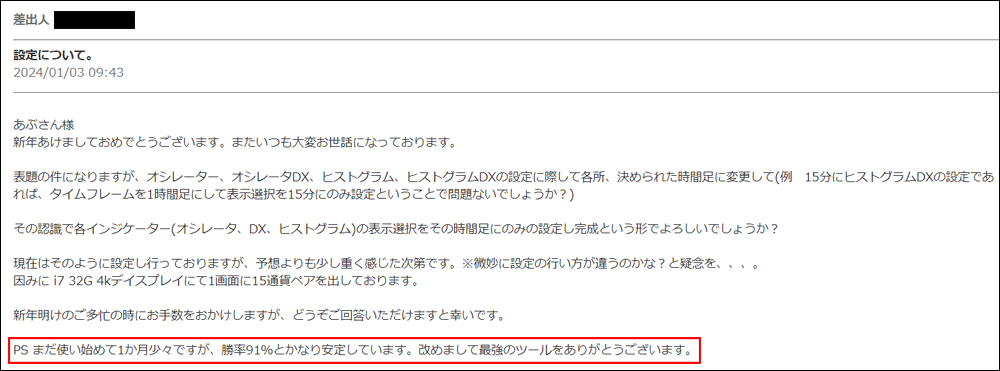
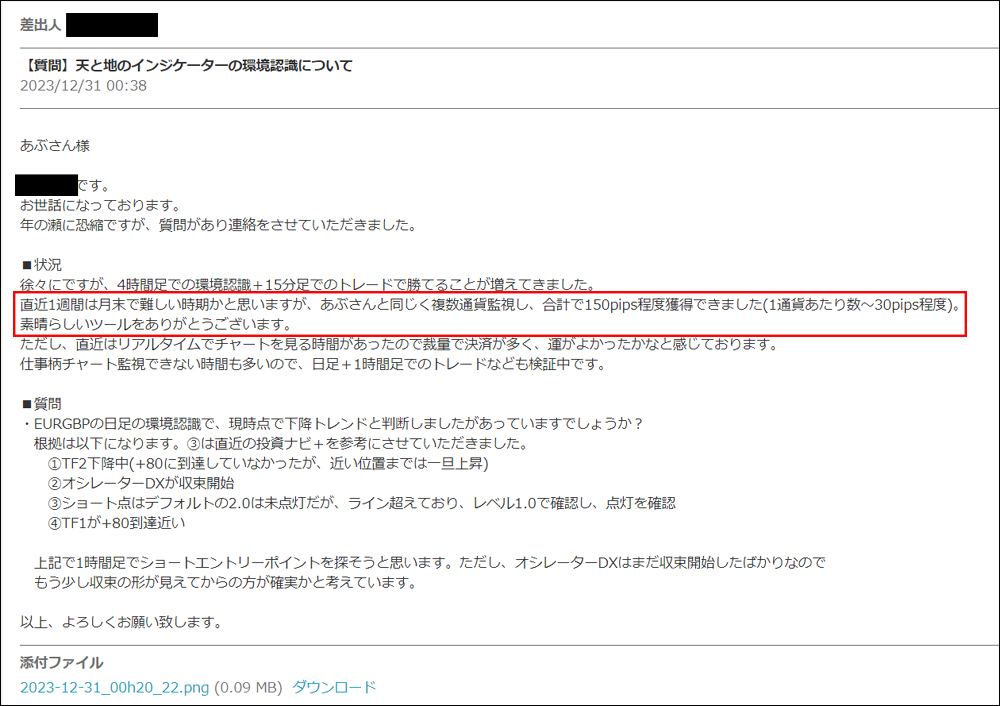
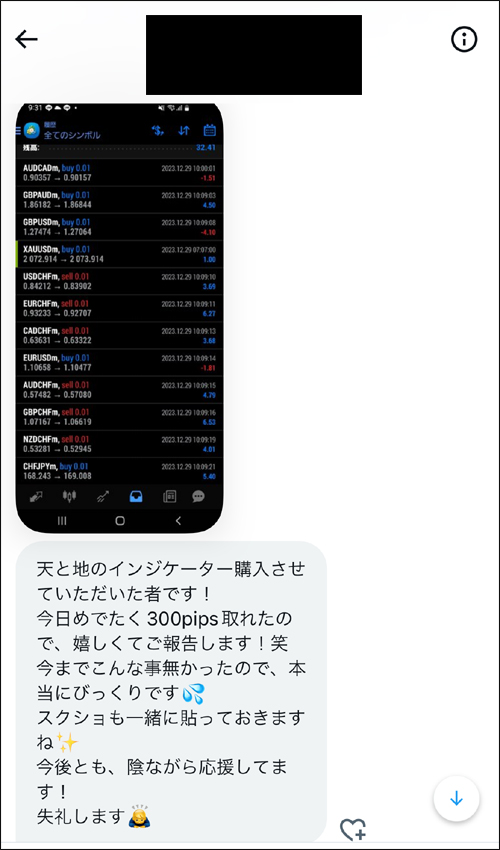
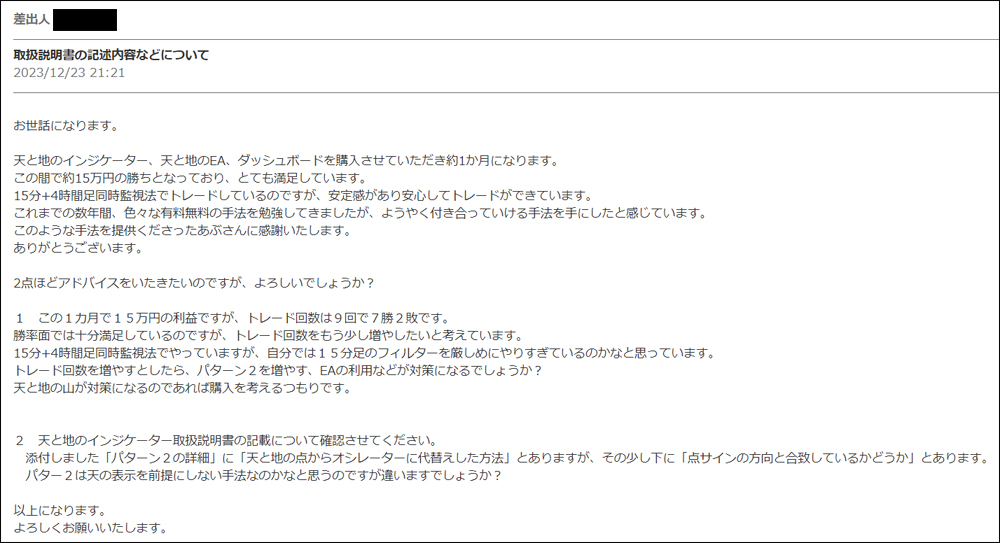
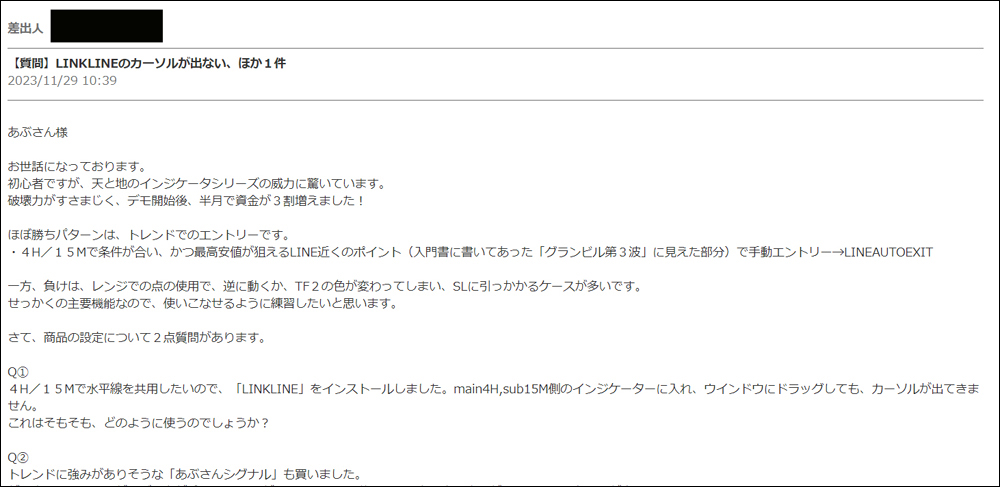
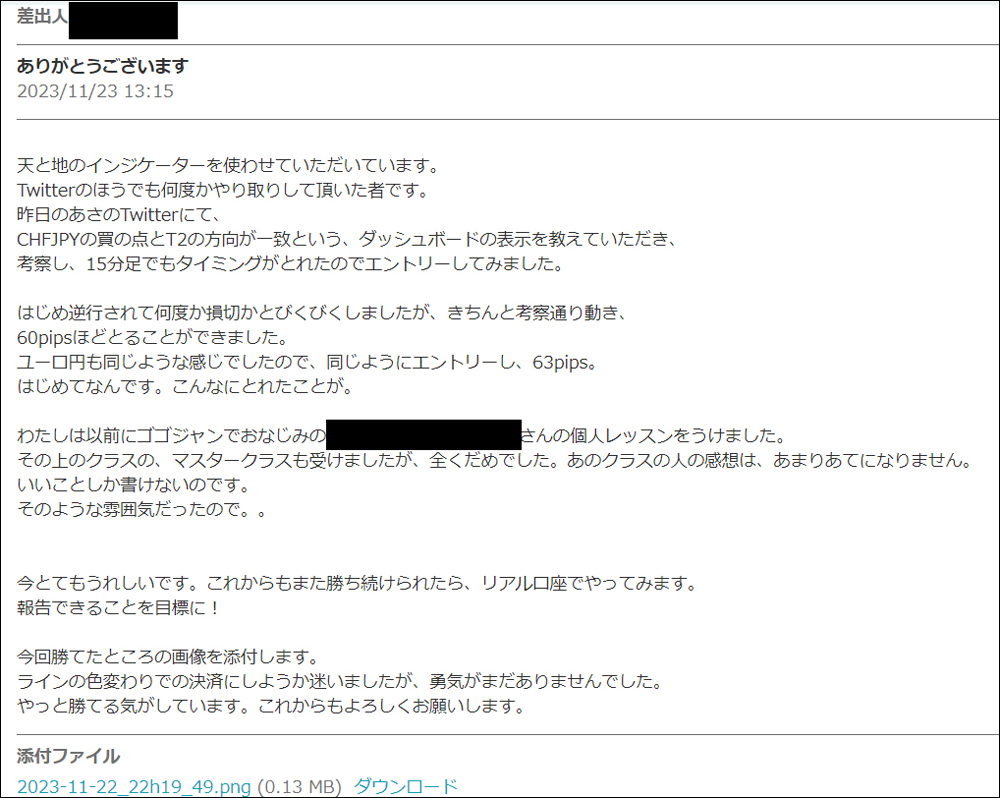
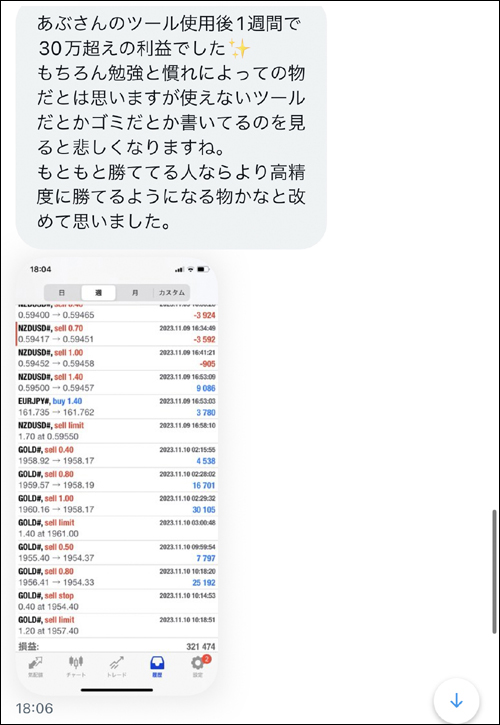
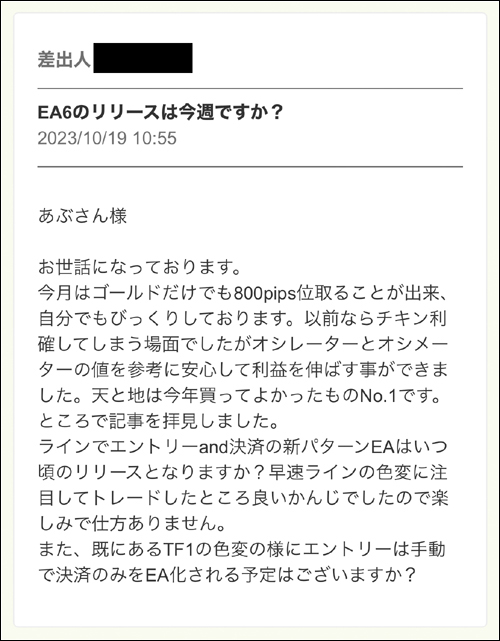
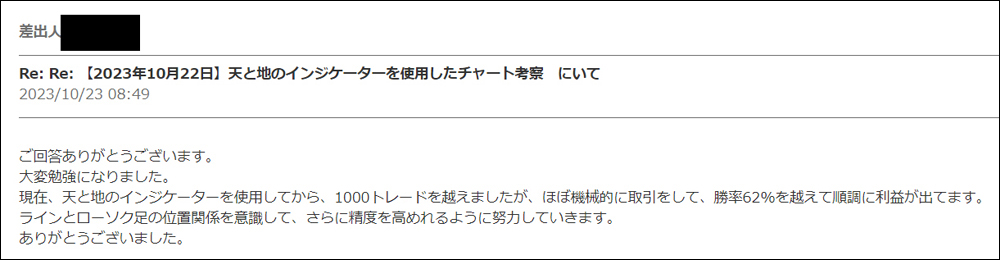
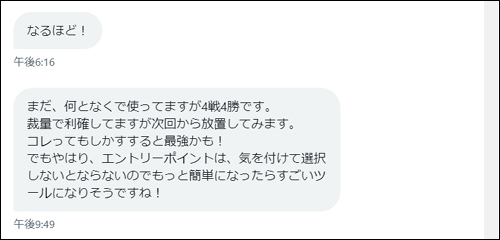
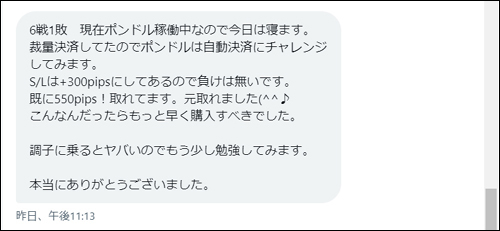
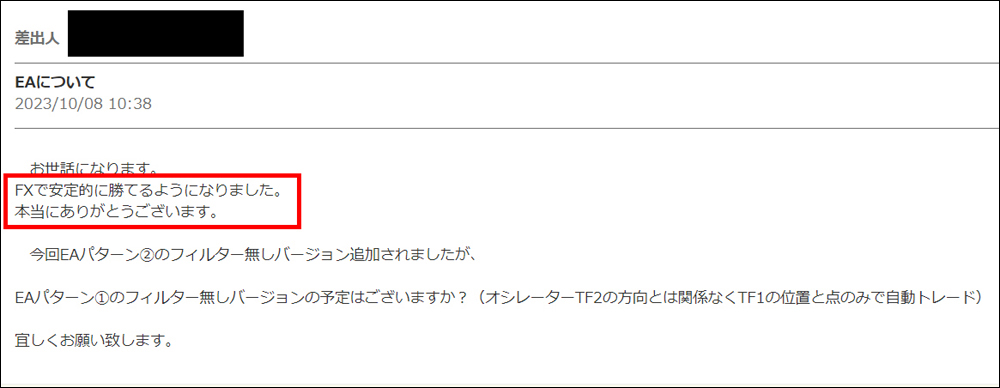
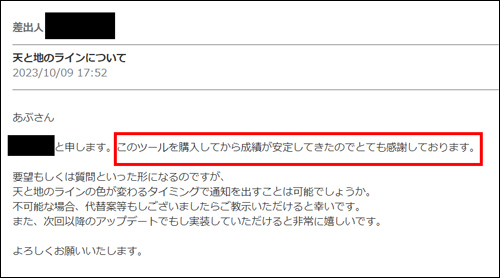
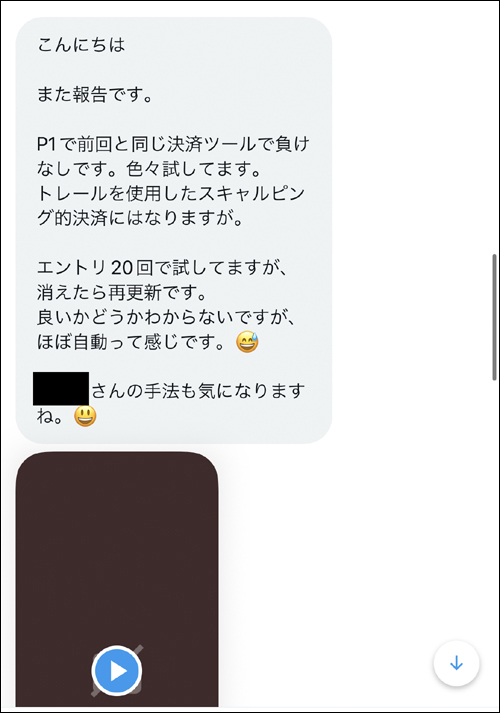
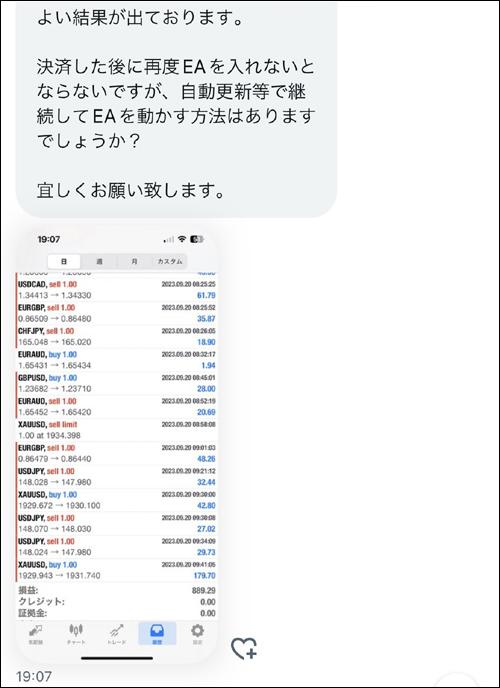
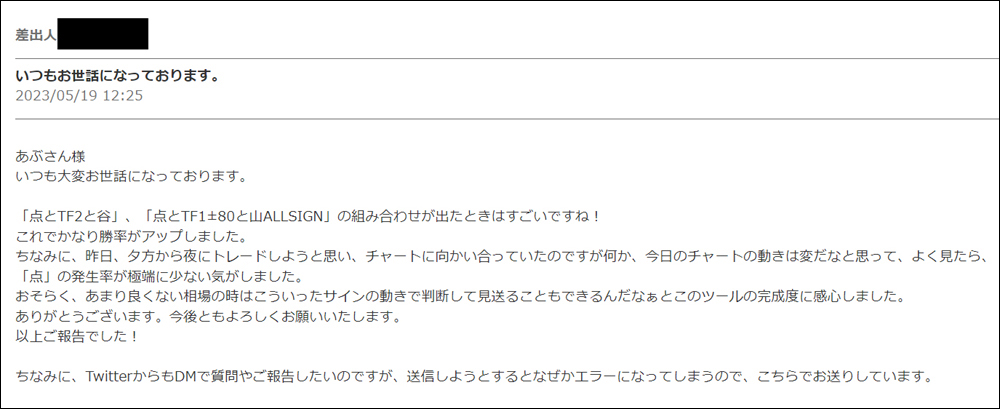
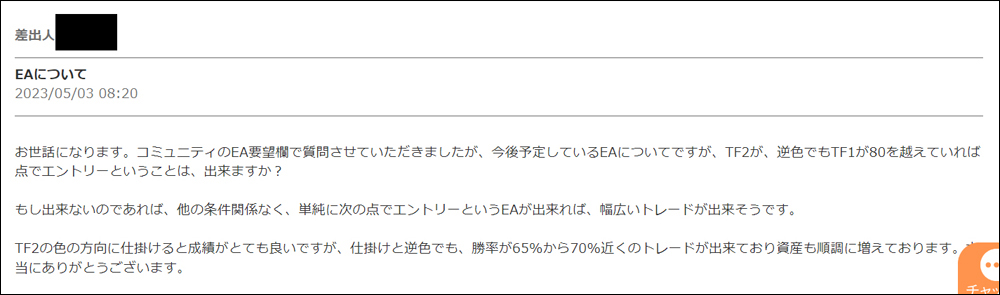
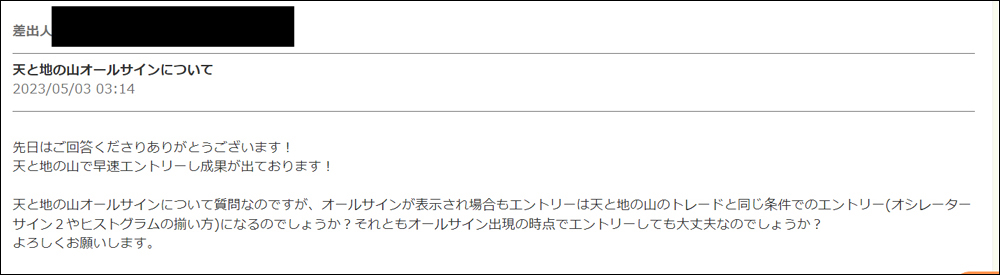
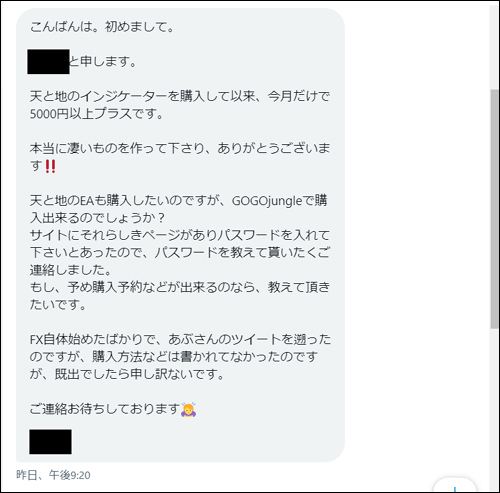
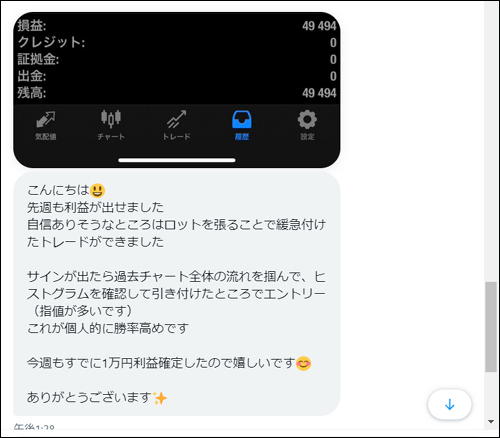
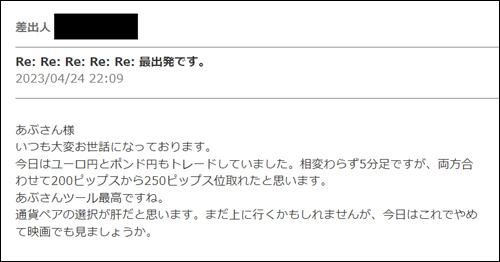
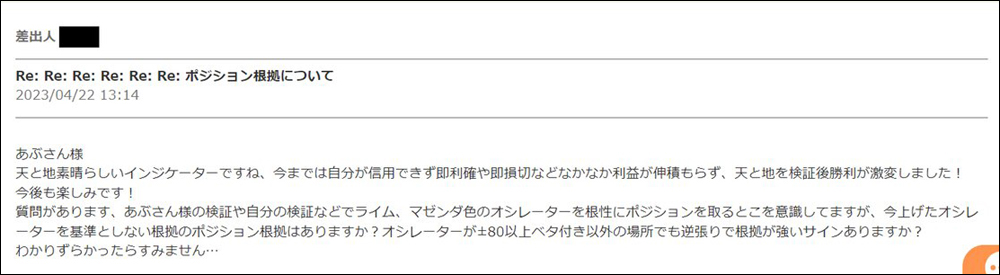
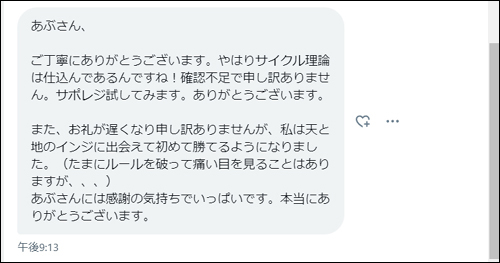
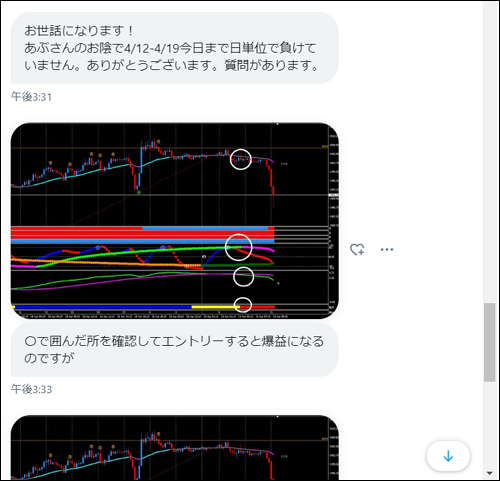
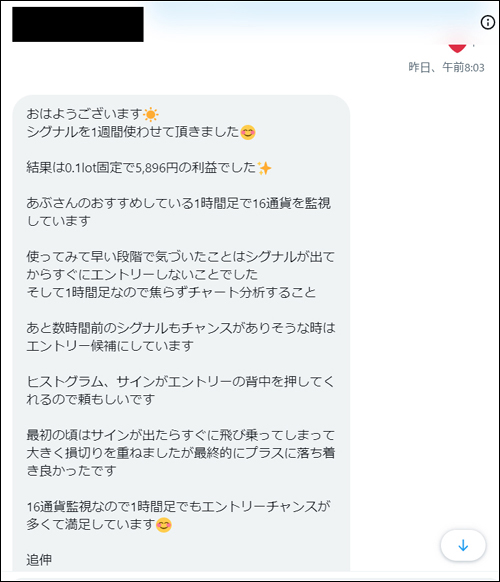
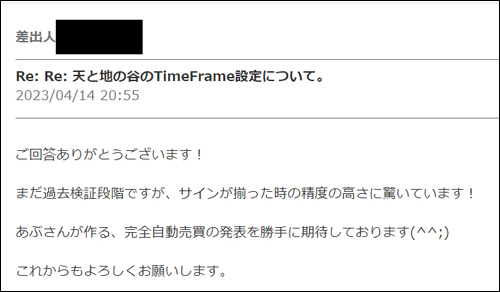
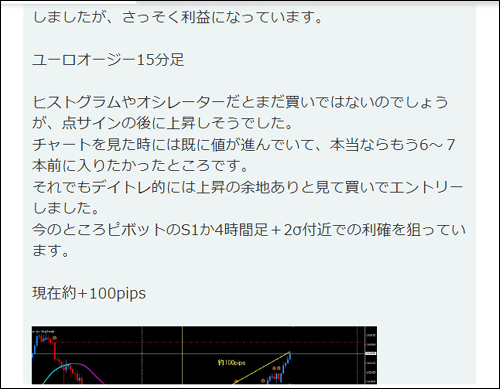
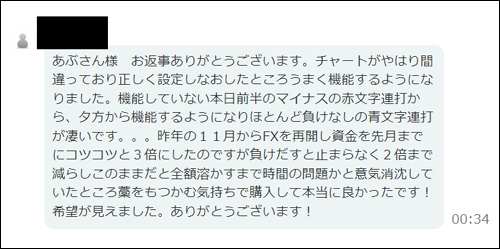
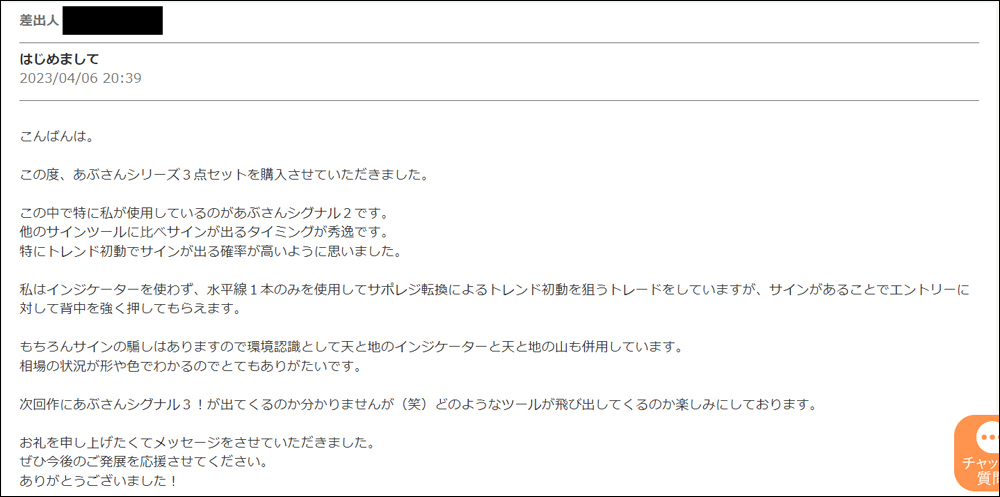
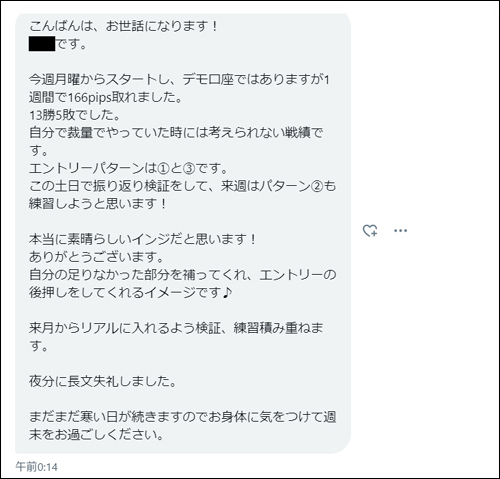
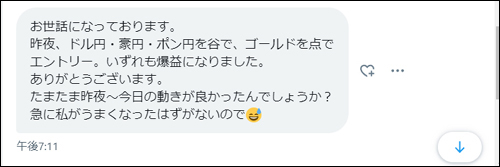
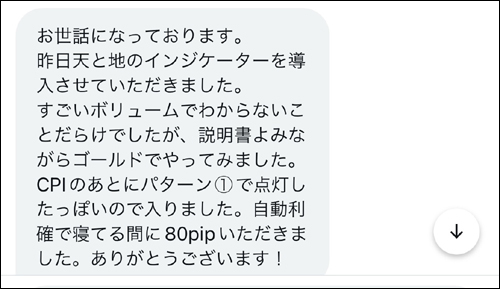
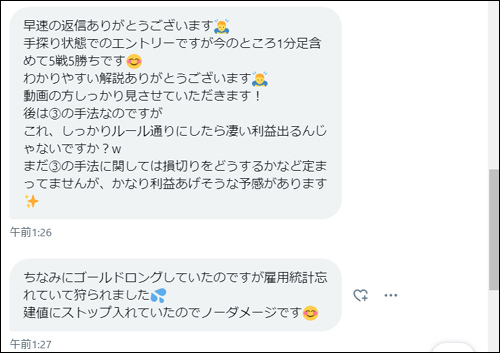
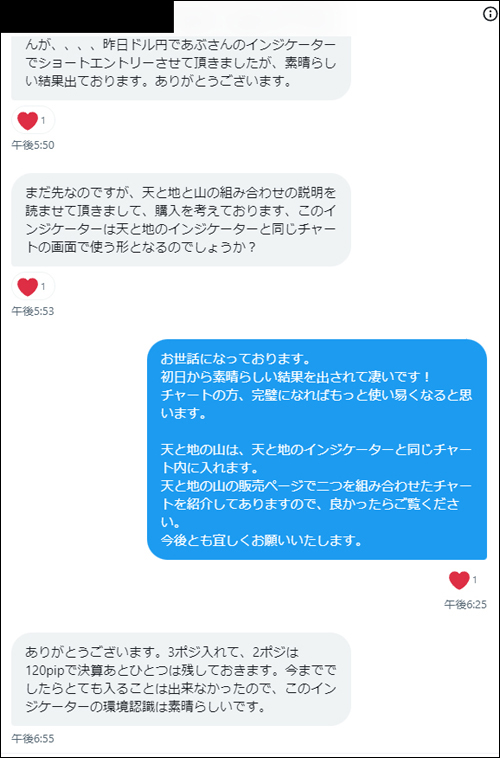
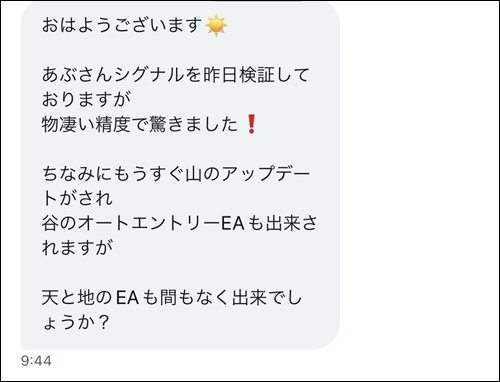
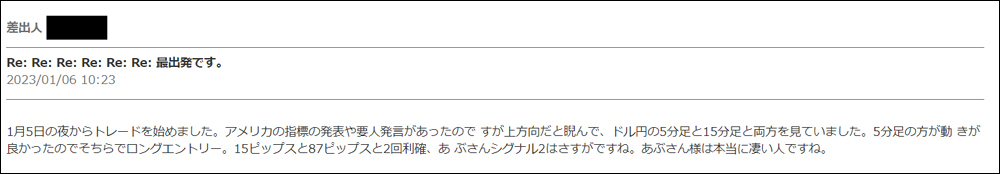
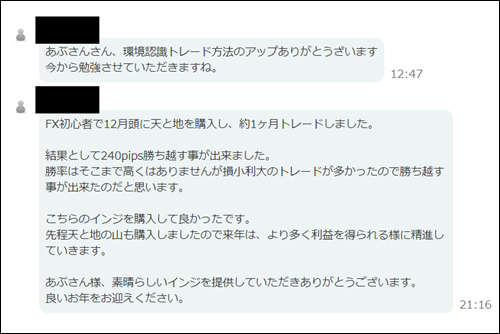
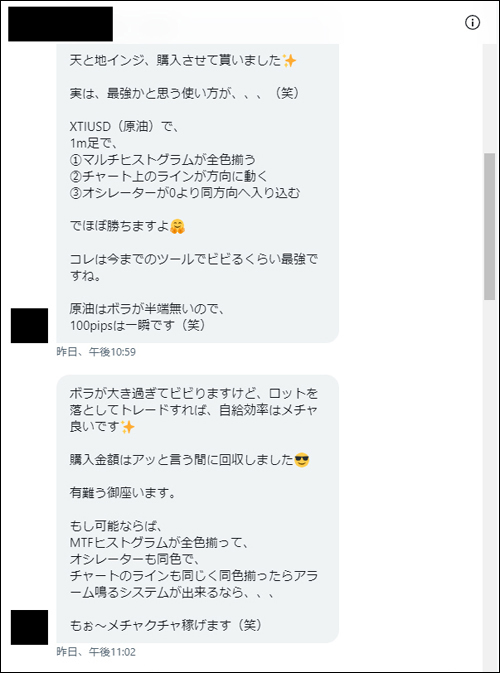
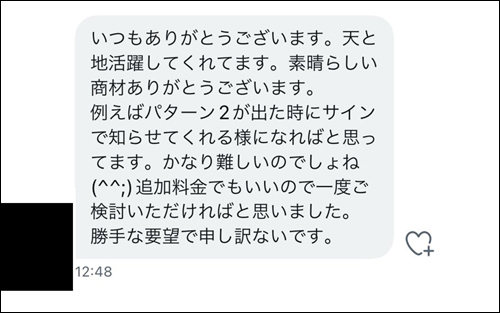
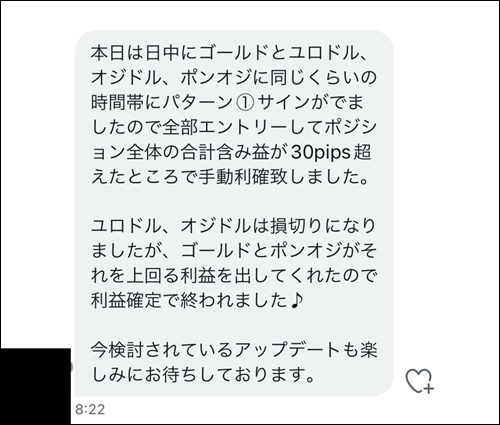
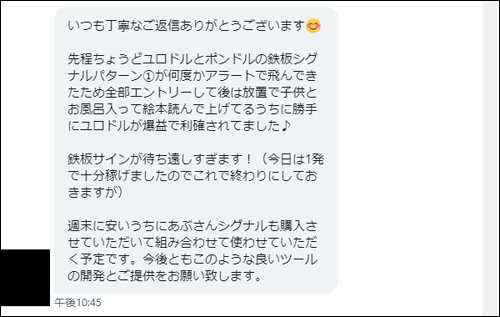
・Feedback from users who actually used the Heaven and Earth indicators (Review version)
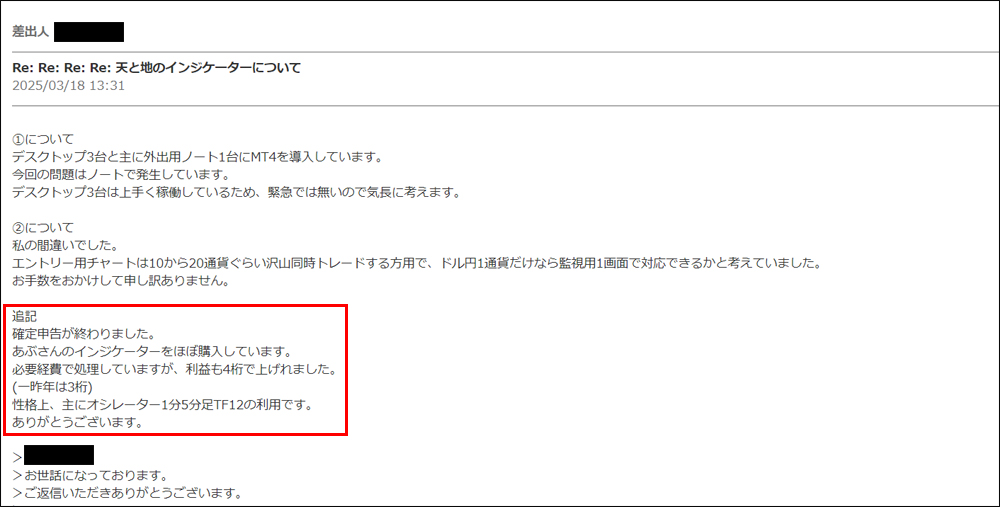
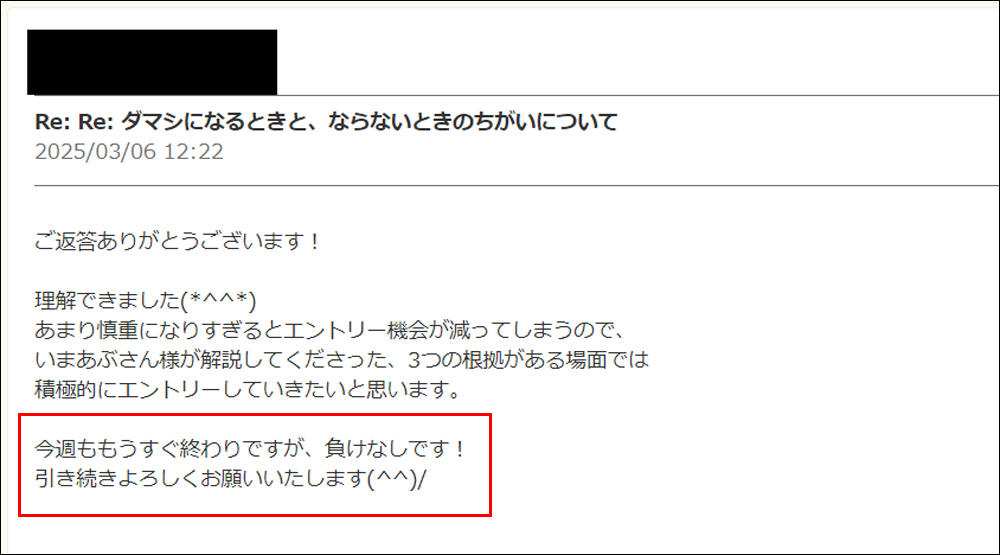
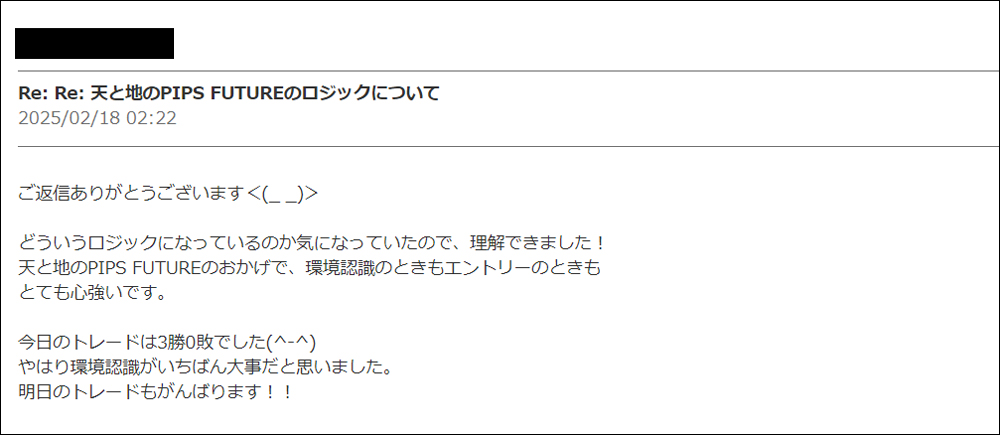
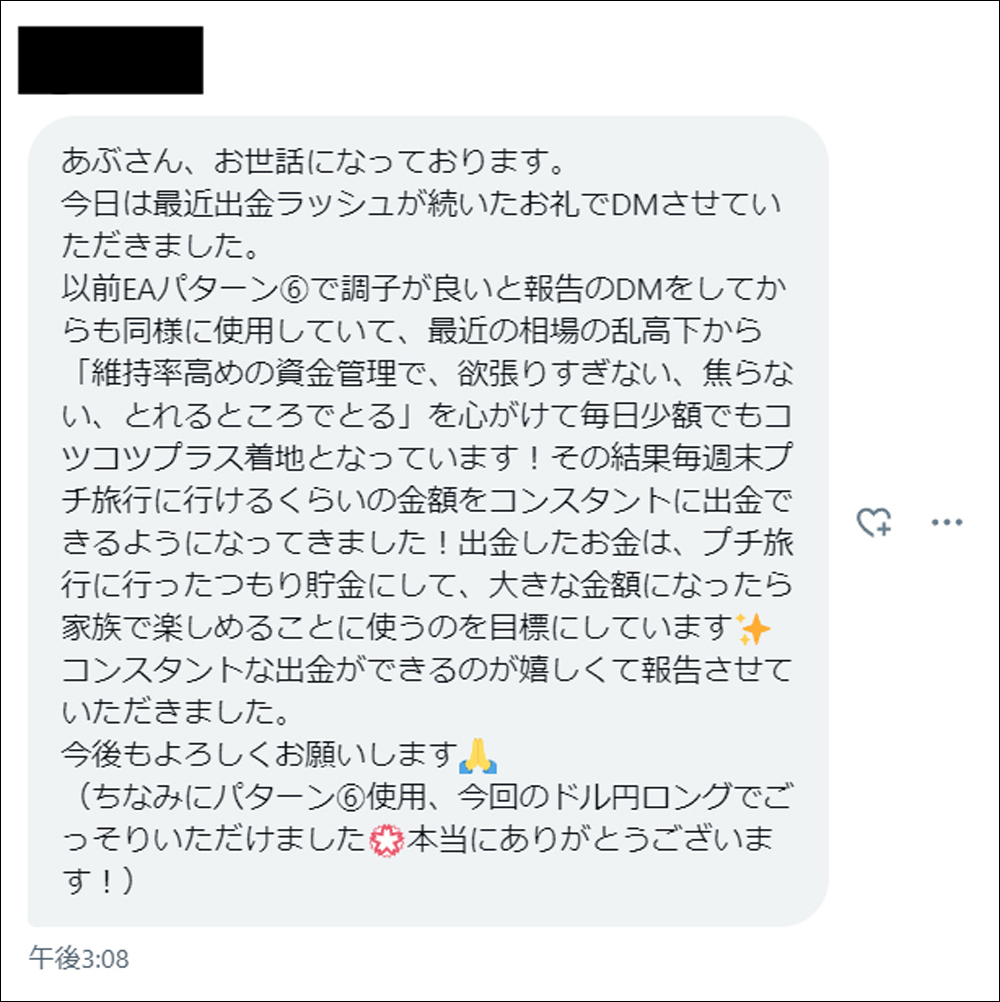
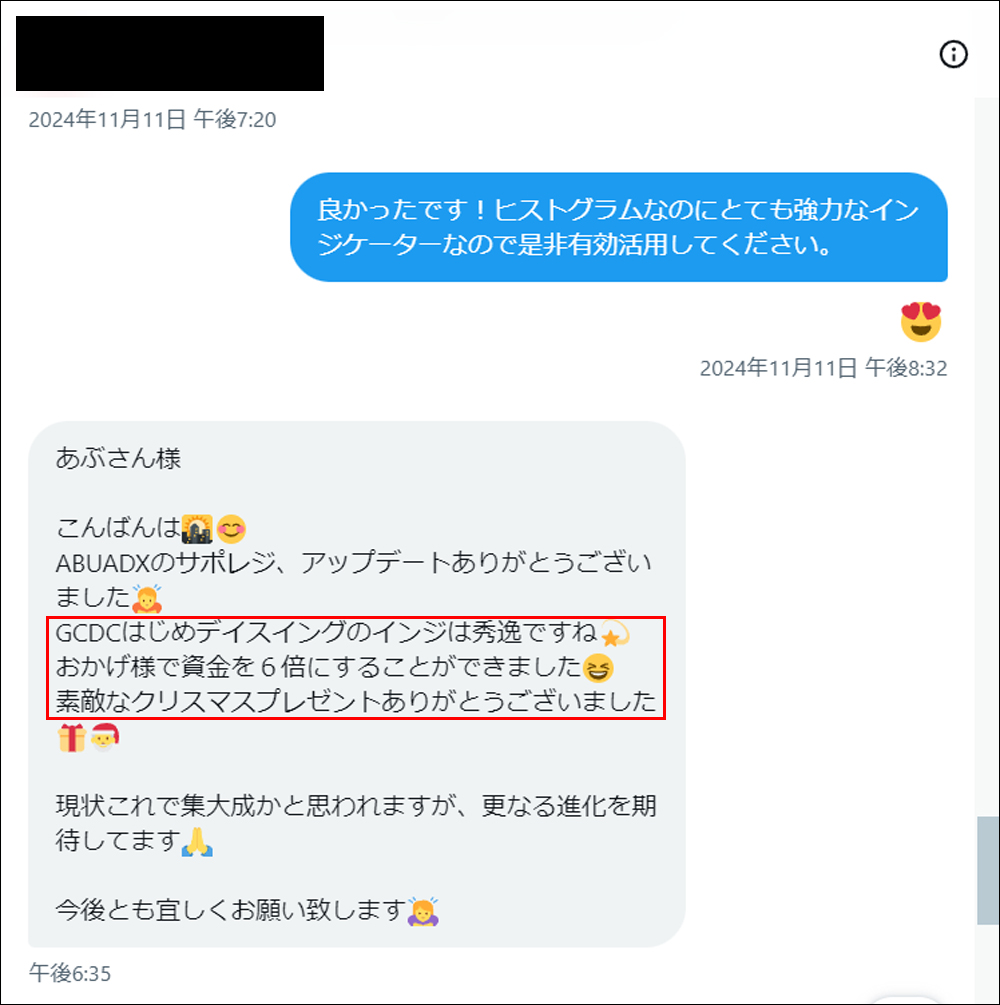
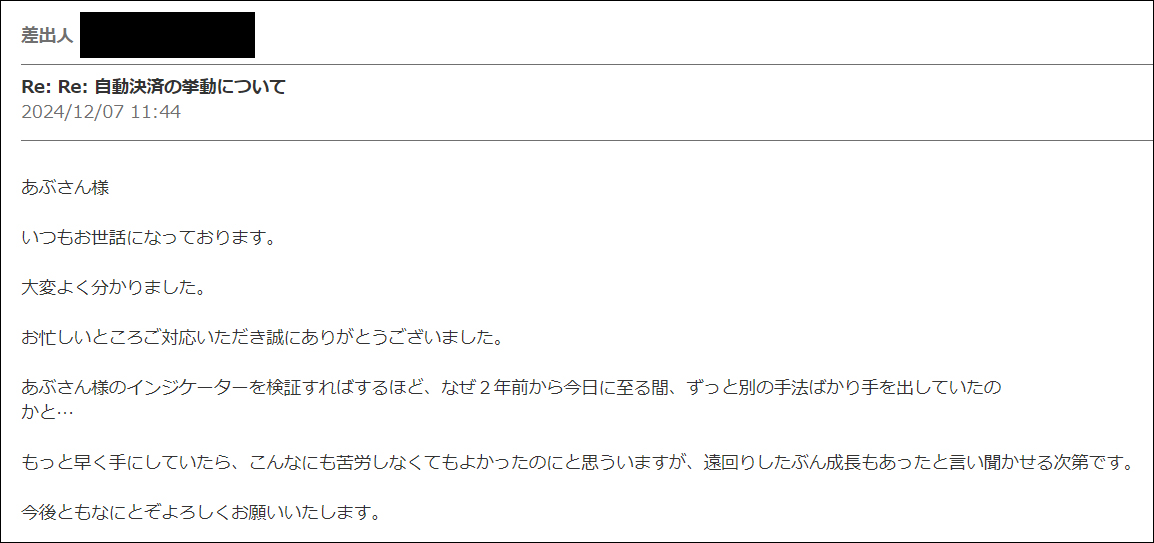
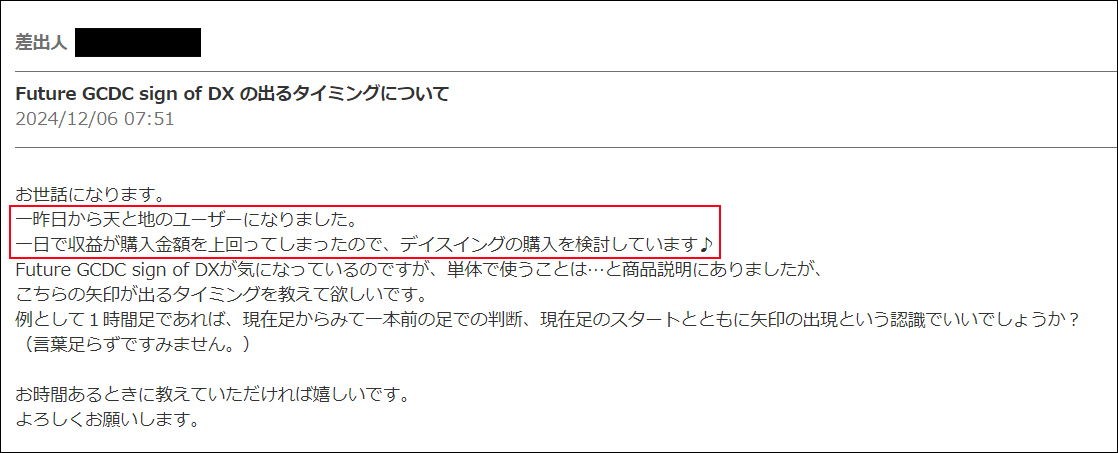
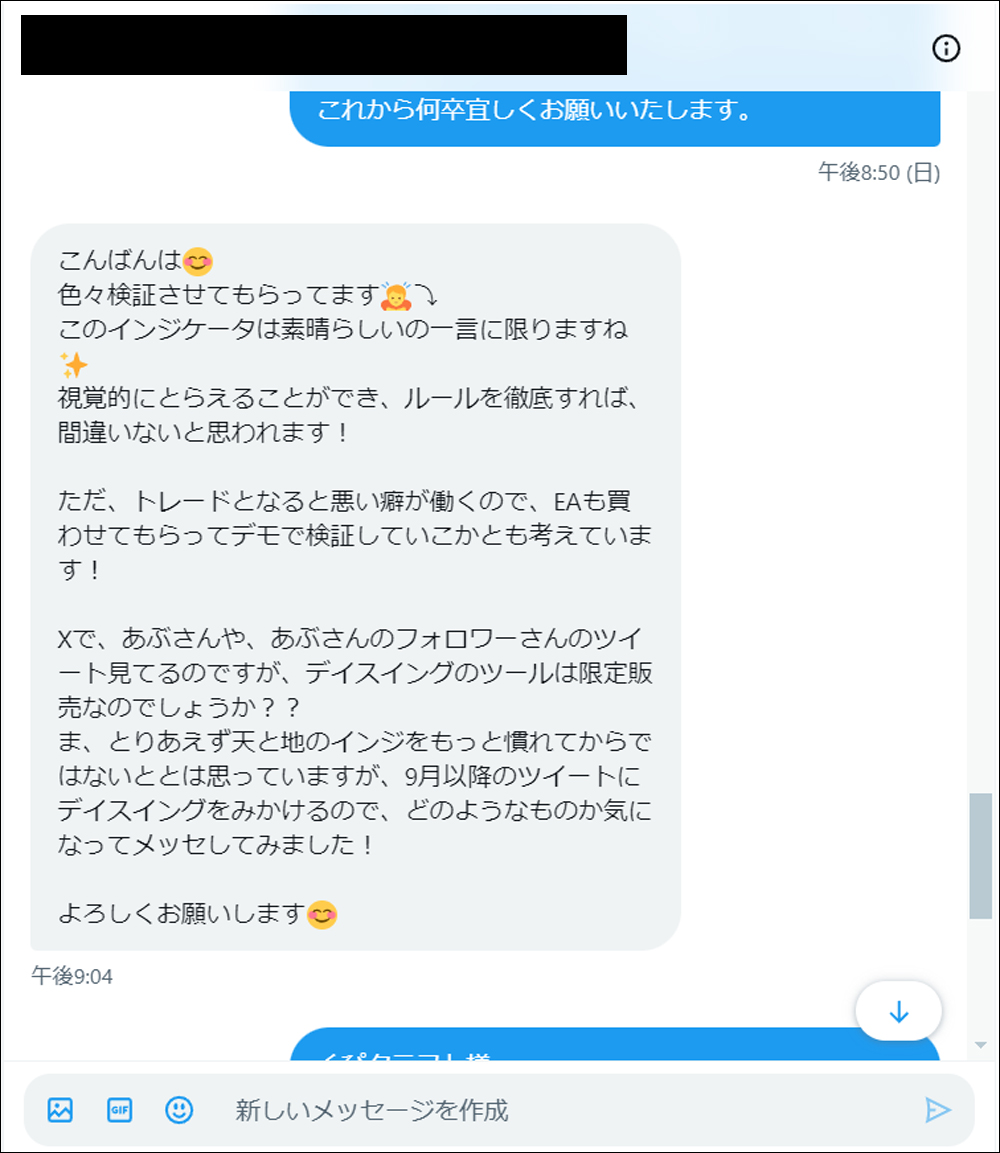
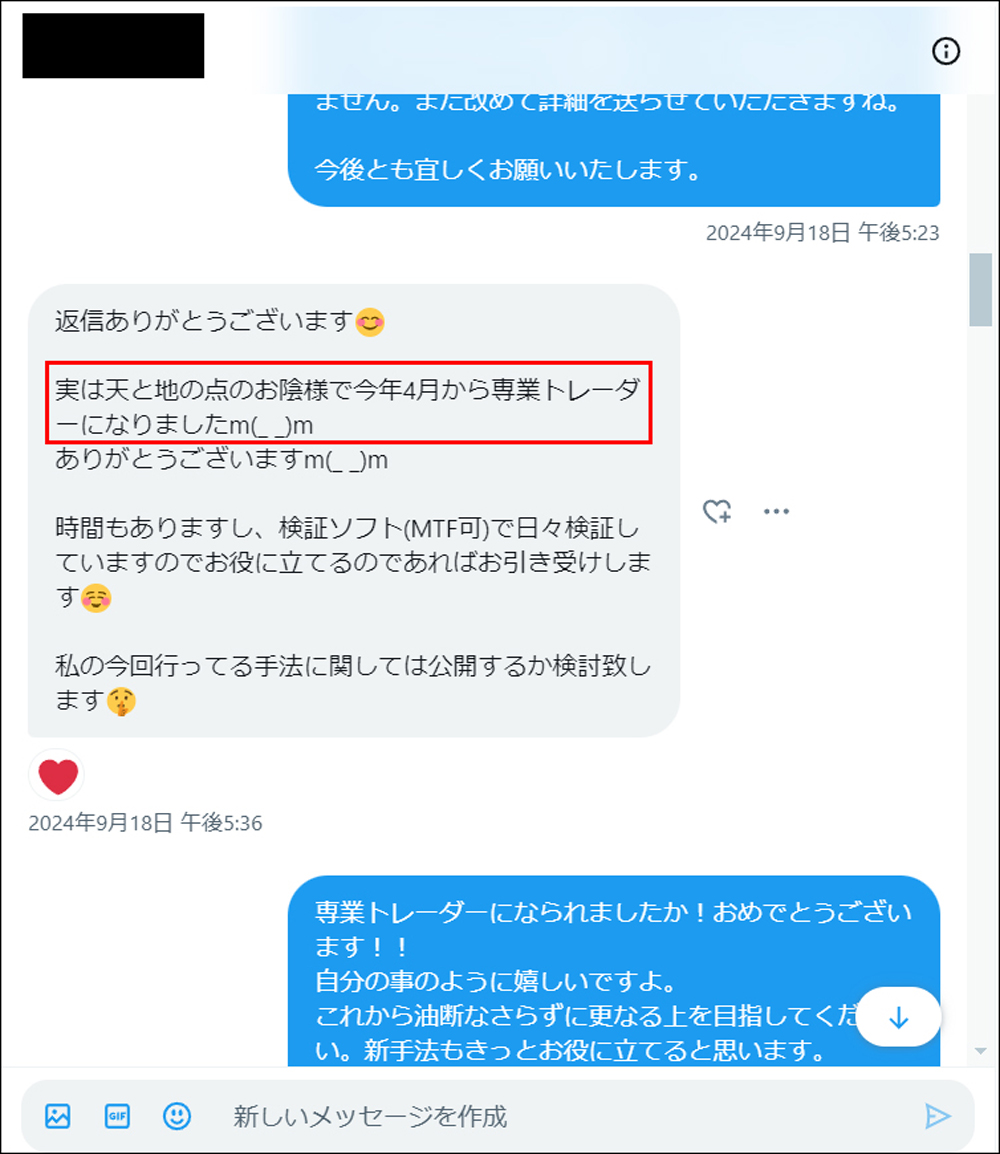
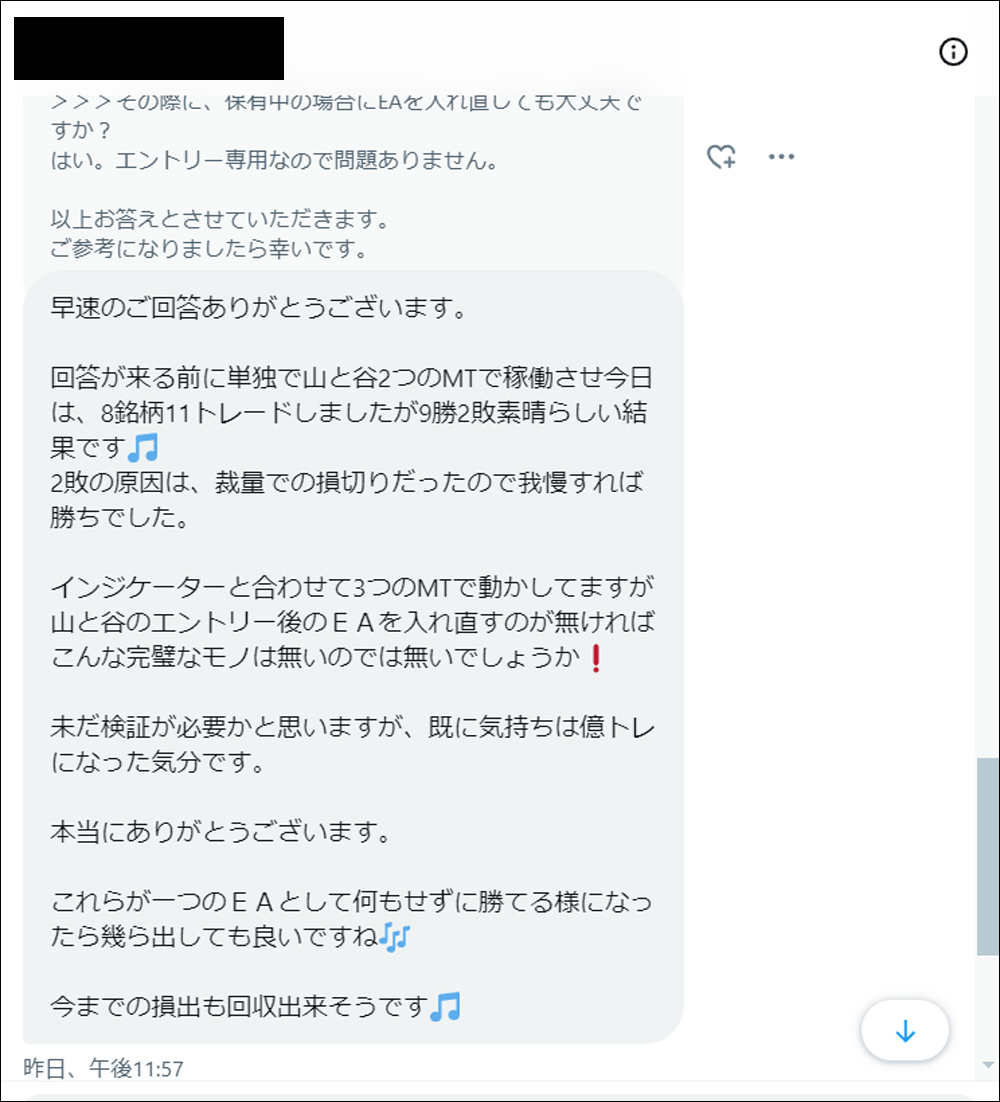
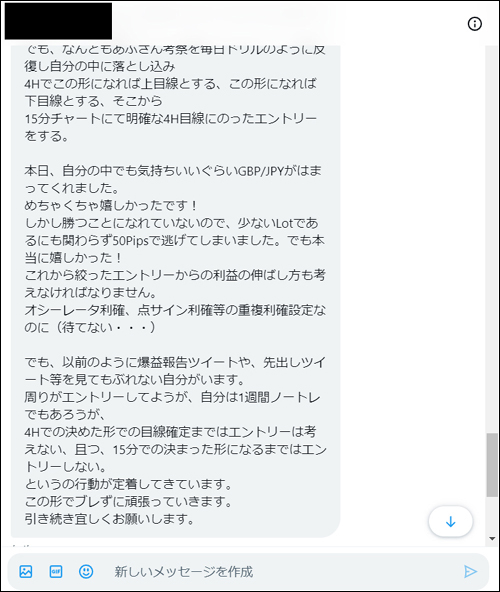
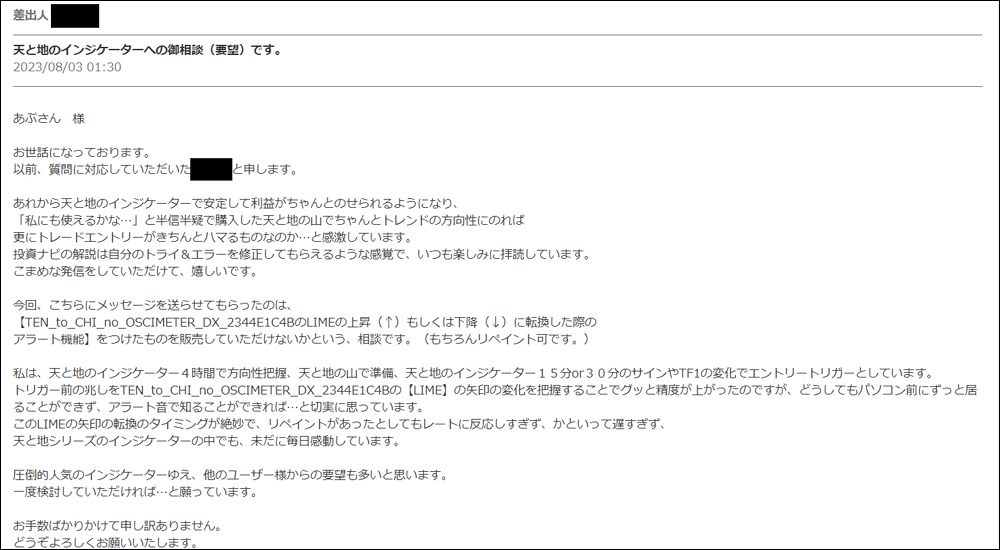
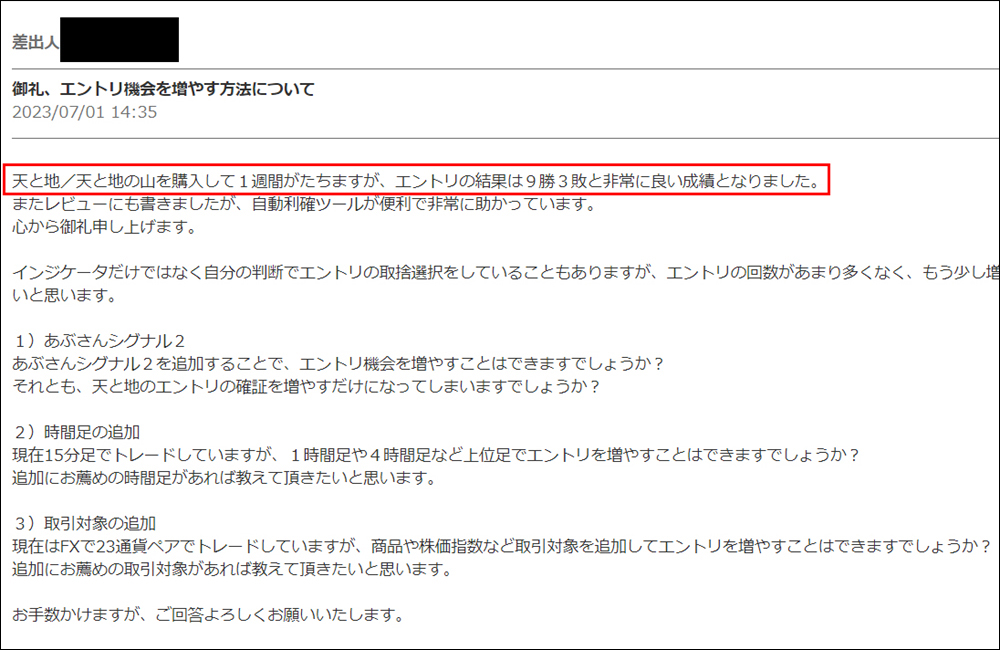
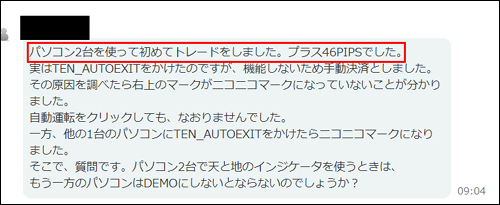
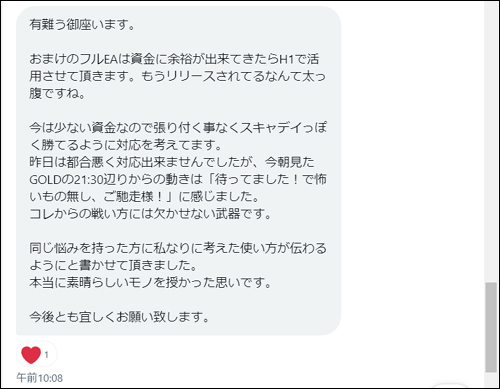
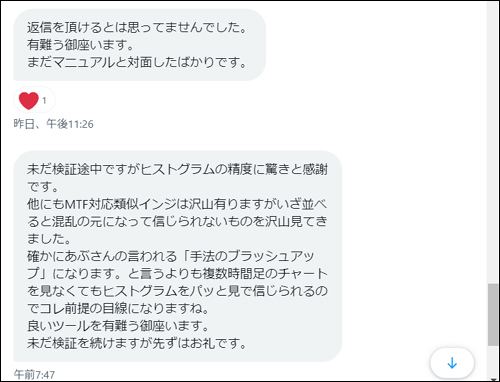
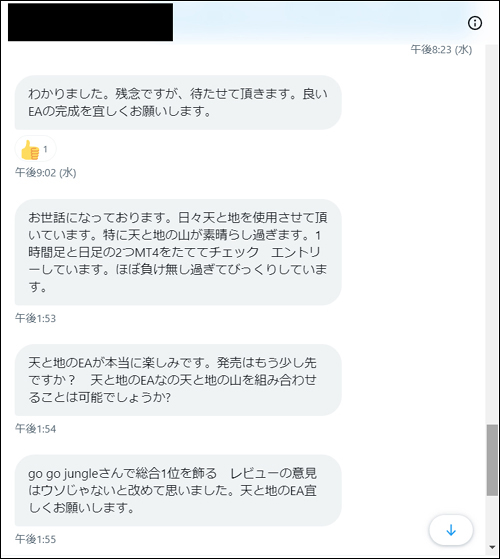
・Feedback from users who actually used the Heaven and Earth indicators (DM version)
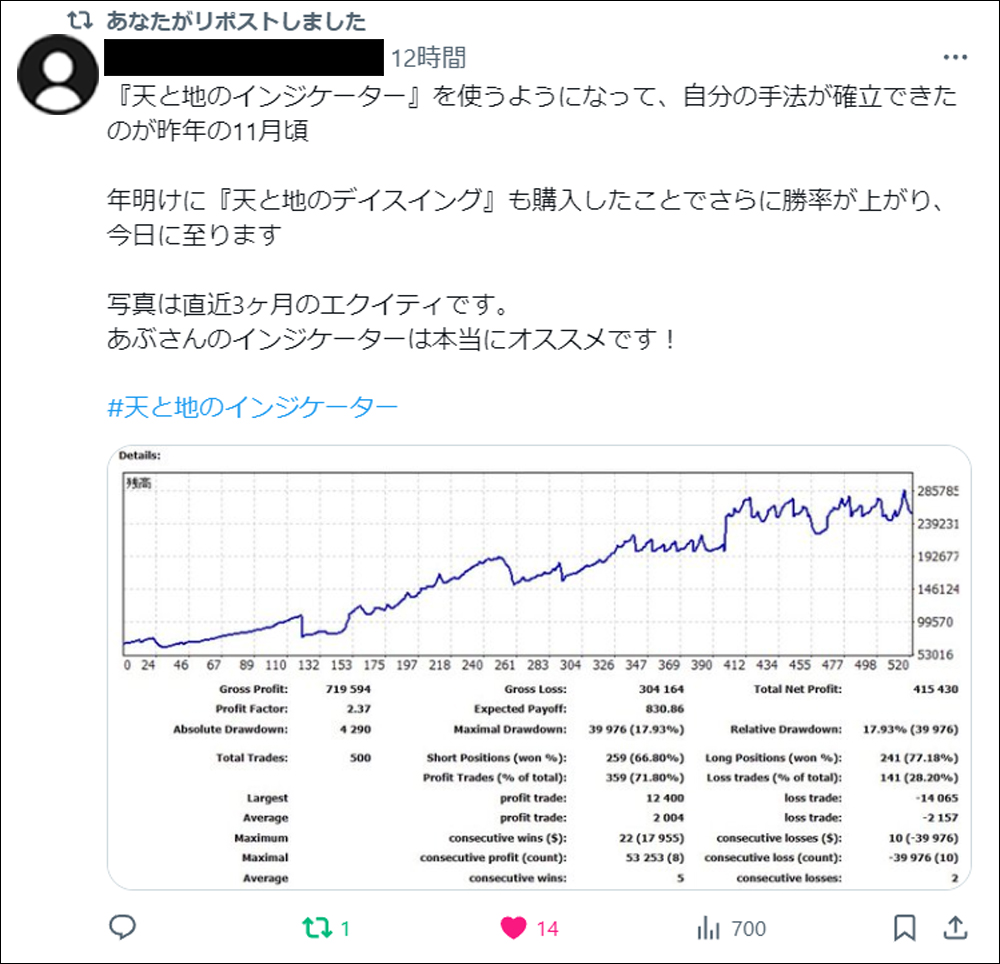
・I searched for “#HeavenAndEarthIndicator”
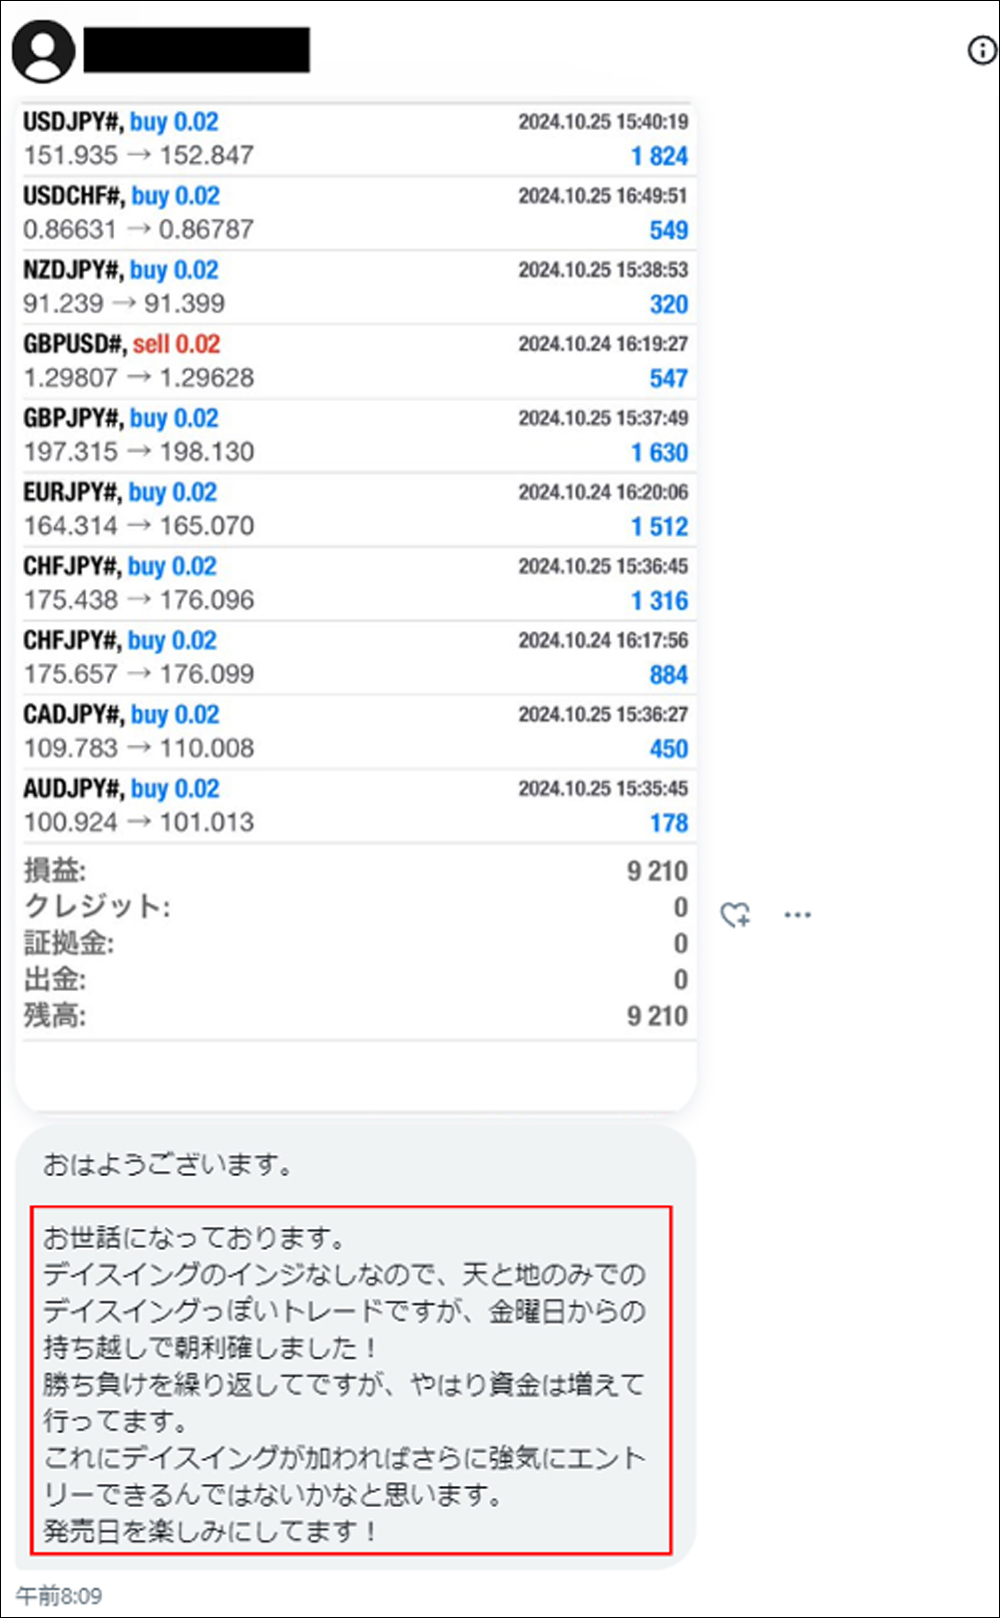
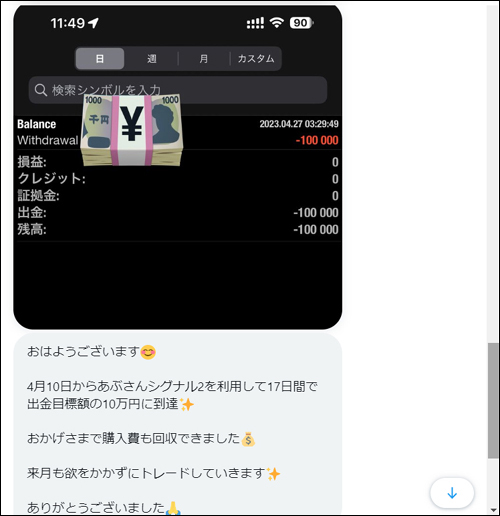
・Introducing posts from monitoring users who actually used the Heaven and Earth Day Swing
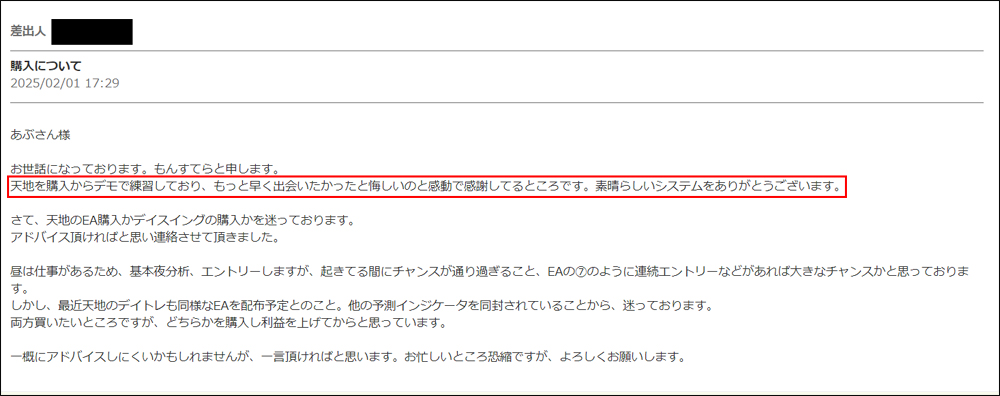
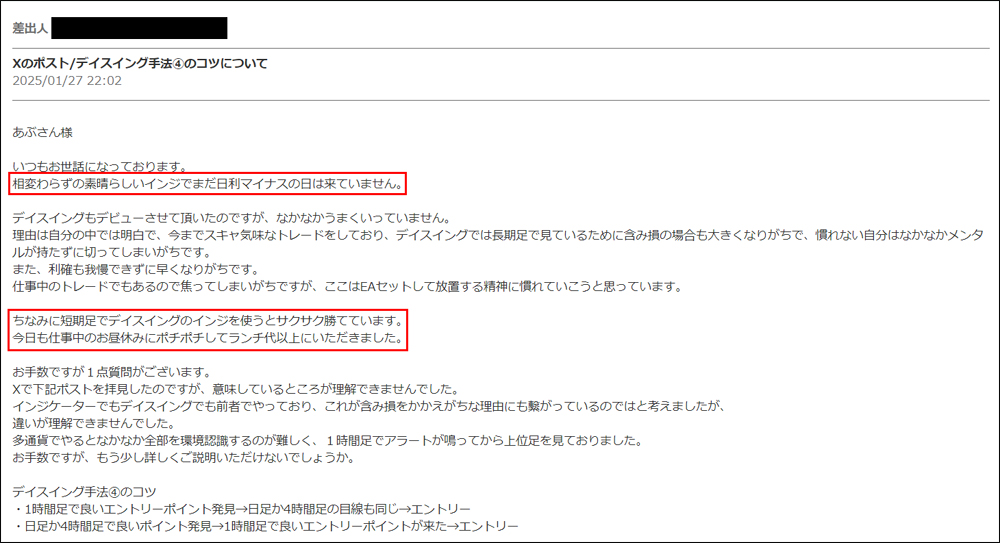
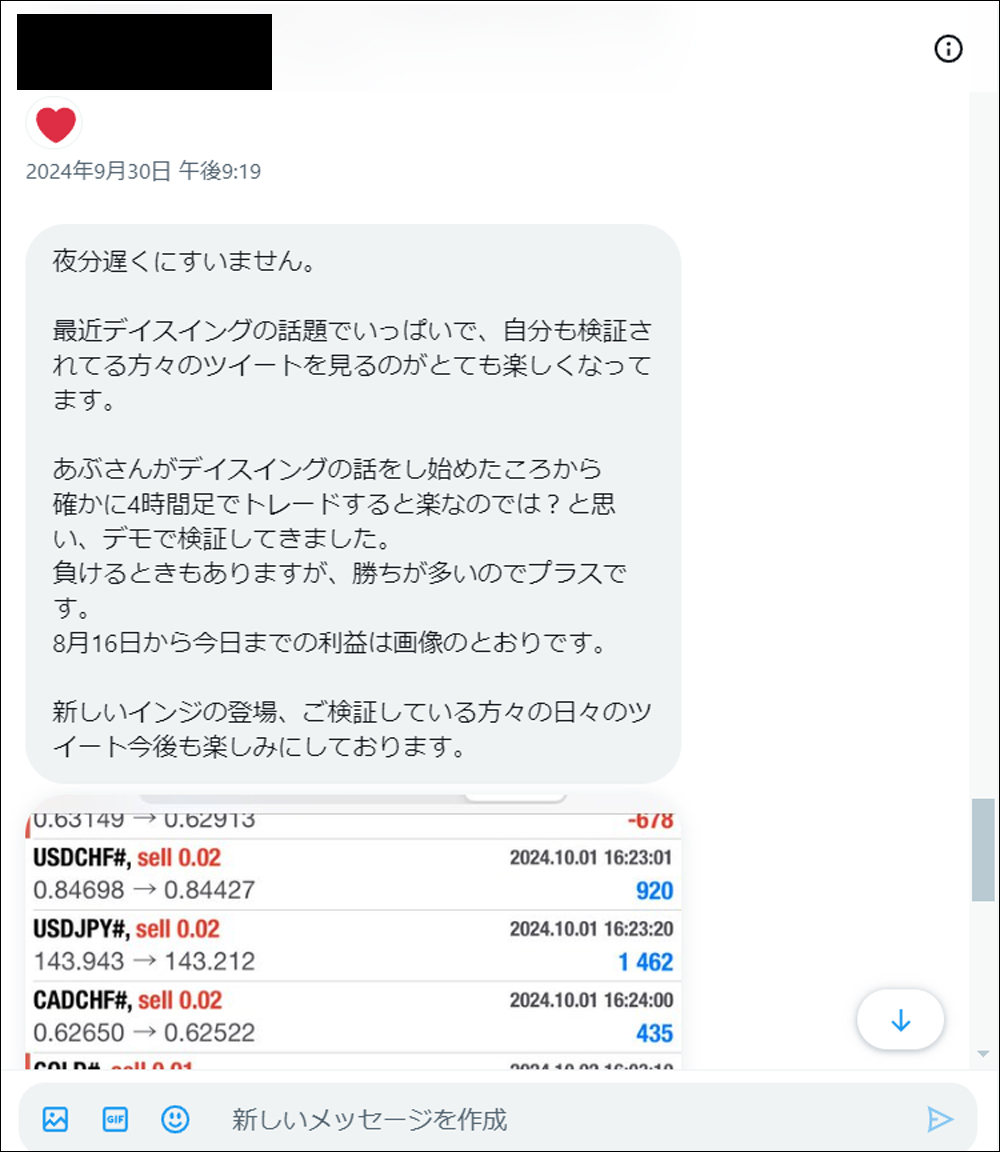
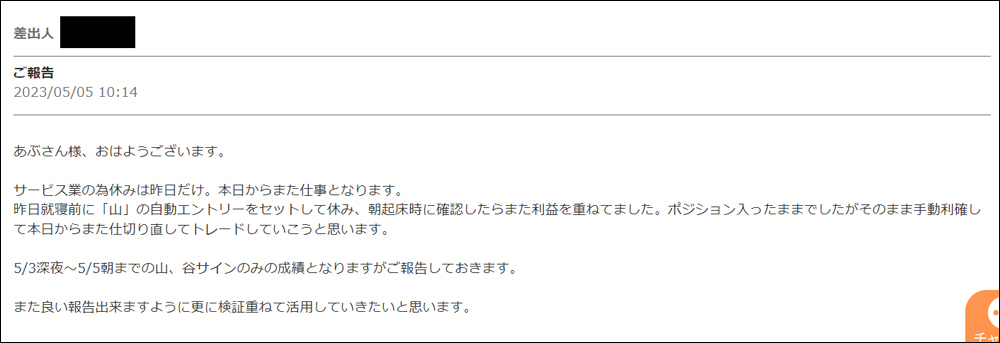
・Feedback from users who actually used the Heaven and Earth Day Swing
・I searched for “#HeavenAndEarthDaySwing”

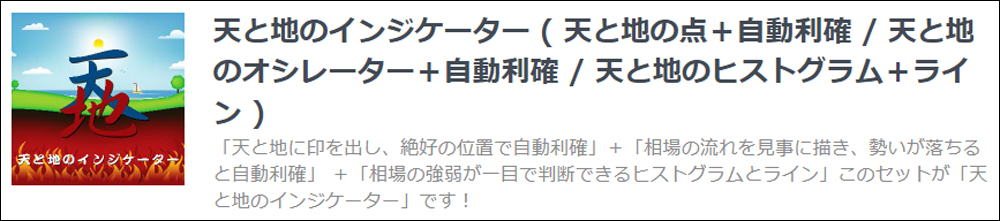
・Heaven and Earth Indicator is a trading method using an original indicator developed by A-Bu-san, released in February 2022.Thanks to everyone's support“GogoJungle Award 2022, 2023, 2024, 2025, awarded four years in a row.
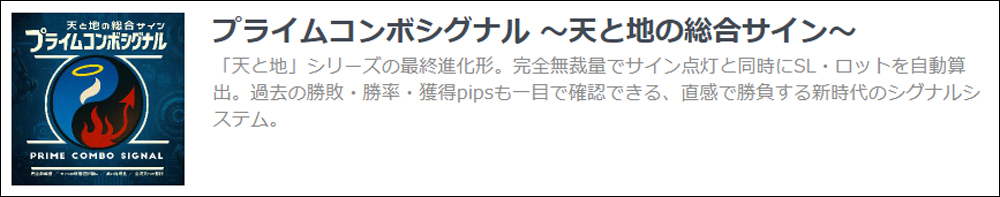
・In this article“Heaven and Earth Indicator” is used to validate and discuss the“Heaven and Earth Day Swing”Day Swing as a method. Further, as an entry trigger, I will also explain“Prime Combo Signal”.
For the basic trading method of Heaven and Earth Indicator, please refer toarticles before August 2024.

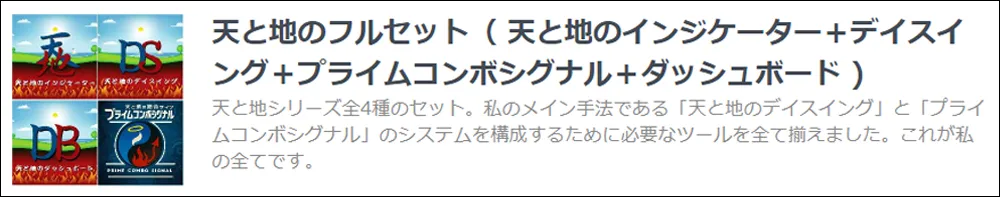
This is the full set that includes everything needed to operate the two systems I actually use: “Heaven and Earth Day Swing” and “Prime Combo Signal.” It is not a collection of disparate indicators; it is a complete, single-strategy setup. This is all of my trading.
【A-Bu-san / Special Video Vol.1】Users exceed 3,200 in number! Are you still trading FX without Heaven and Earth? Why not relax while earning?

【A-Bu-san / Special Video Vol.2】Skill gap? No, equipment gap. If you don’t use this, you’ll be at a huge disadvantage.


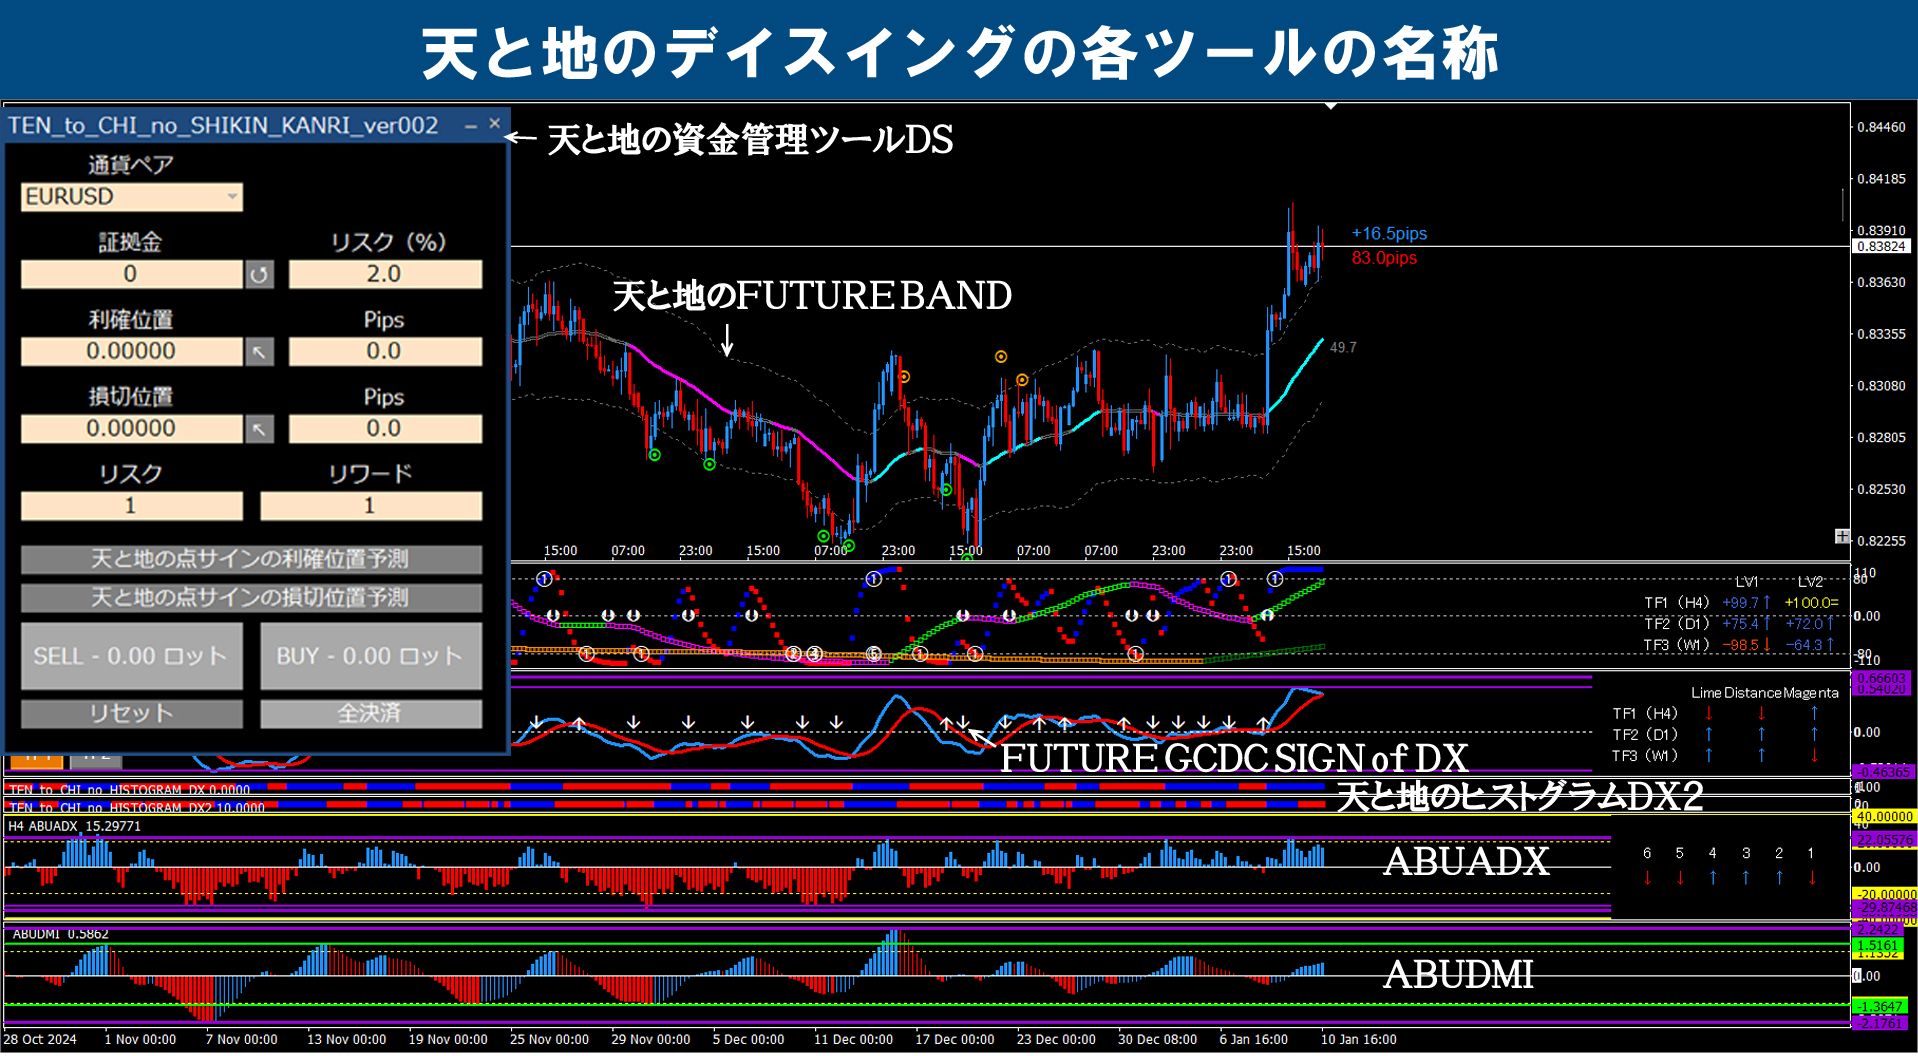
※For terms used on this blog, please refer to the images below. (All images can be enlarged by clicking).
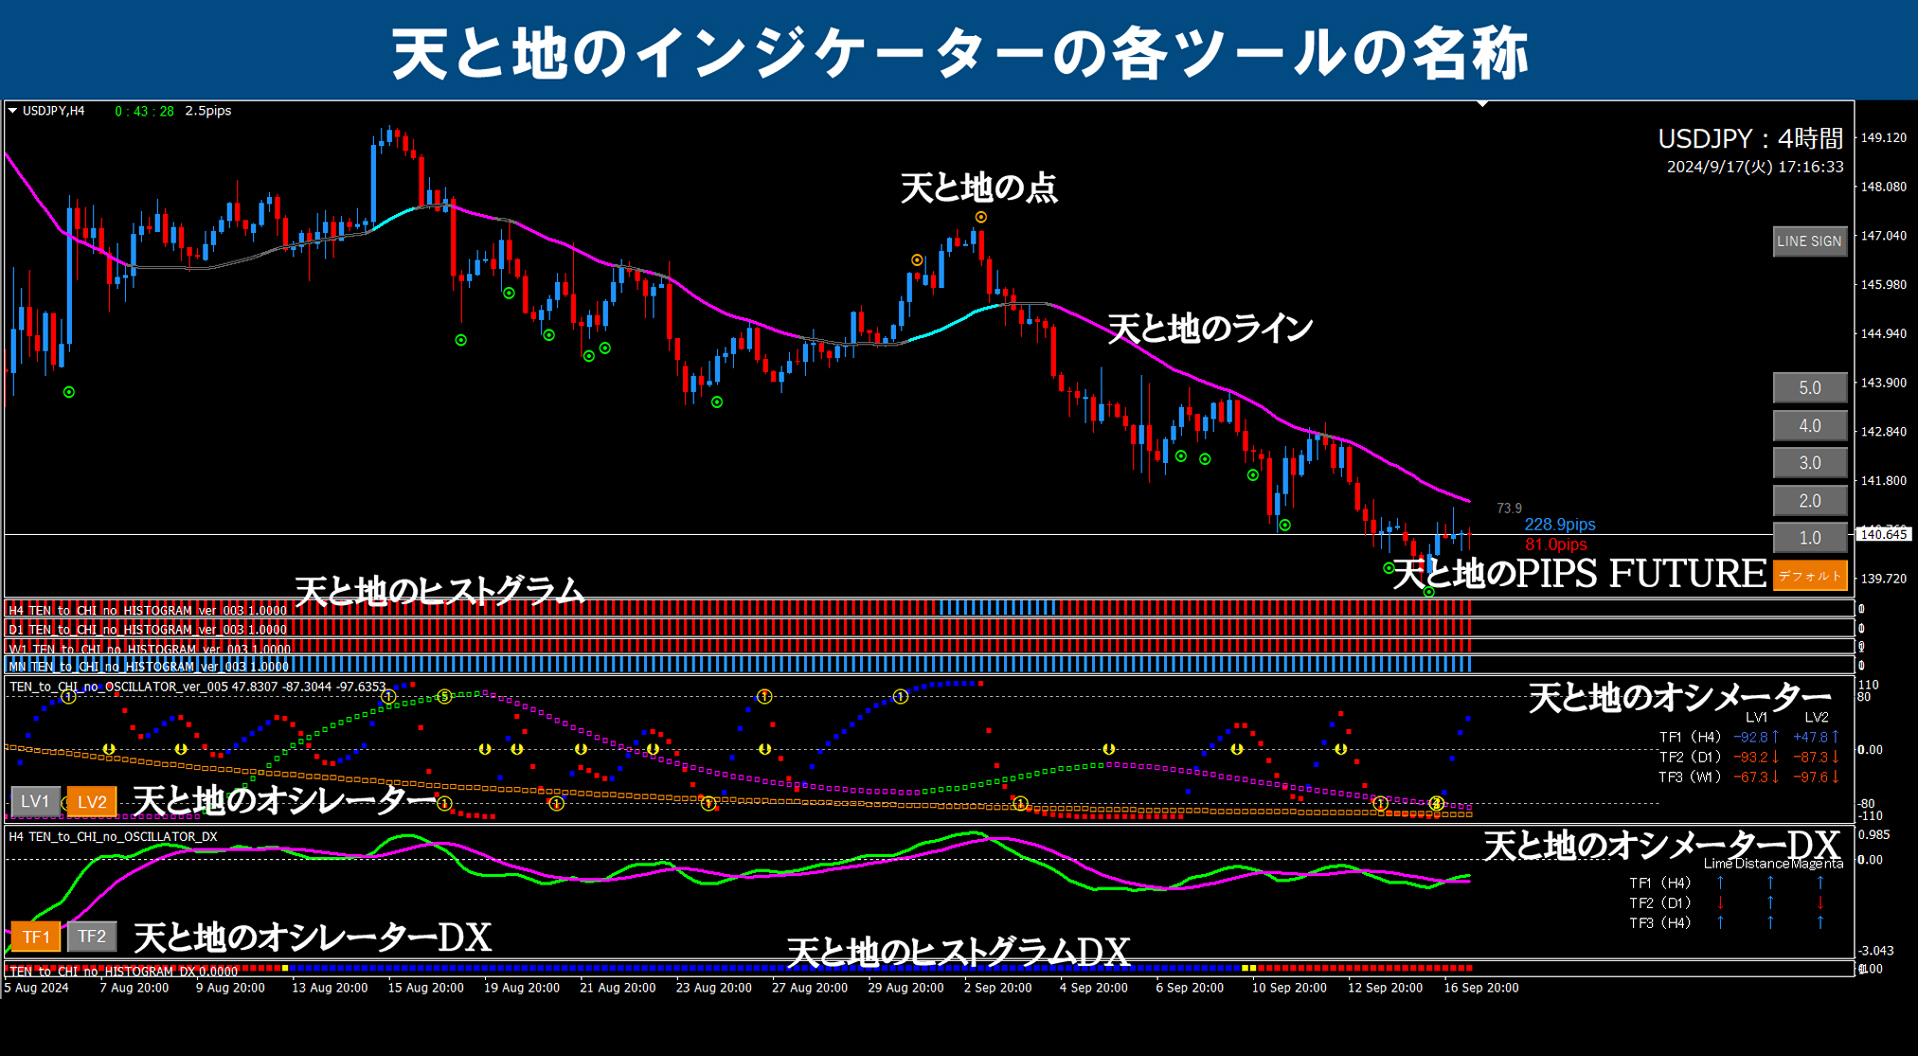


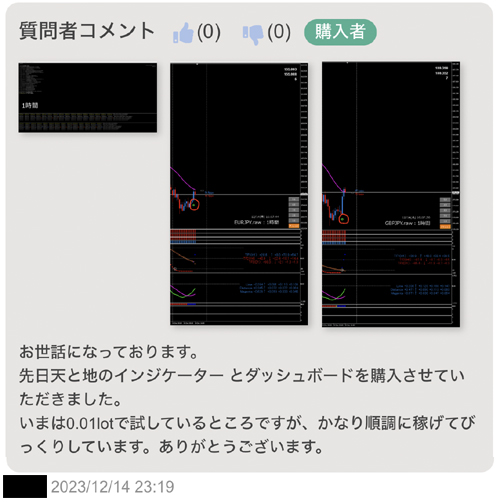
USDJPY / 15-minute chart + 4-hour chart + daily historical validation
※ Yellow dotted lines are drawn in the same place across all timeframes.
※ Yellow circles mark important points.
Note: Clicking the chart will enlarge it.
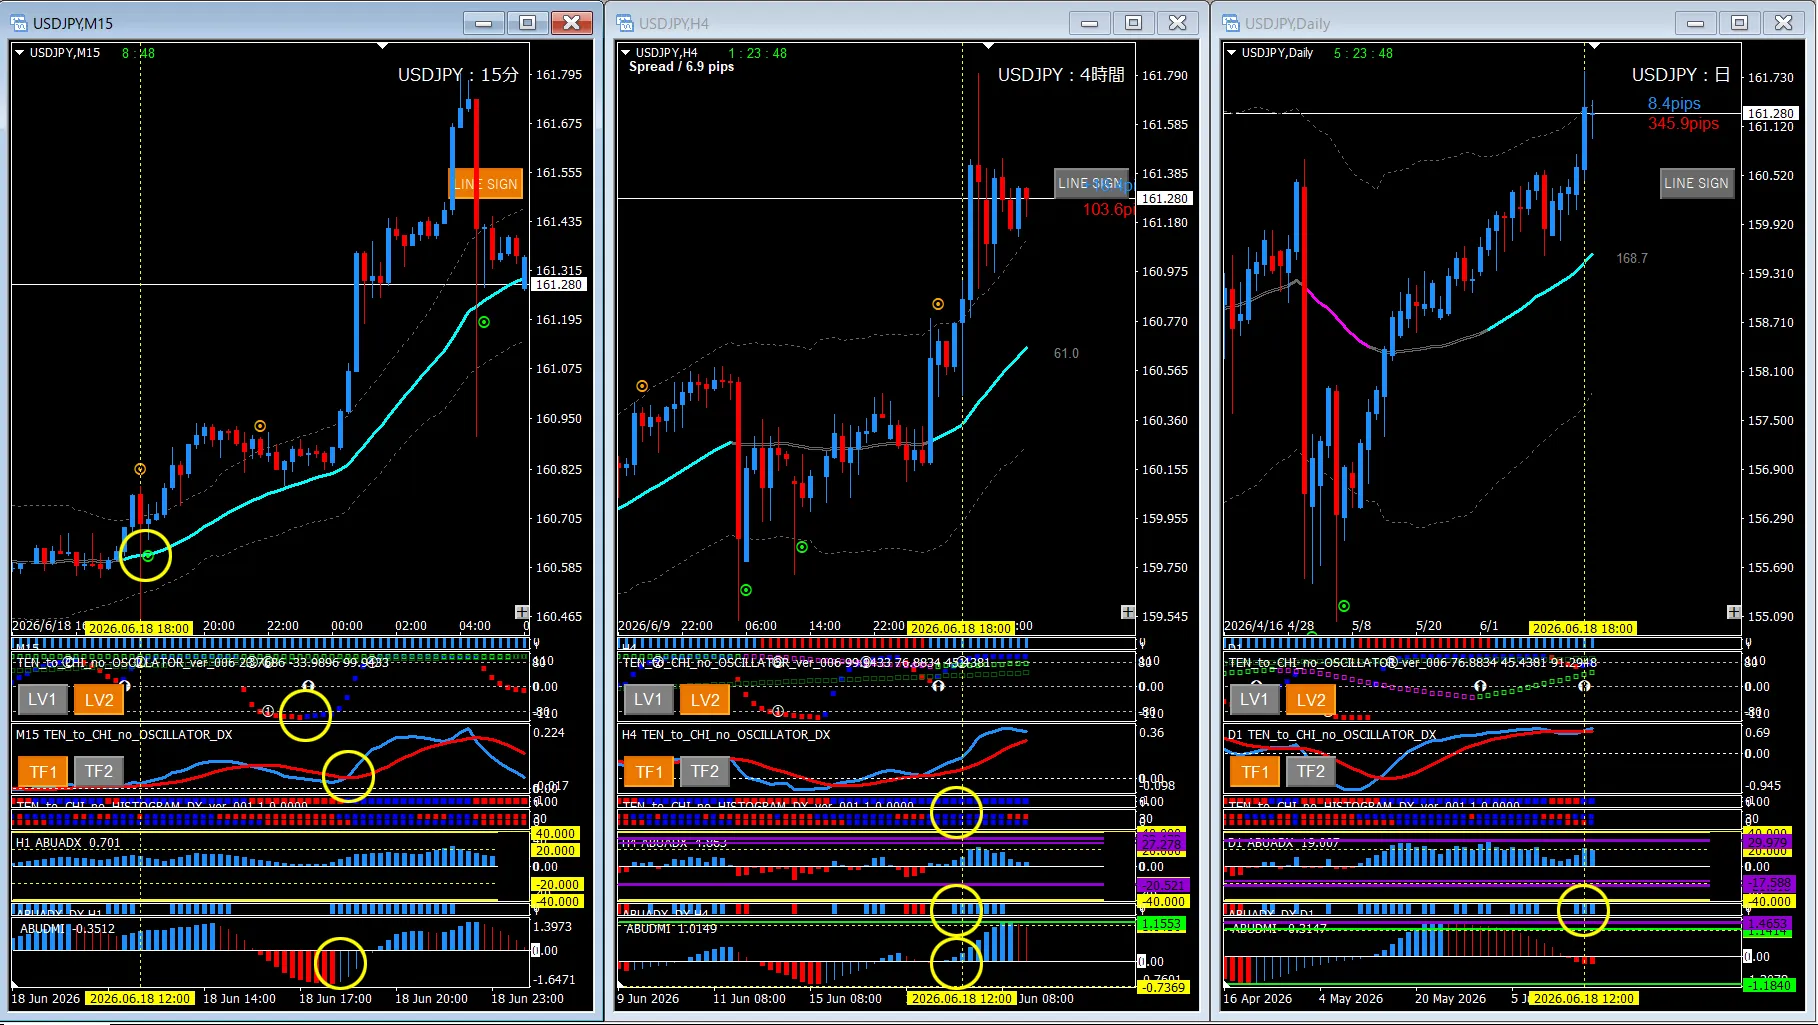
■ 15-minute chart (left: entry timeframe)
・ Dots signal (long)
・ Oscillator signal ⑥ color upshift
・ Oscillator DX (bullish cross)
・ ABUDMI (bullish color upturn)
■ 4-hour chart (center: environment recognition chart)
・ Histogram DX, DX2 (all blue)
・ ABUADX_DX (lighting confirmed)
・ ABUDMI (zero line cross)
■ Daily chart (right: environment recognition chart)
・ ABUADX_DX (lighting confirmed)
■ Summary
On the daily and 4-hour charts, ADX_DX is confirmed to be lit, and other indicators show an upward trend. At this point, keep a bullish bias and search for long entry points on the 15-minute chart’s yellow circle area. In particular, the bullish cross of Oscillator DX and the bullish color turn of DMI are also supported by ADX_DX (1-hour settings).
■ If using DSATEA
Since we determined a bullish bias at the yellow dotted area, at this point place a long-only setting on the 1-hour chart using DSATEA.
■ If using Prime Combo Signal
For example, with a long-only setting, set the filter to the 4-hour ADX_DX, and place entries on line touches, dot signals, oscillators, and ABUDMI. If you use ProCon to aid environmental recognition, even a rough configuration can produce results. Tighter, more refined settings will yield even better performance.

I hope this is helpful to everyone.
If you could press the GOOD mark, it would give me motivation for future work. I would appreciate your continued support for even greater enthusiasm.
