
[Free Distribution] Want a signature at the bottom? Created a天底 tool through trial and error with AI
This time the topic is“A Tool that Signals at Market Tops and Bottoms”
In short, it’s about wanting a signal at the reversal starting point of a market move.
If this could be done, no one would have trouble, but since you won’t know until you try, I started as usual by consulting AI.
Idea of the Method
At first, I told AI“I want a tool that signals at the market bottom before a trend, please start with the logic.”and tossed it out roughly.
Then it replied with a very earnest answer like, “Market bottoms are only identifiable in hindsight, so to detect in real time you should combine three things: detecting excessively stretched conditions, deceleration of momentum, and initial confirmation of a trend reversal.”
It also suggested about four candidates, and honestly I thought “too many.”
So I decided to convey my vision more simply.
“I want it to appear in the 3rd and 5th waves of Elliott Wave.”
In response, AI organized it as“The starting point of Wave 3 and Wave 5 basically share the same structure: ‘a pullback bottom in an uptrend’.”and explained it clearly.
That made intuitive sense, like, oh, I see what you mean.
In short, what I want to do is“Buy at the pullback bottom, sell at the retracement high”,that’s it.
Have AI Create the Specification
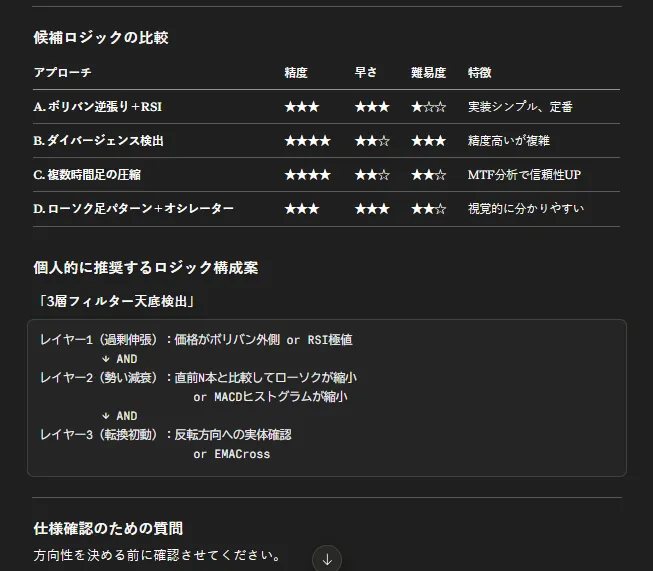
AI proposed several detection logic options, and I chose the simplest“Moving Average + RSI”option.
Confirm the uptrend with the moving average
⇩
Conclude a pullback when price presses to the moving average
⇩
Confirm a bottom when RSI recovers from the bottom
That’s the flow.
However, I thought there would be many false signals with just this, so I told AI that I’m worried about that.
“There seem to be many false signals with only this.”
AI agreed, “That intuition is correct.”
It listed patterns where one might buy when a downtrend changes, and proposed several filter candidates.
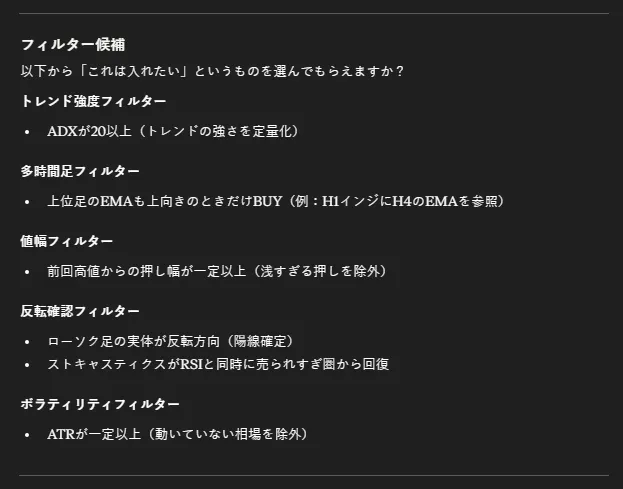
If you include all of trend strength, multiple timeframes, price range, reversal confirmation, and volatility, signals would be scarce, so reduce to 2–3.
I then chose the “Multi-Timeframe Filter.”
To avoid going against the larger flow, you know.
My intuition said this would be effective.
I refined the settings like this.
Look at the main chart and the timeframe two steps up, with the moving average set to the same period 21 on both main and higher timeframes. RSI starts buying when it recovers from the lower bound 30—a fairly strict setting.
Then I added that the condition “the moving averages 21, 50, 100 line up neatly (perfect order, three lines aligned to show a trend)” must also be true as a mandatory condition. With that, all four conditions are combined with AND.
Delegate to AI to Generate the Code
Once the specs were fixed, I just asked AI to “make it with this.”
I provided a mapping of timeframes (e.g., for M5, the upper is M30; for H1, the upper is D1) and had it generate the code.
Verification Results
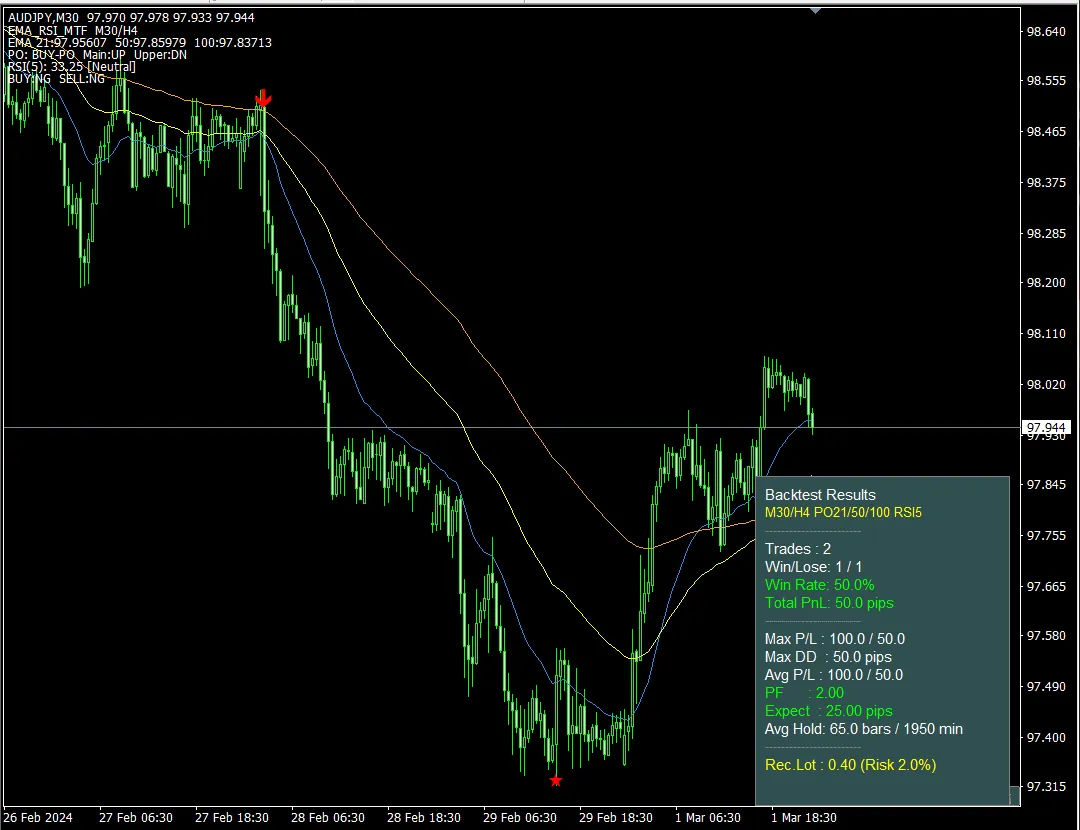
This is what was completed. It was run on AUD/JPY M30 (higher timeframe H4).
If you look at the chart, you’ll see a red arrow at the entry to the decline (the top), and a star marker at the bottom after that. It appeared exactly where the signal at the top and bottom is supposed to appear. I was genuinely happy about that.
Numbers from a simple verification panel are as follows: 2 trades, 1 win and 1 loss, win rate 50.0%, total 50.0 pips. Maximum win 100 pips, loss 50 pips, P/F 2.00, expected value 25.0 pips per trade, average holding 65 bars (1950 minutes). Risk 2% with lot size 0.40.
Thoughts on the Result
Honestly, two trades are far from a sufficient sample, so I can’t say anything about the win rate 50% or PF 2.00 yet.
I’ll be honest about this.
However, PF 2.00 (profit when winning is twice the loss when losing) can still be positive overall with a 50% win rate, so the shape isn’t bad.
When you lose, you cut at 50 pips; when you win, you can gain 100 pips. It’s a risk-reward-positive shape, I felt while watching.
More importantly, the position of the signals on the chart. The signals appeared at the exact top and bottom where I wanted them. That is the gain this time.
By hardening the conditions to reduce false signals, the number of signals is low. But that’s as expected, and I think the direction is right since I wanted a tool that signals only at key moments.
The Final Version “EMA_RSI_MTF” Will be Distributed for Free
So, the finished tool will be distributed for free. The tool name is EMA_RSI_MTF, an MT4 indicator (mq4).
To summarize what it does: it checks the direction of the moving average on the time frame two steps up from the main one, and prevents signals that go against the larger flow.
Then it only allows BUY when the moving averages 21, 50, 100 line up in order (SELL if opposite), and additionally BUY is signaled when RSI (period 5) recovers from the bottom; SELL is signaled when RSI drops from the top. All four conditions must be met for an arrow to appear. The conditions are strict, so there are fewer signals, but it’s a tool that signals at moments that matter.
Distribution will be via the free listing page on GoGoJang. It’s free, but you’ll need a GoGoJang account to download. Put the mq4 file into MT4’s MQL4/Indicators folder and restart, and it will appear in the Navigator.