
Automated stock trading and a tool that can provide an “answer check”
TrendSync ―― Buy, verify, and plan your strategies
TrendSync is a tool that automatically trades day trading in Japanese stocks.
Here is an image of actual automated trading.
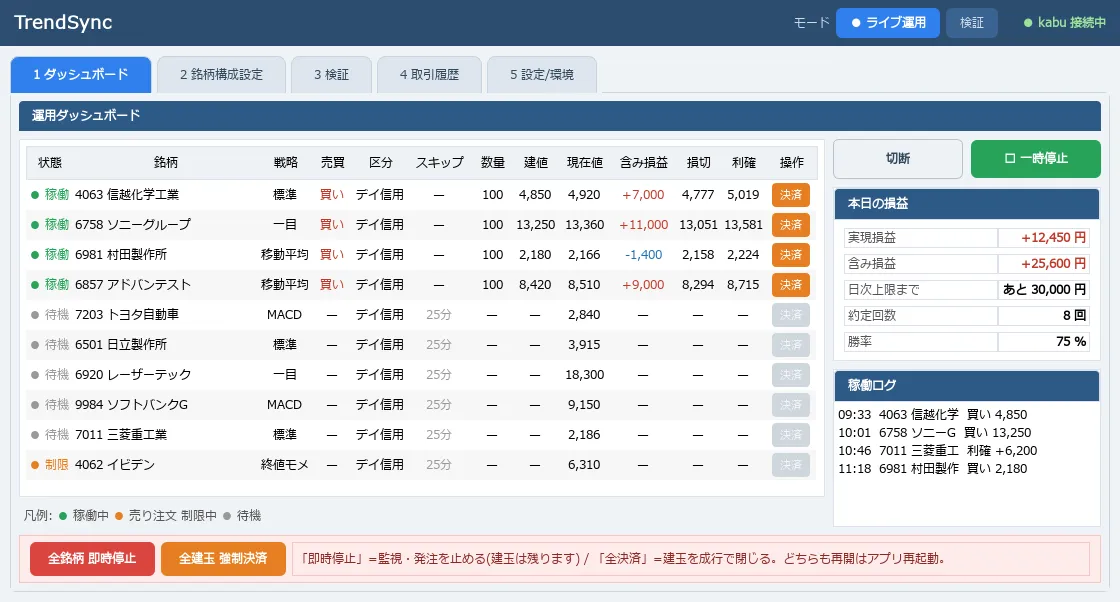
Connect to the e-Smart Securities system (Kabu Station),
and with pre-set strategies and settings, it trades automatically without human intervention.
However, it is not just a tool that trades automatically.
Its main feature is that after a trade,
it has a verification function to “review the trade by simulation.”
We introduce a tool that can both trade and verify.
Recommended for people like this
- Eliminate emotions and mechanically realize profits-taking and stop-loss
- Want to try auto-trading of stocks with a small amount using your own method
- Want to carefully refine stock selection and strategy
- Want to review “why you lost” not by feeling but by numbers
etc.
It is a tool aimed not at flashy wins but at stable, continuous operation.
If any of these resonate, it’s worth trying at least once.
Why “verification”
Anyone who has touched auto-trading or signal tools has probably felt:
“On past data I would win, but in practice, the profit isn’t as high as expected.
Rather, there are more days of loss.”
The reason is a structural misalignment common to many tools.
Time lag from order to execution, price slippage, timing of decisions.
Real-world frictions accumulate and become “win on paper, lose in reality.”
The problem is that many tools do not measure this misalignment.
They show only favorable calculations and do not confirm whether they truly match real operation.
What you can do with verification ― simulate multiple strategies trades
TrendSync’s main feature is not promising profits, but
allowing you to repeatedly test the countless combinations of “strategies × parameters” with high precision.
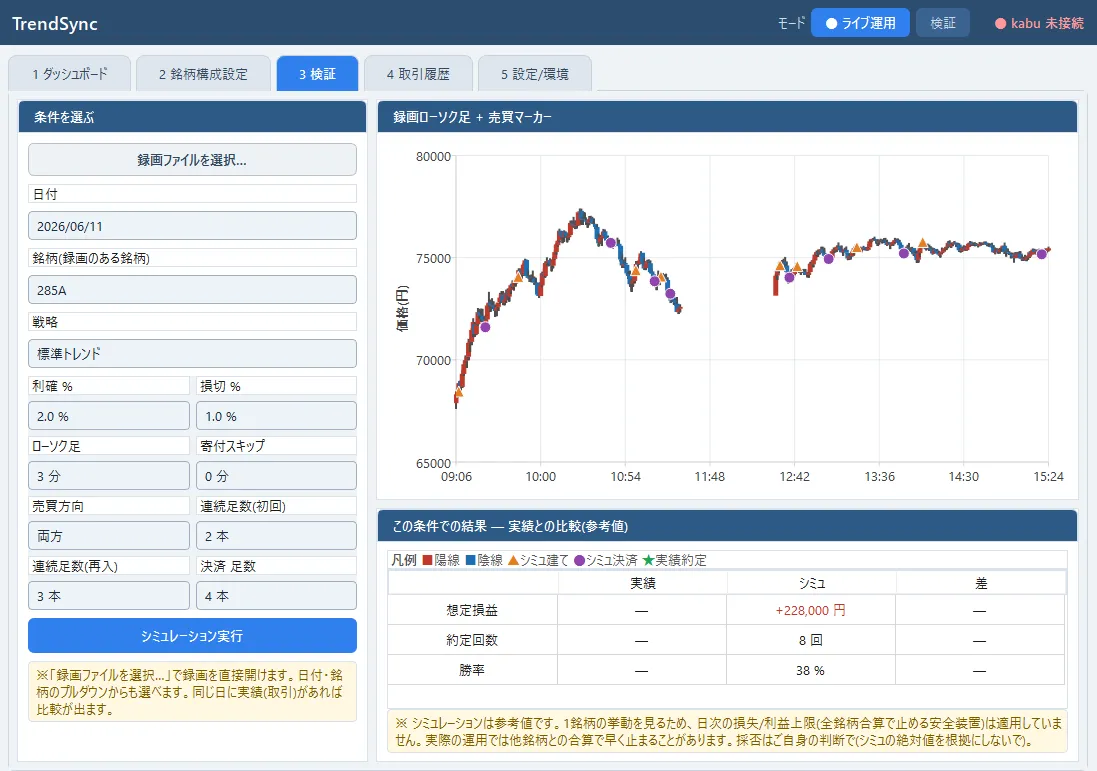
Using actual trading data, you can verify the following, for example.
・If operating with the same strategy, would the trades have been executed?
・When was the buy/sell timing? Did it meet expectations?
・What were the actual trading results? Profit and loss??
Before actual deployment, you can use not only data from the trading day but also past data to repeatedly refine the strategy.
You can adjust and rework the strategy multiple times using historical data.
Why can it reproduce with high accuracy
To test without misalignment and to obtain correct results, the simulation must be made not as an “ideal” but as “very close to reality.”
The points to achieving high-precision simulation are below.
・Reproduce the same price movements you actually watched (candlesticks)
・Align the decision timing (how often you review) with real movement
・Reproduce the exact prices at which trades would be filled, down to each micro-movement
So the simulation becomes not an “optimistic number” but a “near-real reproduction.”
Strategies tested here tend to move in a similar way in practice.
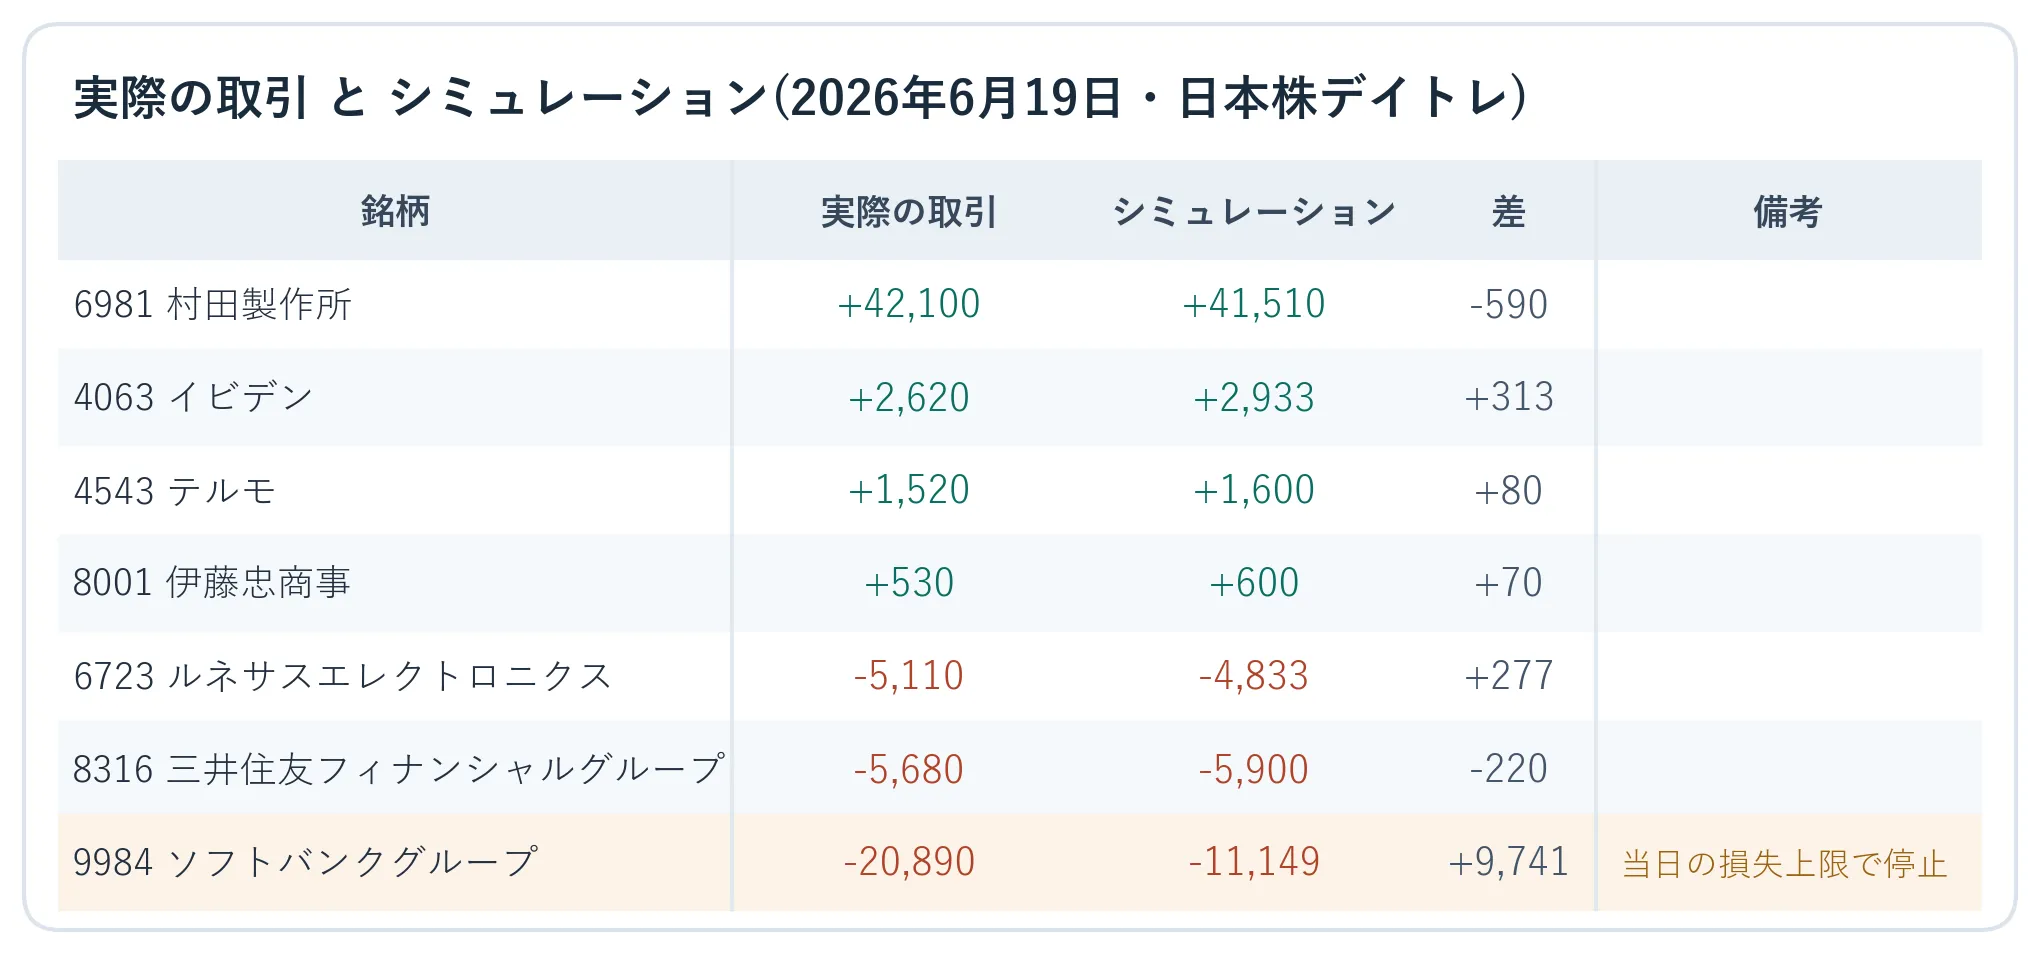
This is a summary of actual trades and simulations.
Among 7 stocks, 6 show that actual trades can be reproduced by simulation.
Only SoftBank Group (9984) differs,
this is due to the daily loss cap reached by the safety feature.
When losses reach the cap, trading for the target stock automatically halts.
However, on this day, it also shows that it would have been better not to halt automatically.
For example, in this day’s review:
・Next time, try 200 shares of Murata Manufacturing (6981) instead of 100
・Change the strategy for Renesas (6723)
・Stop the loss cap halt for SoftBank Group (9984)
These are possible considerations.
Thus, this tool is not only for automatic trading but also enables the user to test and refine daily trading strategies afterward
based on that day’s market conditions.
Which strategy, which settings, and which time frame worked well?
You can verify with your own eyes and apply it to your next move. It is possible to test on any day, not just special good days.
Regarding profit and loss status
For about two months, here is my personal performance.
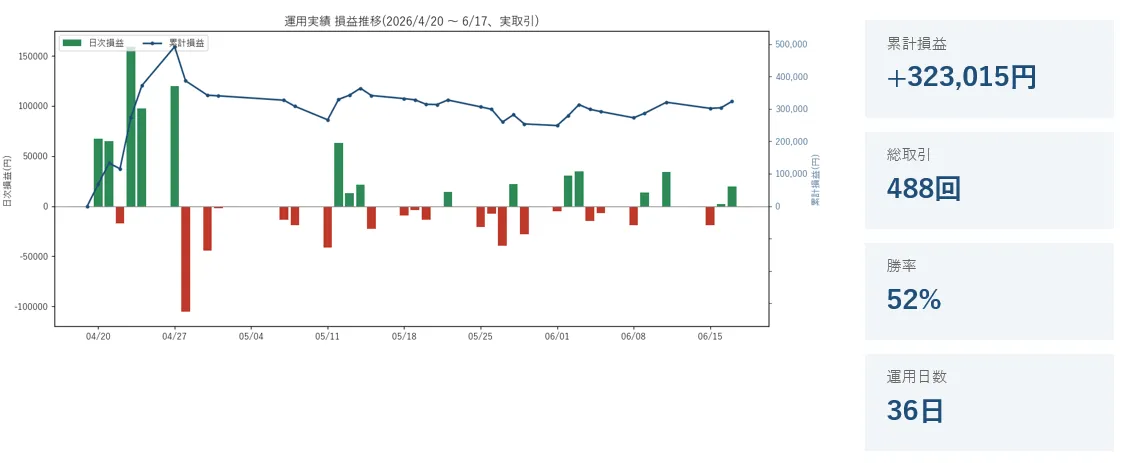
People have various approaches to selecting stocks and formulating strategies,
and there is potential to gain more profits or less. Please treat this as reference information.
Summary
Many tools show flashy numbers.
But focusing on how closely they can reproduce real market conditions,
and giving users multiple chances to try, is not commonly seen.
We believe that accurate, close-to-reality reproduction is essential, even if it is modest.
From now on, we plan to regularly post results of stock verifications and trading performances.