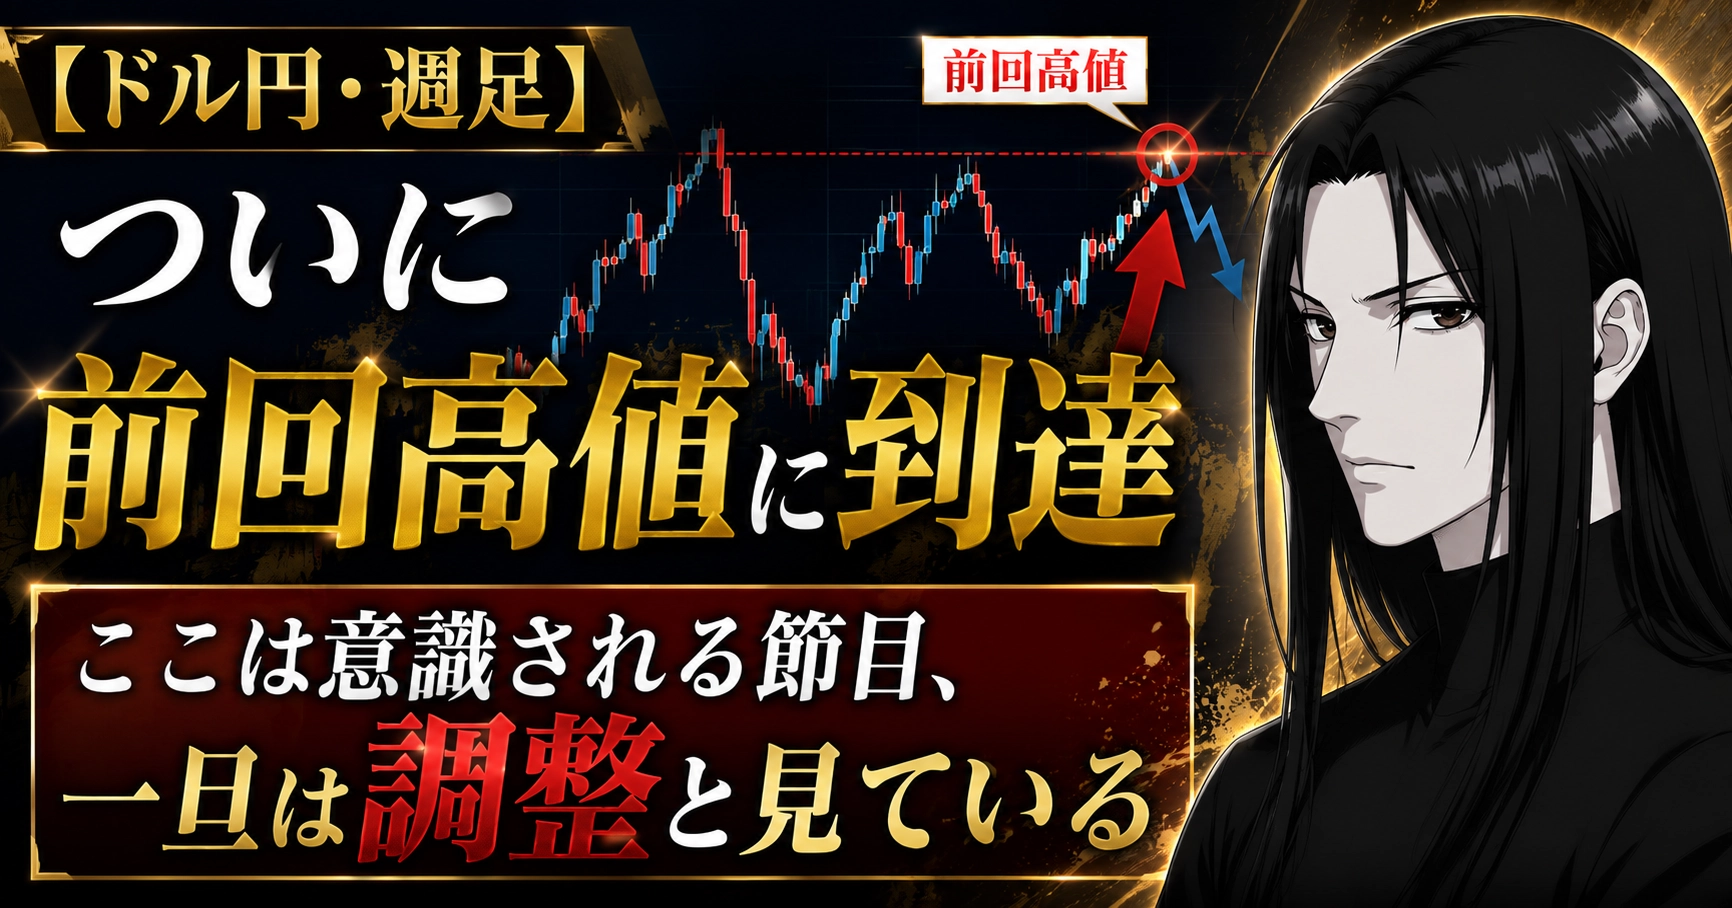
[Dollar/Yen - Weekly] Finally reached the previous high|This is a psychological milestone; for now, considered a pullback
↓Don't miss it↓
https://www.gogojungle.co.jp/finance/navi/articles/118932
The USD/JPY has finally come this far.
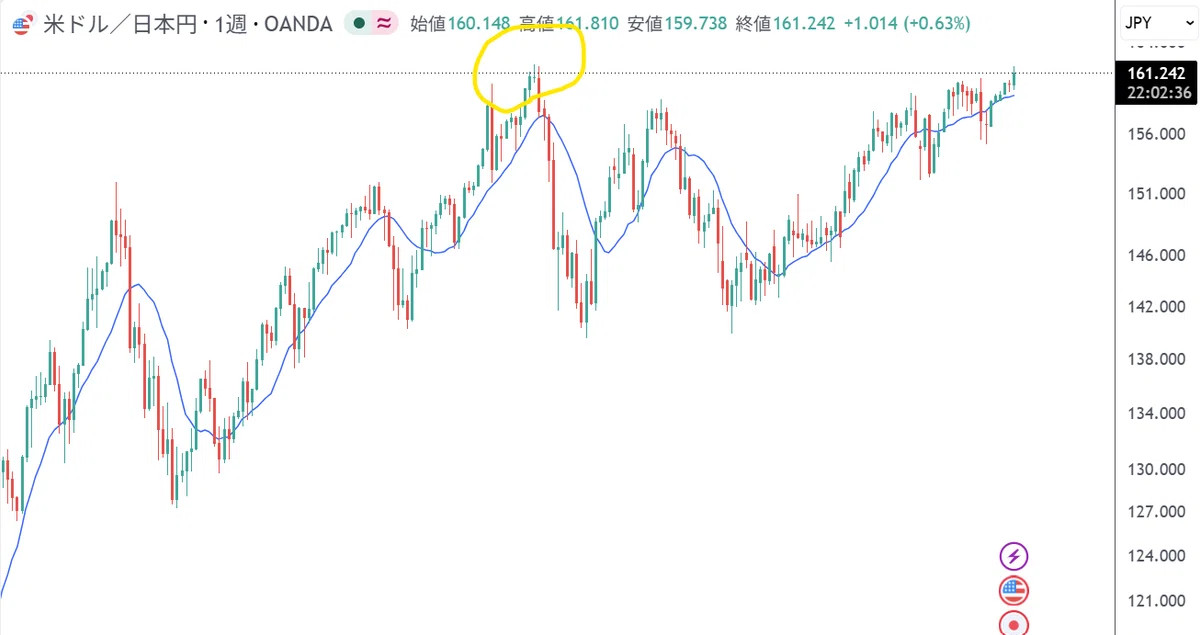
I want you to look at it on a weekly chart. The price has retraced just below the ceiling around the 161.8 level from the previous high.
Some people may think, "Will it break through like this?"
But I see a level here where it should pause for a moment. I will write it out from the larger weekly perspective.
The previous high is the most watched turning point
In a chart, where is the price that people watch the most? It is the "previous high/low" that was set.
This time, the area near 161.8 is exactly the previous high. Many traders view this as a "resistance on the upside."
When it reaches such levels, what happens?
・Sellers take profit or enter short positions
・Buyers also become cautious, thinking, "Surely it will pause here once."
As a result, the upside becomes heavy, and a pullback or consolidation tends to occur. This has been repeated in past markets.
Even if it breaks, it won't happen in one go
"Then, it won't break higher after all?" That’s not what I’m saying.
From a longer-term view, there is a possibility of moving above the previous high. But I believe it won't break in a single move.
It’s such a clearly watched turning point. It will first rebound, then consolidate, then try again—only after that will it break through.
Therefore, jumping in now with a "breakout" is too early. There is a high risk of being stopped out by one bounce.
Honestly, around here would feel like a ceiling
From here, I’ll speak frankly.
In my market view, I think the most beautiful scenario is that the previous high acts as the ceiling, and from there a significant reversal occurs—this would be ideal.
Considering the overarching yen-strength view I’ve written about many times, I’d expect a double-top-like shape forming a ceiling, followed by a genuine drop from there.
If that happens, honestly, it would be a satisfying chart.
Of course, there is no such thing as an absolute in markets. But the most beautiful scenario, in my view, is a major turning point here.
Current strategy
・Do not jump on a breakout near the previous high
・First, wait for a pullback (correction) to occur
・Look for signs that indicate a turning point after hitting the ceiling
・Even if it breaks higher, assume it won’t be in one move, and do not chase
・When the direction isn’t clear, don’t force a position
Panic buying at turning points erodes the most. Weekly-chart-level turning points deserve a patient approach.
【I need nothing else but this】
▼ KURAMA Complete Set (¥64,800) Two indicators +教材+personal coaching+videos. The strongest set with everything a trader needs
https://www.gogojungle.co.jp/tools/rooms/78023?via=users_products

【Highly popular indicator value set】
▼ GOLD × USD/JPY Complete Set (¥39,800) KGS (Gold-only) + KUS (USD/JPY-only) +教材 + personal coaching + video教材 → Across two currencies, don't miss opportunities from morning till night
https://www.gogojungle.co.jp/tools/ebooks/77857?via=users_products

▼ GOLD Complete Master Set (¥39,800) KGS (Scalping/Daily) + GOLD SWING (Swing) → Covers M5 to H4. On busy days swing, when you have time scalping
https://www.gogojungle.co.jp/tools/ebooks/80024?via=users_products