
NK225 Futures MTF Dow Theory 4-Scenario Analysis Report 2026-06-19 (for the day session)
N225 Futures MTF Dow Theory Analysis Report
Date and Time: June 19, 2026 06:02 JST / Night Session
Current Value: 72,000 JPY
Subject: For Intraday Session
Conclusion
In conclusion, the night session moved higher from the 71,000s to reach a new high of 72,220 and closed at 72,000. The 4H and 1H timeframes maintain an uptrend and an advancing wave, while the 15m chart shows a mild pullback (downward wave) from the 72,220 ceiling to cool off. The current level of 72,000 sits directly in front of the highest open interest (OI) call wall, with light resistance (pin/profit-taking selling) near the front. However, in a strong uptrend, dealers are presumed to be short gamma, and a clear breakout above 72,000 on a closing basis would likely accelerate upward (72,250 → 75,000) due to gamma squeeze. During the day session, the basic strategy is to buy on dips and chase breakouts; a close above 72,000 signals upside continuation, with potential rebounds in the dip zones of 71,620–71,000 and 70,140–69,800. On the downside, the puts’ long gamma tends to provide support, making sharp declines less likely.
A rebound while holding 71,620 and a breakout above 72,220 (72,000 close) would signal upside continuation; if 72,000 closes above, a breakout-long strategy could target 72,250→75,000. Dip-entry zones are 71,620–71,000 (shallow) and 70,140–69,800 (deep). If 69,800 is breached on a 15m close, the broader correction could push toward 68,870. The 72,000 call wall is a formidable obstacle, so protect long entries with MFE as soon as possible until breakout is confirmed.
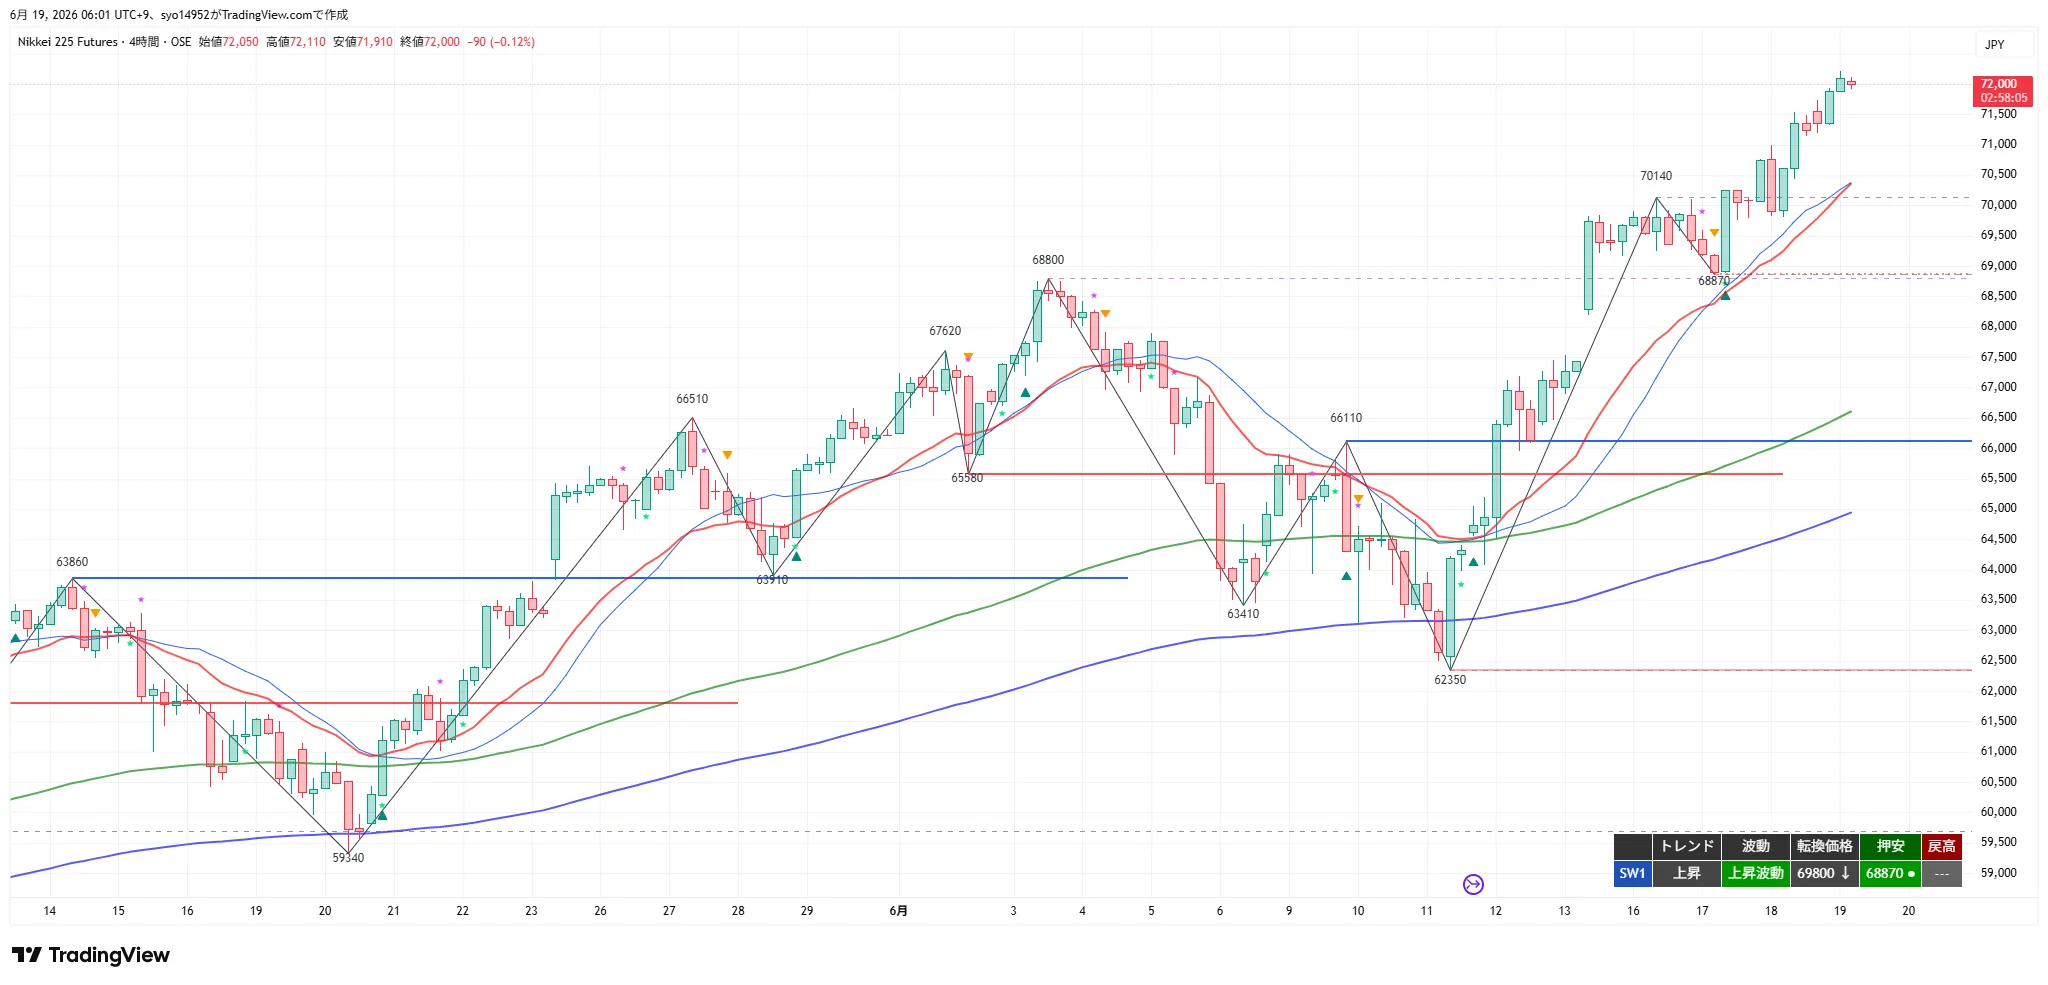
4H Analysis
The 4H timeframe continues the uptrend and upward movement, making a new high at 72,110 and closing at 72,000. The 20 EMA and 20 SMA are rising; price sits well above the 120 EMA (equivalent to the daily 20 EMA around 66,500) and 200 EMA (psychological level), signaling a strong bullish shift.
Key resistance is open-ended up to 72,220 (night high) and above that the next levels are 72,250 (OI wall) and, if closed through, a squeeze toward 75,000. On the downside, 71,620 (1H/15m support) and 71,000 (support-turned) are key, with 70,140–69,800 (previous highs / 1H/4H turn) and 68,870 (4H support) below, and 66,110 (support turn) and eventually 62,350. As long as 62,350 holds, the broader trend remains up, but be mindful of the heating near the 72,000 call wall.
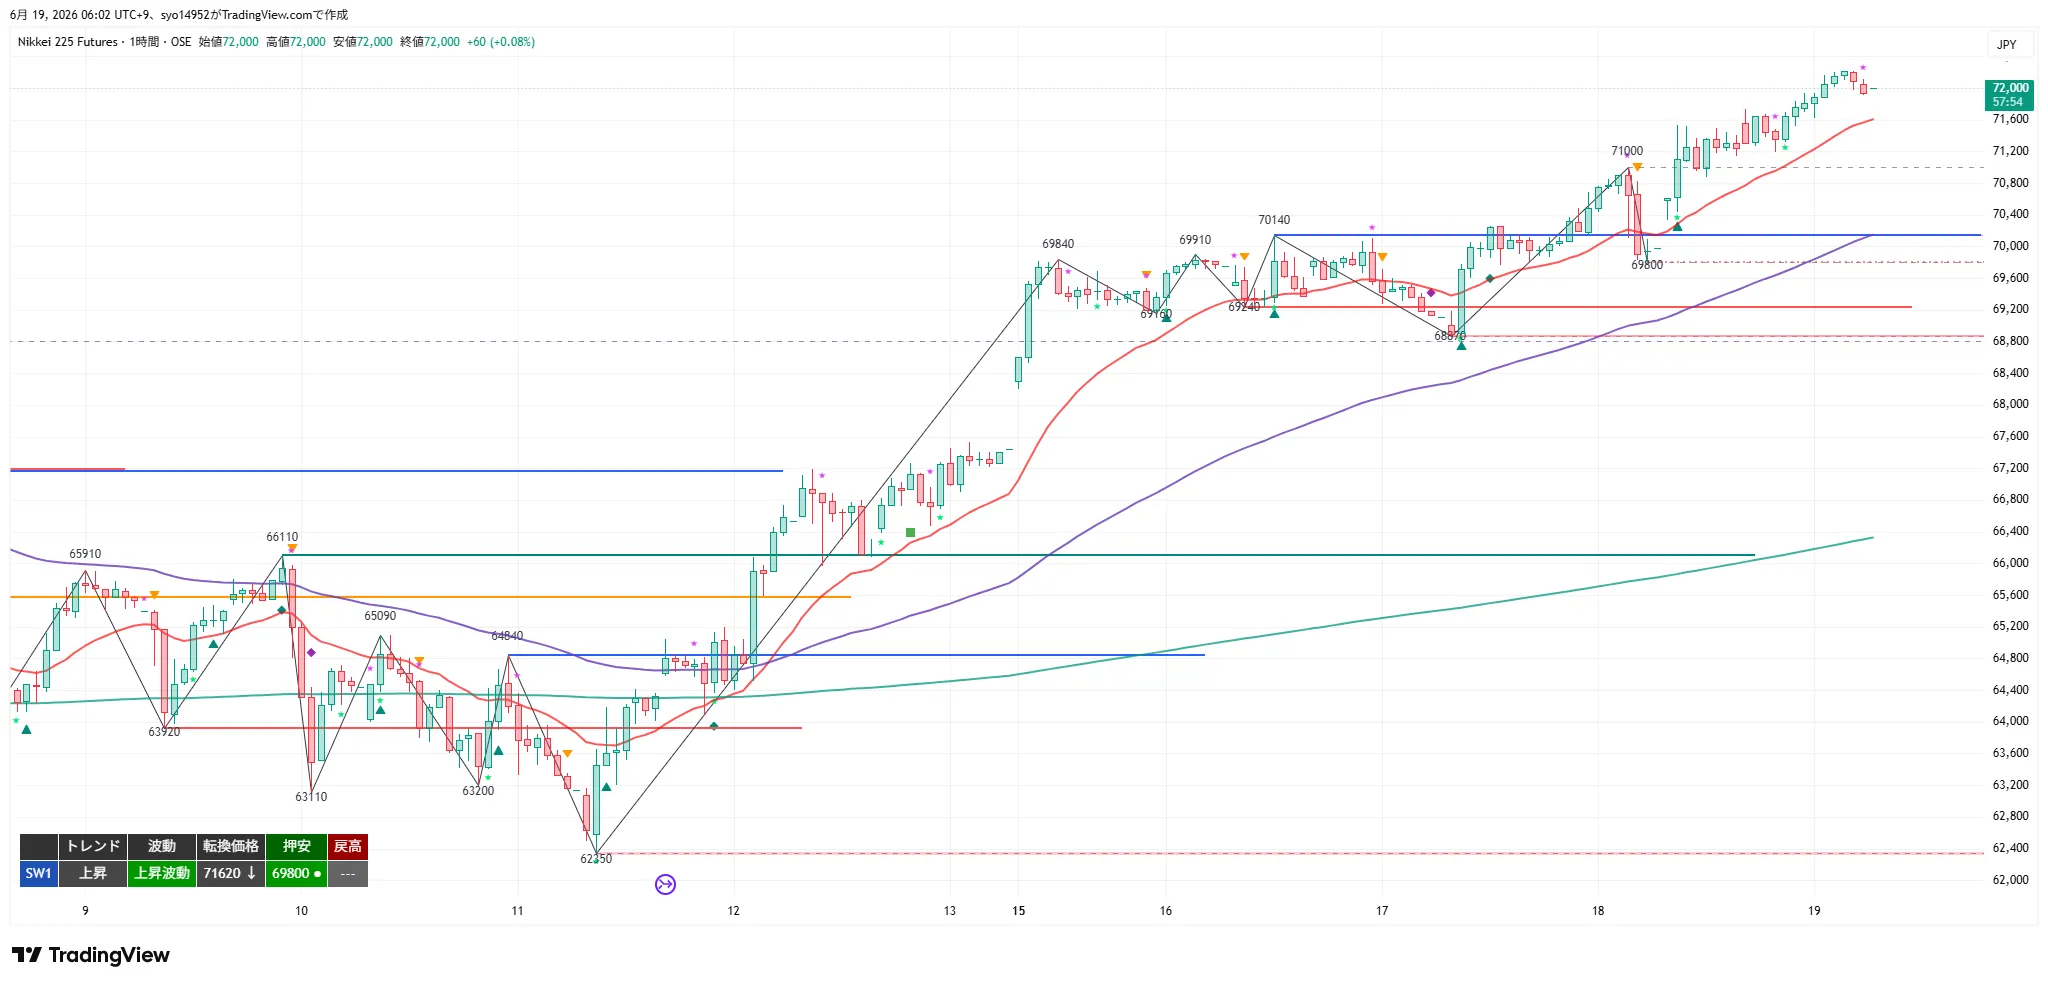
1H Analysis
The 1H timeframe maintains an uptrend and rising wave. The latest pullback low is 69,800, with a reversal at 71,620. The 20 EMA, 80 EMA (equivalent to 4H 20 EMA), and 480 EMA (daily 20 EMA) are all rising, and price sits above them.
Expect continued upside with dips to 71,620–71,000; if 69,800 closes below, it would be an early sign of a breakdown in the upward wave, and a break below 68,870 would warn of deeper adjustments. If 72,000 closes above on a 1H basis, a squeeze-driven chase of new highs could occur.
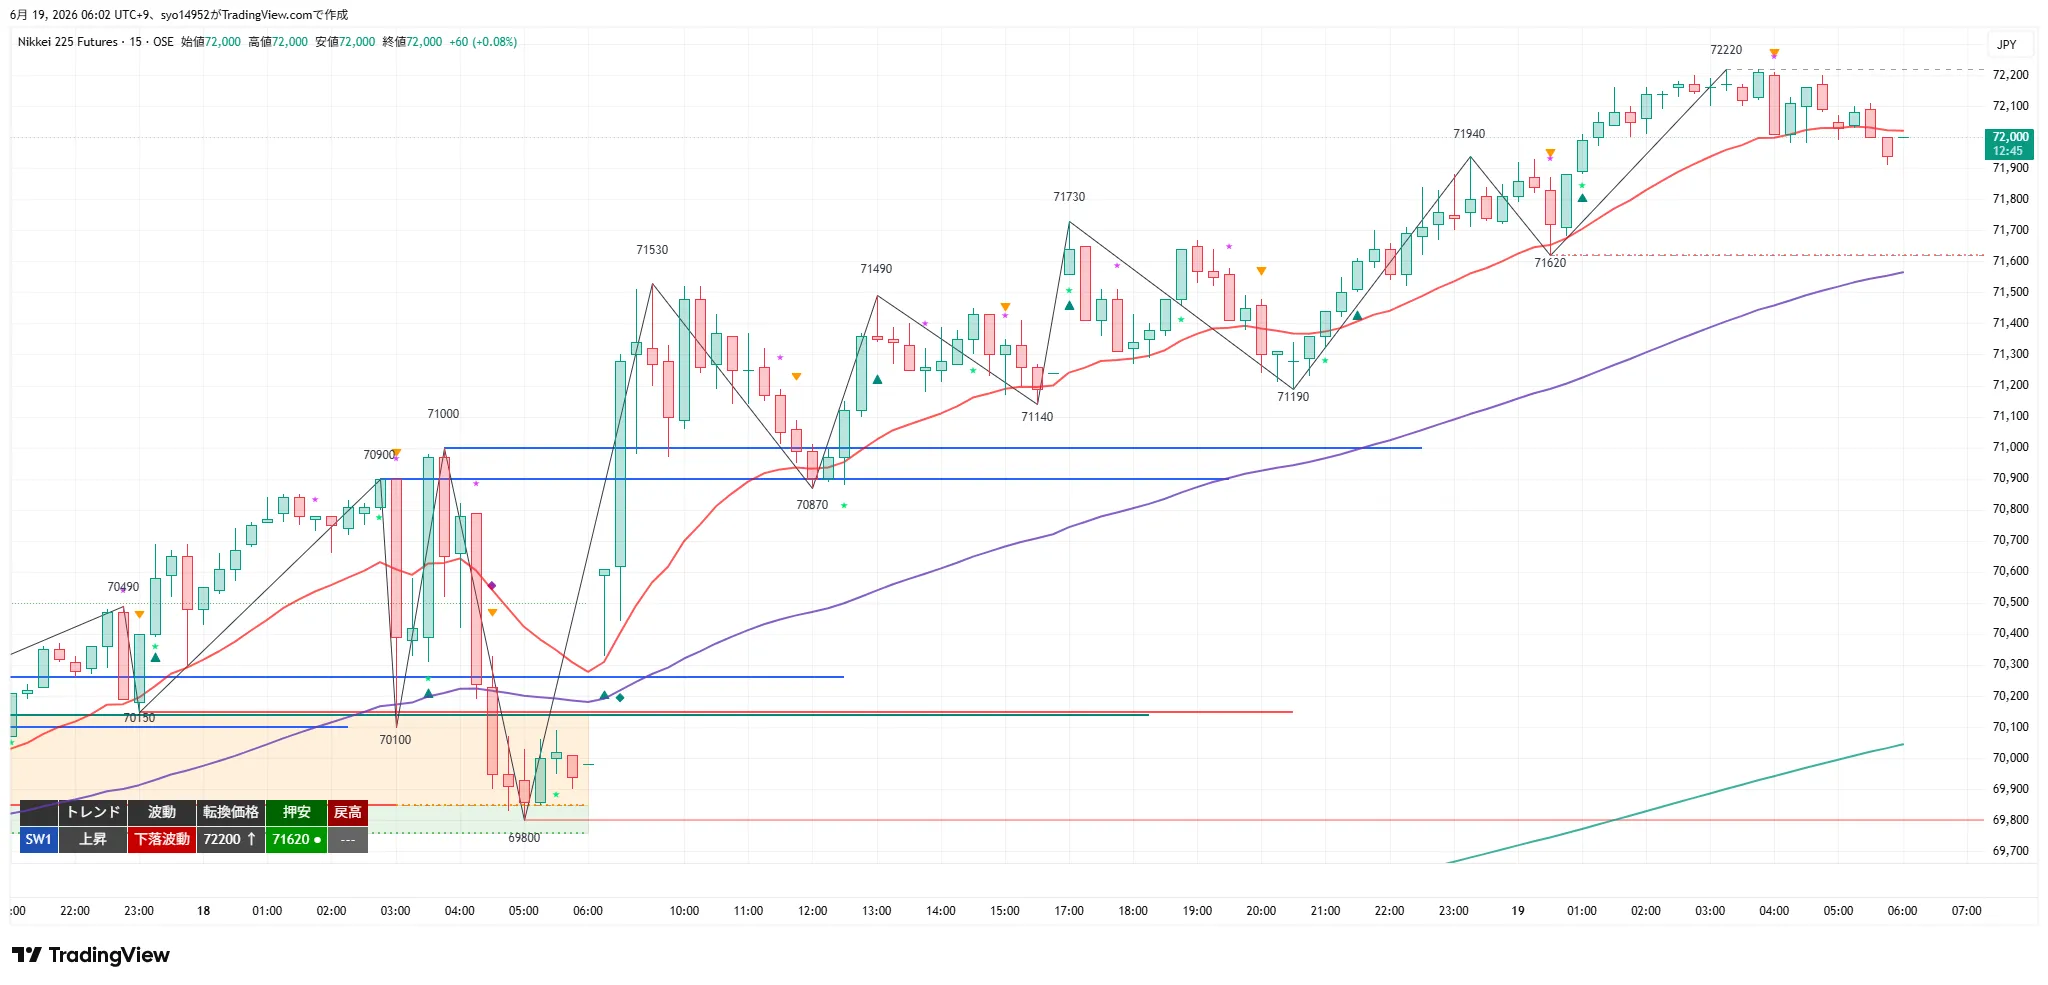
15m Analysis
The 15m chart shows an uptrend but is currently in a downward-moving phase (turning point at 72,200, dip low at 71,620, high at 72,220). After peaking at 72,220, there is a slight pullback. The 20 EMA is flat, while the 80 EMA (1H 20 EMA) and 320 EMA (4H 20 EMA) are rising and price sits above them.
In the near term, support holds at 71,620, with a return above 72,200 (15m close) resuming the uptrend and a close above 72,220 signaling a new high. If 71,620 closes beneath, risk of deeper pullback toward 71,000 increases. Since the 20 EMA is flat, avoid premature counter-trend moves.
MTF Status
- 4H: Uptrend / Upward movement. New high at 72,110 and close at 72,000. 20 EMA/20 SMA rising. Turn at 69,800; pullback low at 68,870; high return...
- 1H: Uptrend / Upward movement. From 71,620 to 72,000, closing at 72,000. Turn 71,620; pullback support 69,800. All MAs rising and price above them.
- 15m: Uptrend / Downward movement. Turn at 72,200; pullback low 71,620; return high 72,220. After 72,220 ceiling, slight pullback. 20 EMA flat; 80/320 EMAs rising.
- Consistency: 4H and 1H show uptrends and rising waves, while 15m shows a downward wave (cooling near the high). Prioritize higher timeframes for entries; however, if 15m shows downward movement, a close above 72,200 may re-enter an uptrend or wait for a dip zone confirmation before entering long. For reversals, wait for higher-timeframe uptrend signals. Profit-taking should be limited in aiming at higher-timeframe uptrends.
OI (Open Interest) / Positions Balance / Mid-Term Target as of June 18 Confirmed
Open interest in Nikkei 225 options (July and September maturities) indicates the mid-term target and weight at risk. Not for short-term triggers; used as a secondary reference for medium-term targets and key levels.
- Upper call wall =72,000(July OI 5,956; September also at most 1,781) = mid-term upper price target.Front-side shows light resistance (pins and profit-taking); however, a close above 72,000 could accelerate higher due to gamma squeeze (to 72,250→75,000).In a strong uptrend, dealers are presumed to be short gamma (GEX sign is an inference, amplified near July SQ).
- Downside = PCR (OI) 1.64 with stronger put gamma support, making sharp declines less likely.
- Max Pain = 65,000 (July) / 58,000 (Sept) = mid-term center of gravity.
Important Prices
- 72,250 JPY: OI call wall (next upside target). Potential to be reached after closing above 72,000.
- 72,220 JPY: Night high / latest high. A breakout above this level invites new highs.
- 72,200 JPY: 15m turning point. Short-term ceiling for upside pullbacks.
- 72,000 JPY: Current price / night close. Wall of maximum OI among calls.
- 71,620 JPY: 1H/15m pullback low. Lower bound of the shallow pullback zone; short-term turning point.
- 71,000 JPY: Milestone / support-turned. Upper bound of the deeper pullback zone.
- 70,140 / 69,800 JPY: Previous highs (support-turned) / 1H/4H turning points; lower bound of the deep pullback zone; the most important support.
- 68,870 JPY: 4H pullback low (recent structural support). Final candidate for deep pullback.
- 66,110 JPY: 4H former return high = support-turned. Medium-term support.
- 62,350 JPY: 4H/1H pullback lows (structural lows). Critical downside support.
Trade Ideas
① Breakout Following Long
- Trigger: Break above 72,220 (night high) with a 15m close (new high). Ancillary: close above 72,200 (15m turning point) to re-enter rising wave.
- Premise: After breakout, expect pullbacks near break price or near a sloped 20MA in lower timeframes as a lead entry (back-entry, break-price basis).
- Positioning: Reclaim 72,220 with a 1H close and clearly break 72,000.
- Stop / invalid: If the initial leg breaks below 71,620 or the main leg falls below 71,000.
- Targets: 72,250 (partial profit-taking + cost basis), 75,000 (mid-term target when break above 72,000 closes and gamma squeeze accelerates).
- RR: T1 ≈ cost basis at 72,250; T2 = 75,000; reward-to-risk about 4.6. Focus on main position after closing above 72,000 and confirm squeeze; otherwise pursue T2 as the longer-term target.
- MFE Protection: Exit or take partial profits at +200; secure at least +100 with +300; due to the call wall, implement early protection before breakout is confirmed.
② Dip Buying (Long)
- Standard conditions: Zone 1 (shallow pullback) = 71,620–71,000 (1H/15m pullback lows → support turn), Zone 2 (deep pullback) = 70,140–69,800 (previous highs / 1H/4H turn → pullback lows). Confirm rebound with 15m close; if deeper, 68,870.
- Positioning: Reclaim 72,200 with 1H close.
- Stop / invalid: Initial leg fail below Zone 1 70,900 or Zone 2 69,700; main leg below 69,800. Full exit below 68,870.
- Targets: 72,220 (partial profit + cost basis), 72,250–75,000 (if breakout above 72,000 occurs and swing is observed).
- RR: Zone 1 T1=5.6 / T2=5.8; Zone 2 T1=11.6.
- MFE Protection: Exit or take some profits at +200; secure at least +100 with +300; downside is well-supported by put gamma, but since price is near high zone, prioritize shallow pullbacks and early protection. Do not chase far into the rally before trigger confirmation.
③ Sell the Retracements (Short)
- Standard: Break below 71,620 (1H/15m pullback low) and then pullback zones: Zone 1 = 71,620–72,000, Zone 2 = 72,200–72,220, with a flush out confirmed by 15m close (restricted to pullbacks).
- Positioning: Break below 71,000 on 1H close.
- Stop / invalid: Initial leg recovers to 72,030 (Zone 1) or 72,250 (Zone 2); main leg recovers above 72,220. Strong invalidation occurs at 72,220 (night high recovery).
- Targets: 71,000 (partial profit + cost basis), 70,140–69,800.
- RR: Zone 1 T1=3.5 / T2=7.2.
- MFE Protection: Exit or take partial profits at +200; secure at least +100 with +300. Given 4H/1H are still rising and highs are being updated, and downside is well-supported by put gamma, focus on restricted pullbacks and avoid deep chasing. If trigger has already reached T1, skip entering further.
④ Breakout Following Short
- Trigger: Break below 69,800 (1H/4H turning point / support low) with a 15m close (break in the upward wave).
- Premise: After a break, assess return near break price or near a sloped 20MA using short timeframes (back-entry, break-price basis).
- Positioning: Break below 68,870 on 1H close.
- Stop / invalid: Initial leg recovers to 70,110; main leg recovers to 71,000. Full exit at 72,000.
- Targets: 68,200 (partial profit + cost basis), 66,110 (support turn + mid-term support band).
- RR: T1 = 5.2 / T2 = 11.9.
- MFE Protection: Exit or take partial profits at +200; secure at least +100 with +300. With 4H/1H rising and highs being updated, and downside well-supported by put gamma, refrain from deep chasing until 69,800 breach is avoided; be cautious of false breakouts and sharp reversals from the new-high territory.
Current Actions
- Most important line 1: 71,620 JPY. Maintain and look for rebound to continue dip-buying (trend-following). If 15m close below, anticipate a correction toward 71,000 → 70,140 → 69,800.
- Most important line 2: 72,000–72,220 JPY. A wall initially; however, a clear close above 72,000 could trigger breakout dynamics with gamma squeeze to the upside (72,250→75,000). Protect long entries with MFE ahead of confirmed breakout.
Entry prices, triggers, and stop levels are set based on the chart patterns at the time of close (turning prices, pullback lows, and swing highs of each timeframe). If the structure evolves over time, unless higher-timeframe structure changes, adjust entry prices based on the turning prices of lower timeframes (e.g., a short-term timeframe entering a lower-phase downtrend and then turning to an uptrend) to align more closely with actual conditions. The suggested zones for dip-buying (②) and pullback-selling (③) are two ranges (shallow and deep). In highly liquid intraday periods, triggers may occur slightly before touching the zone; in such cases, confirmation of rebound/slowdown near the zone on a 15m close is considered a trigger (avoid entering far from the zone). The OI targets are tied to maturity and used as a mid-term reference; 72,000 is supported by the front side and may squeeze above on a close, while downside is supported by put gamma; short-term triggers are judged by each timeframe's structure.
This report is for information purposes only and does not constitute trading advice; investment decisions are your responsibility.