NK225 Futures MTF Dow Theory: 4 Scenario Analysis Report for the Intraday Session (Sunday-Monday) 2026-06-18
NK225 Futures MTF Dow Theory Analysis Report
1. Trend Table
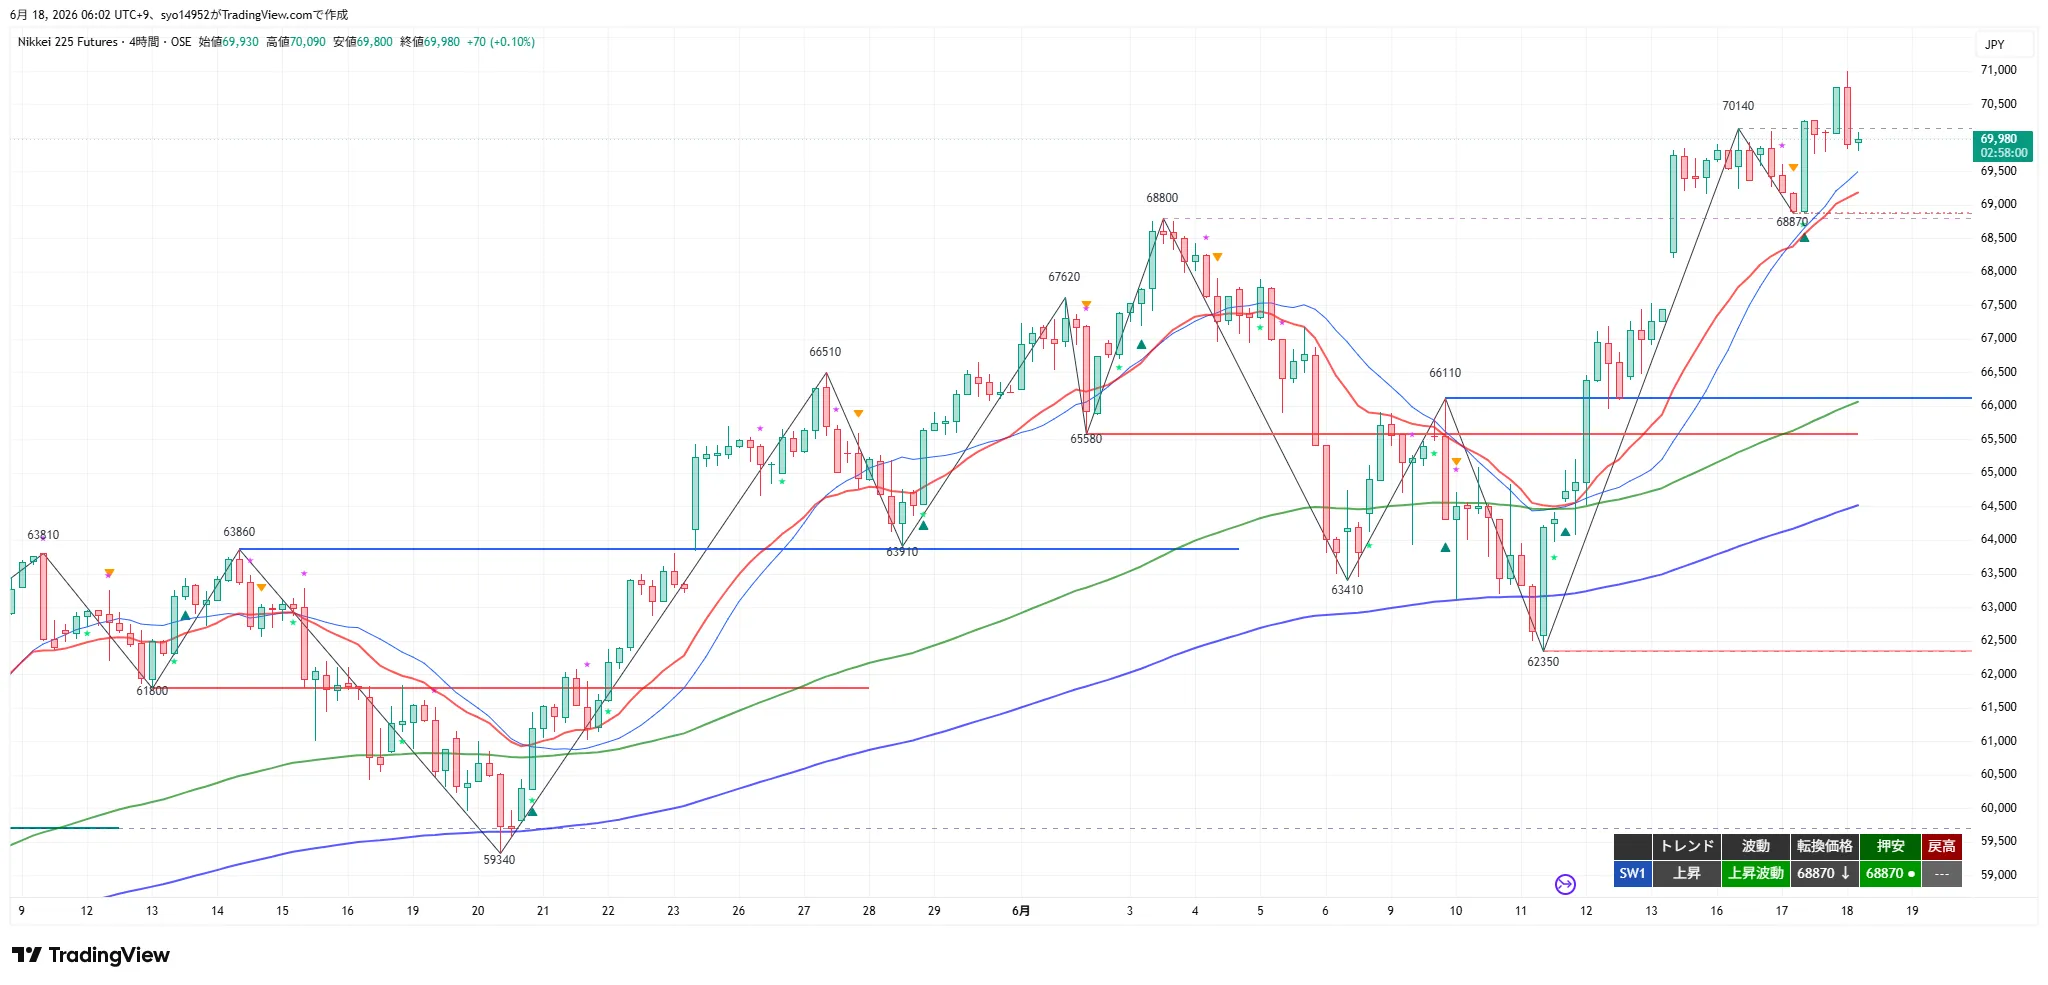
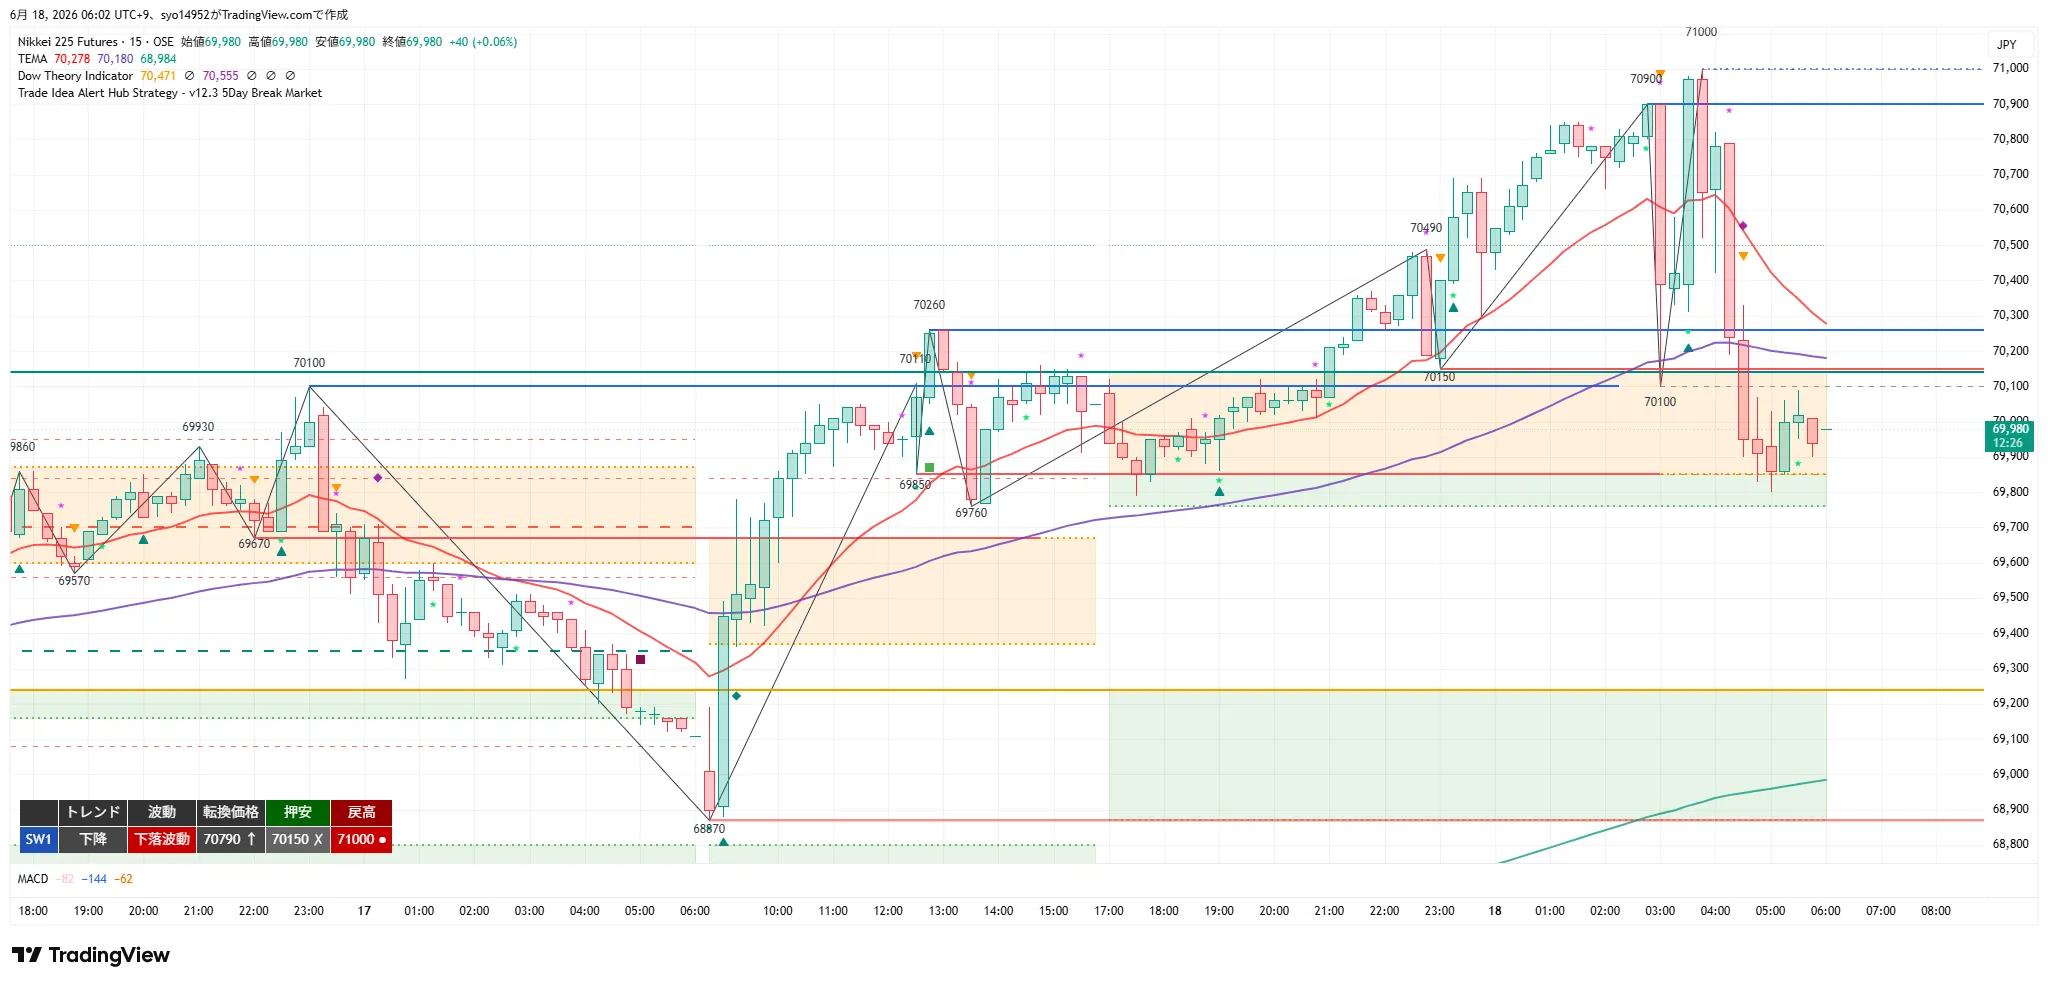
Upward / Upward Wave. Transition price 68,870, Support low 68,870, Return high ---. After breaking above 70,140, price extended higher, reaching a new high of 71,000, then retraced to close at 69,980 (4H candle +0.10%, high 70,090, low 69,800). 20EMA/20SMA rising, price well above 120EMA (roughly 65,800 on the daily) and 200EMA (psychological level).
Range / Downward Trend. Transition price 71,000, Support low 68,870, Return high ---. After a top near 71,000, price fell into a downward trend, closing at 69,980. 20EMA turning from rising to flat, 80EMA (4H 20EMA equivalent) and 480EMA (daily 20EMA equivalent) rising, with price located above them.
Downward / Downward Wave. Transition price 70,790, Support low 69,150, Return high 71,000. After hitting 71,000, it pulled back and entered a downward wave, closing at 69,980. 20EMA and 80EMA (1H 20EMA equivalent) flat-to-downward, price around 20EMA; 320EMA (4H 20EMA equivalent) below.
2. Key Price Ranges
3. Verification of Previous Trade Ideas
Verification Target: Night Session
Cleared above 70,140 (previous high) on 15m close, rising to 71,000 new high. Break-following functioned.
Dipped to around 68,870, then reversed; after confirming 15m rising-wave regression, entered. Followed the higher-timeframe uptrend; dip-buy worked.
Sell-off after 71,000 top formed; retracement selling valid, but did not reach T1 (stopped near break-even / partial exit). As a contrarian against 4H uptrend, limited retracement result.
Did not reach a genuine trigger for downside break.
4. 4H Analysis
4H continues an uptrend and rising wave, breaking above 70,140 and reaching new high of 71,000 before retracing to 69,980. 20EMA/20SMA rising; price well above 120EMA (daily equivalent ~65,800) and 200EMA (psychological level). New highs persist; bullish momentum remains.
Upper targets are unlimited up to 71,000 (night high). Mid-term upside target via OI is 72,000. Downside supports include 69,150 (15m support), 68,870 (4H/1H support), 68,200 (4H20EMA), 66,110 (old retrace high turning into support; mid-term support coinciding with 65,000). If 62,350 breaks, the downtrend resumes; as long as 62,350 holds, the overall trend is higher, but watch for overbought conditions near highs.
5. 1H Analysis
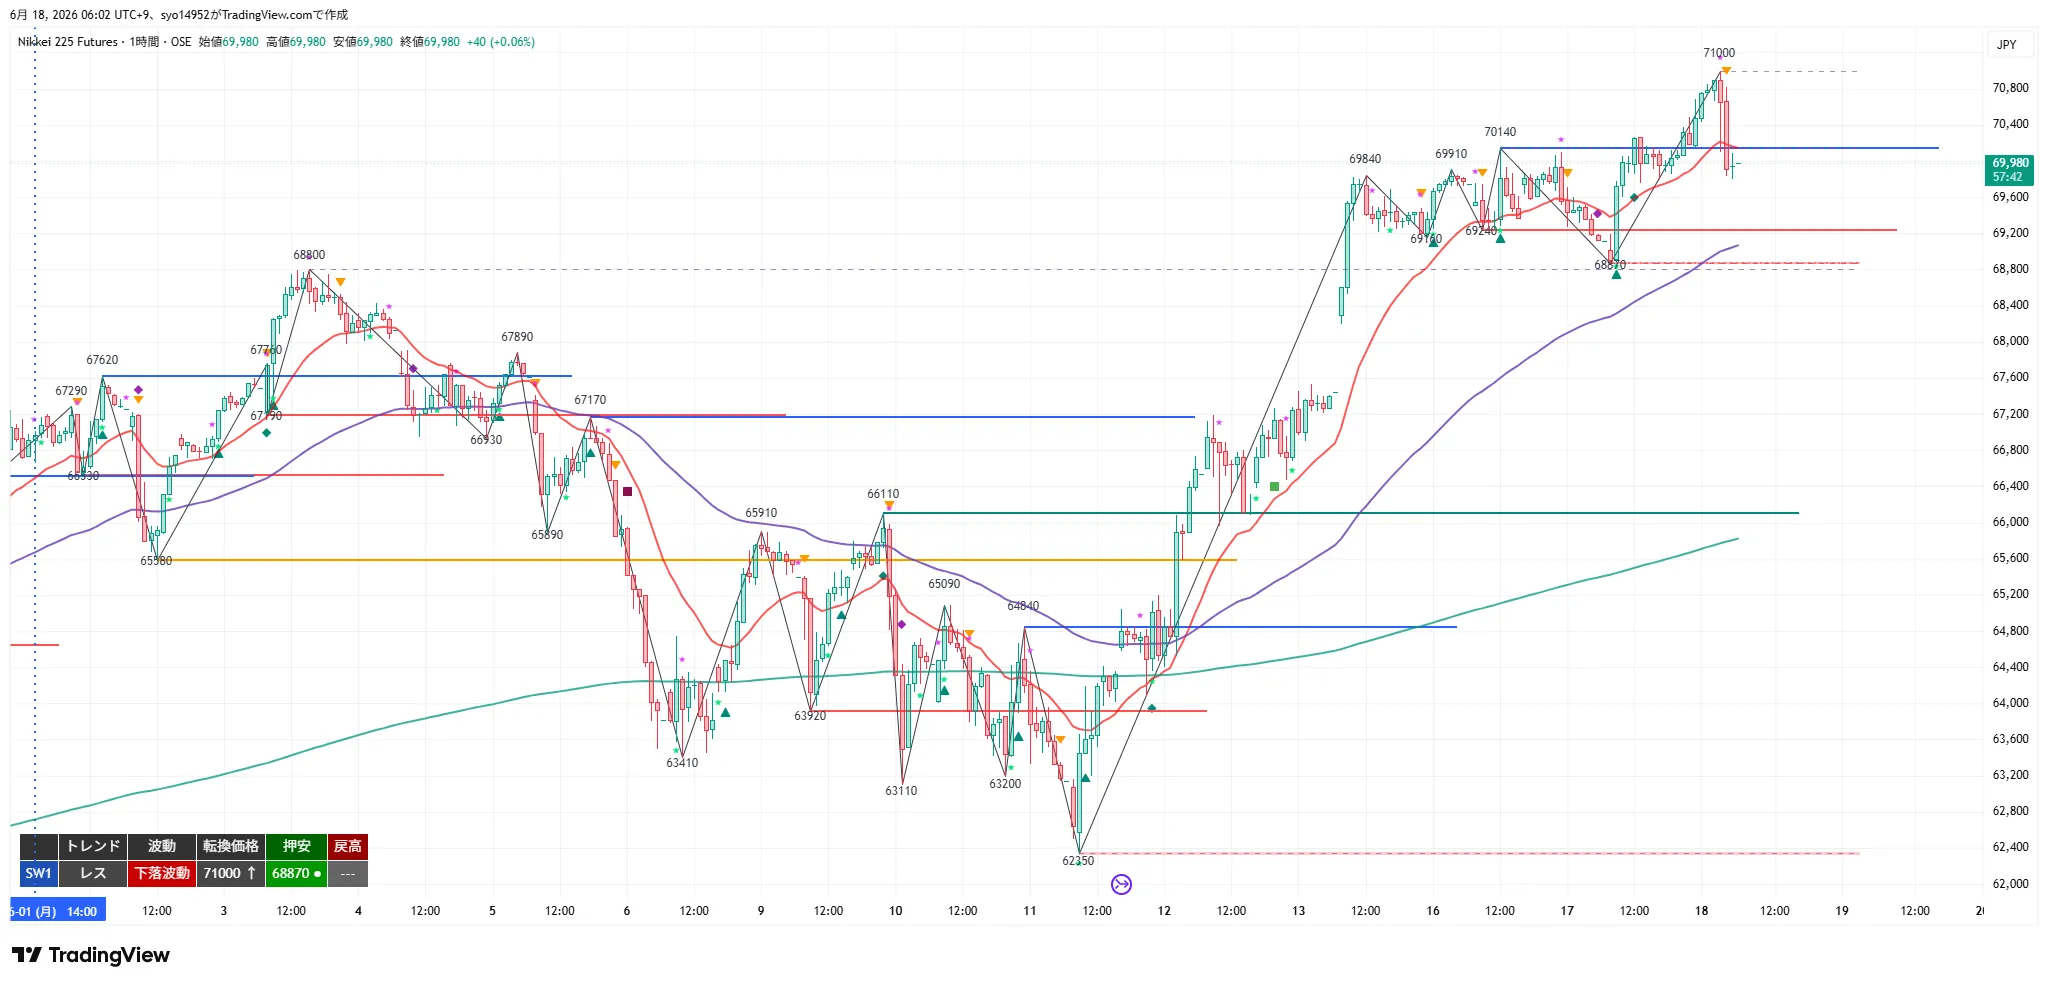
1H trended into a range and then entered a down-wave (downward Wave). Most recent support low is 68,870; 71,000 is the recent high (transition). 20EMA flat, with 80EMA (4H 20EMA equivalent) and 480EMA (daily 20EMA equivalent) rising and price above them.
If 69,150–68,870 holds and rebounds, dip-buying continues. If 68,870 closes below on a 1H close, beware of a deterioration in the uptrend. If 71,000 closes above on a 1H close, move back into an upwave and seek new highs.
6. 15m Analysis
15m shows a downtrend/downward wave (transition 70,790, support 69,150, high 71,000). After new high at 71,000, retraced into a downward wave; 20EMA and 80EMA (1H 20EMA equivalent) flat-to-downward, 320EMA (4H 20EMA equivalent) below.
In the short term, 69,150 supports the downside; breaking above 70,790 on a 15m close would re-enter an up-wave (dip-buy). Close above 71,000 would mark new highs. If 69,150 closes below on a 15m close, the downtrend deepens toward 68,870 and 68,200. Since 20EMA is flat, avoid premature counter-trend entries.
7. Conclusion
In summary, the night session broke above 70,140 to make 71,000 but retraced to close at 69,980. The 4H remains in an uptrend and rising wave, but the 1H is range-bound/downward and the 15m is down/upward; a short-term pullback from the 71,000 ceiling is underway. In the day session, base dip-buying on the 4H uptrend is preferred, waiting for the 15m rising-wave regression (break above 70,790 close) to enter on the long side, with a breakout above 71,000 to ride higher. If 69,150 is breached on a 15m close, expect a deeper short-term pullback toward 68,870 and 68,200. The mid-term upside target is 72,000, with mid-term supports at 65,000 and a center of gravity around 64,000. While upside remains possible, buying is near overbought levels; protect with MFE early.
Dip-buying around 69,150 (15m support) with a close above 70,790 on 15m to confirm rising wave; breakout above 71,000 to ride the up-move and target 72,000 as mid-term. If 69,150 fails on a 15m close, monitor for 68,870 → 68,200. 4H shows continued high-price updates, so selling into rallies should be limited to retracement trades; avoid chasing deep into the upper levels.
In terms of consistency, 4H remains in an uptrend and rising wave, while the lower timeframes show a range and downward waves; the high timeframe (4H) takes precedence, and dip-buying is the main approach, with 15m downward pressure requiring confirmation of rising-wave regression above 70,790 close before entering on the long side. Retracement selling should be limited to a break above the higher timeframe trend and not chased deeply.
8. Trade Ideas
- Trigger: Break above 71,000 (night high / 1H transition) with a 15m close (new high).
- Premise: After the break, pullbacks toward breakout price vicinity or a tilt toward the 20MA vicinity (watch for dip-buy) using short-timeframes. Back-entry around 71,000 vicinity, breakout price basis.
- Confirmation: Price recovers above 71,000 on a 1H close.
- Stop/Invalidation: Break-even point around 70,690; price below 70,140 invalidates.
- Targets: 71,500 (partial take + break-even) and 72,000 (mid-term OI upside target).
- Reward/Risk: Based on 71,000 breakout + 70,690 LC; T1 71,500 (+500) = RR 1.6; T2 72,000 (+1,000) = RR 3.2. With thick OI near 72,000, place T2 as the primary reward.
- MFE protection: exit at +200 for break-even or small profit, or trail at +300 for at least +100; protect early due to unbounded risk and overheating. If the trigger is already reached at a confirming candle, skip the trade.
- Standard: Rebound from 69,150 (15m support) confirmed by 15m close, then break above 70,790 on 15m close to resume rising wave. Deep pullbacks at 68,870 (4H/1H support).
- Premise: Dip-buy candidates confirmed by 15m close with rising-wave regression (shallow pull to around 69,300; deep pull near 69,000). Enter above the rising 20MA.
- Confirmation: 70,790 recovers above on 1H close.
- Stop/Invalidation: Break-even around 68,950 for early pullbacks (deep pull 68,770); break-even at 68,870 for main entry. Full exit at 68,200 if broken.
- Targets: 70,790 (partial take + break-even), 71,000–72,000 (mid-term OI upside target).
- RR: Based on 69,300 entry / LC 68,950; T1 +1,490 = RR 4.3; T2 (71,000) +1,700 = RR 4.9. With 69,300 entry, target 71,000 offers strong upside.
- MFE protection: exit at +200 for break-even or small profit, or +300 for at least +100; since 15m is in a down wave, confirm rising-wave regression before entry and protect early. Avoid chasing in a declining pattern.
- Standard: Break above 70,790 (15m transition) not achieved; stalls in retracement zone between 70,490–70,790; confirm profit-taking on 15m close (limit to retracement trade).
- Premise: On retrace zone stall, confirm via 15m close (target around 70,600).
- Confirmation: Break below 69,150 on 1H close.
- Stop/Invalidation: Break-even for the early portion at 70,820 recovery; main position recovers above 71,000. Strong invalidation if 71,000 recovers.
- Targets: 69,150 (partial take + break-even), 68,870–68,200.
- RR: Based on early entry 70,600 / LC 70,820; T1 +1,450 = RR 6.6; T2 68,870 +1,730 = RR 7.9.
- MFE protection: exit at +200 for break-even or small profit, or +300 for at least +100. With 4H rising and new highs continuing, treat retracement as limited; avoid deep chasing. If trigger candle already reached T1, skip the trade.
- Trigger: Break below 69,150 (15m low) with a 15m close (deepening downward wave).Trigger: Break below 69,150 (15m support low) with a 15m close (downward wave deepening).
- Premise: After the break, pullbacks toward breakout price vicinity or tilt toward 20MA vicinity (watch for pullback selling) timed on short timeframes (back-entry around 69,150 vicinity, breakout price basis).Premise: After the break, pullbacks toward the breakout price vicinity or tilt toward the tilted 20MA vicinity (watch for pullback selling) timed on short timeframes (back-entry around 69,150 vicinity, breakout price basis).
- Confirmation: Break below 68,870 on 1H close.Confirmation: Break below 68,870 on 1H close.
- Stop/Invalidation: Early portion recovers to 69,460; main position recovers to 70,790; full exit if 71,000 recovers. Strong invalidation if 71,000 recovers (night high).Stop/Invalidation: Early portion recovers to 69,460; main position recovers to 70,790; full exit if 71,000 recovers. Strong invalidation if 71,000 recovers (night high).
- Targets: 68,200 (partial take + break-even), 66,110 (mid-term support where 65,000 aligns with OI lower support).Targets: 68,200 (partial take + break-even), 66,110 (mid-term support near 65,000 as OI supports).
- RR: Based on early 69,150 / LC 69,460; T1 68,200 +950 = RR 3.1; T2 66,110 +3,040 = RR 9.8.RR: Based on early 69,150 / LC 69,460; T1 68,200 +950 = RR 3.1; T2 66,110 +3,040 = RR 9.8.
- MFE protection: exit at +200 for break-even or small profit, or +300 for at least +100. Given 4H uptrend and rising highs, do not enter below 69,150; remain cautious for false bottoms and rapid reversals. If the breakout move to new highs is at risk, skip entry.MFE protection: exit at +200 for break-even or small profit, or +300 for at least +100. Since 4H is rising and highs continue, do not let downside extend past 69,150; avoid deep chasing; await confirmation above rising 20MA. If the trigger is confirmed and target 1 already reached, skip.
9. Current Actions
- Most Important Line 1: 69,150 JPY — 15m support low. Maintain and rebound; if 15m close above 70,790, continue dip-buying (trend-follow regression). If 15m close breaches, prepare for deeper pullback toward 68,870 → 68,200.
- Most Important Line 2: 71,000 JPY — Night high / 1H transition. If 15m close above, pursue new highs via breakout-long (OI mid-term upside target 72,000). Given overheated level near highs, accelerate MFE protection.
10. Cautions
- Entry price / trigger / stop are based on the closing chart shapes at the time (transition prices / support lows / retrace highs for each timeframe). If structures evolve over time, unless higher-term structure changes, entries should be adjusted using lower-timeframe wave transition prices (e.g., a short-term timeframe entering after a temporary downward wave turns upward) to better reflect actual conditions.
- OI represents mid-term targets and gravities tied to expirations (6/17 confirmed; July and September). Short-term triggers judged by candle closes. Mid-term upside target 72,000; near-term support around 65,000 with center ~64,000. OI-heavy strikes near structural nodes (MA bands, psychological levels) carry heavier significance. Monitor OI changes around next SQ.
- 4H is uptrend with rising highs, but 1H and 15m show 71,000 top and corresponding adjustments (downward waves). Buy only after 70,790 close above, confirm rising-wave regression, and protect with MFE early. For retracement sells (③) and break-follow shorts (④), treat as limited-reward only against ongoing uptrend; avoid chasing beyond 69,150 close; avoid premature entries above 20MA rising.
- If the trigger candle confirms and target 1 is already reached, treat entry as avoided.
11. About This Report
This report analyzes NK225 futures using Dow Theory Indicator across three timeframes: 4H / 1H / 15m, with Nikkei 225 options OI (open interest) as a supplementary layer.
Note: This report is for information purposes only and does not constitute trading advice. Investment decisions are the reader’s responsibility.