
June 18 (Thu): [BB & HM] Nikkei 225 vs 10-year U.S. Treasury yield
This time
“The Temperature of the Economy”
“U.S. 10-year Treasury yield”
compared to it.
【Overall Scenario Probability】
This week's overall market is…
“Up: 60% / Down: 40%”
※ The downward scenario for the U.S. 10-year Treasury yield to Gartley ⇧ PRZ serves as a non-correlated driver that supports the rise of the four major U.S. indices and the Nikkei 225
※ Presented as a reference level.
【This Week's Market Focus Points】
This week, the downward scenario for the U.S. 10-year Treasury yield has become clear, and the rise of the four major U.S. indices and the Nikkei 225, moving in inverse correlation, is increasingly likely to continue. The Nikkei 225 is resuming upward from a horizontal time-adjustment phase (blue Zone), with room for further gains being a factor to watch.
On the other hand, Bitcoin is being held down by a downward-moving MA, forming a bearish candle, so how each market uses the remaining upward potential is likely to be the focus this week. Also keep an eye on the timing of reaching important milestones for the U.S. 10-year yield. Detailed discussion will be in the paid section.
➥The continuation is explained in detail in the members-only report.
If you are not registered yet, please go here ↓
【Integrated Edition】
“Why does the market stop there? Bollinger Bands ✕ Harmonics — a fusion of statistics and geometry to capture market turning points with high precision!”
https://www.gogojungle.co.jp/finance/navi/series/1613?via=articles_detail_aside
【Announcement】
【YOSSY】Harmonic AutoDrawing System【?????】
Updating!!!
Will enable you to grasp all situations with alerts!
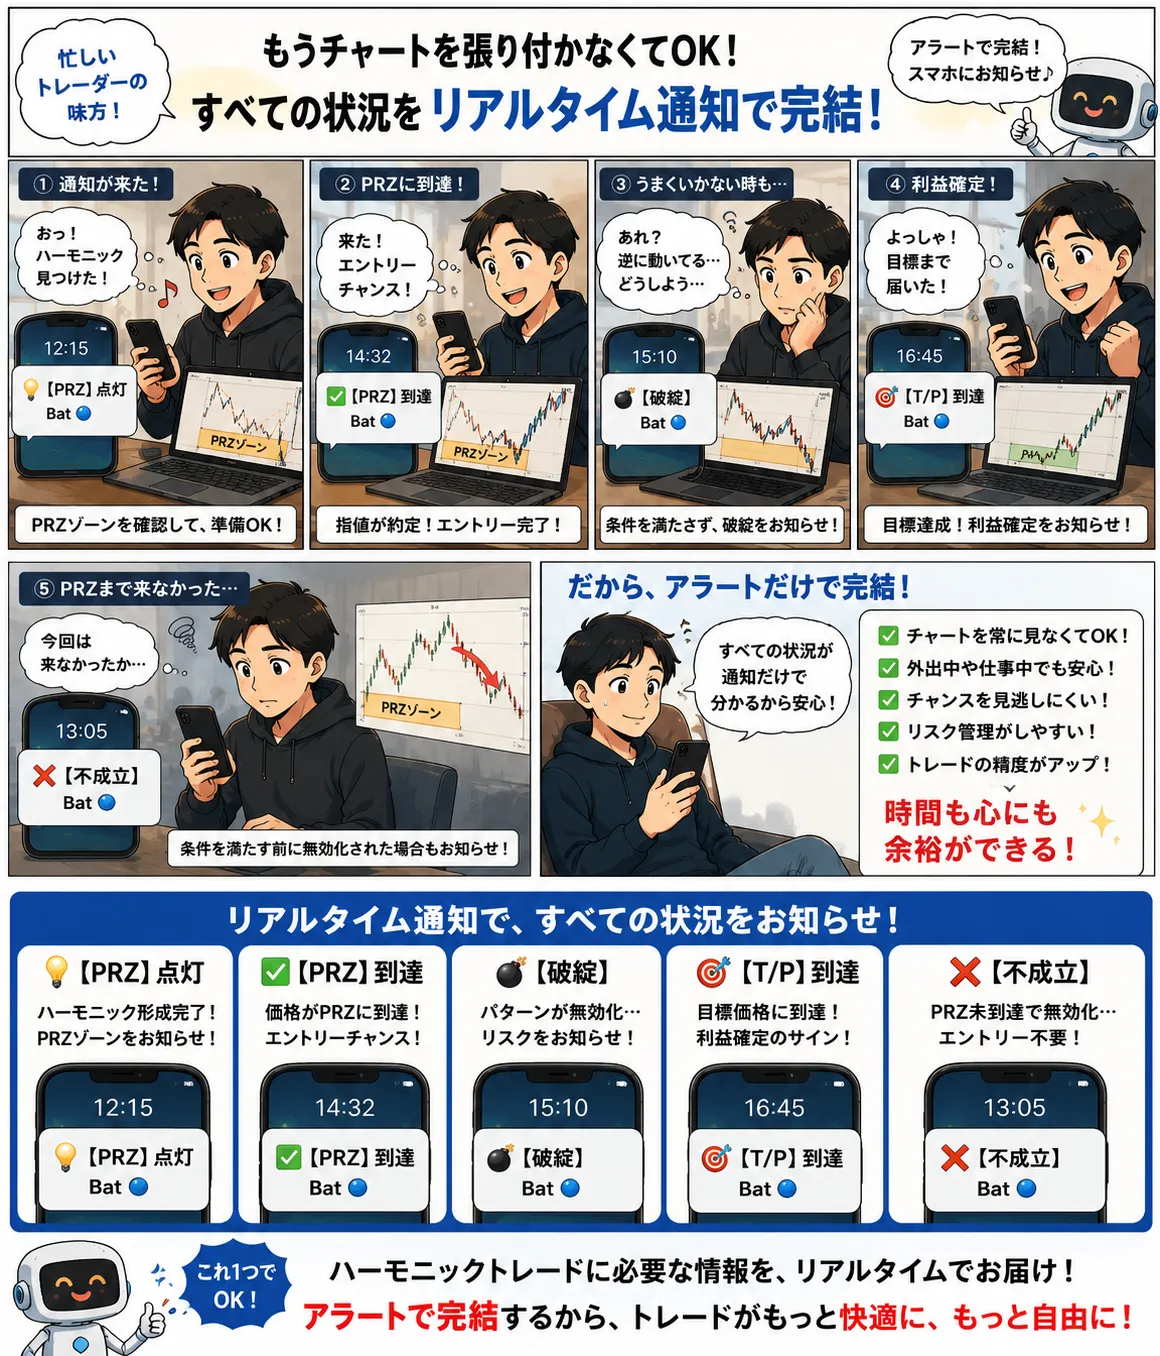
Stay tuned!
(*The following is for members only。)
--------------------------------
【Environmental Awareness】