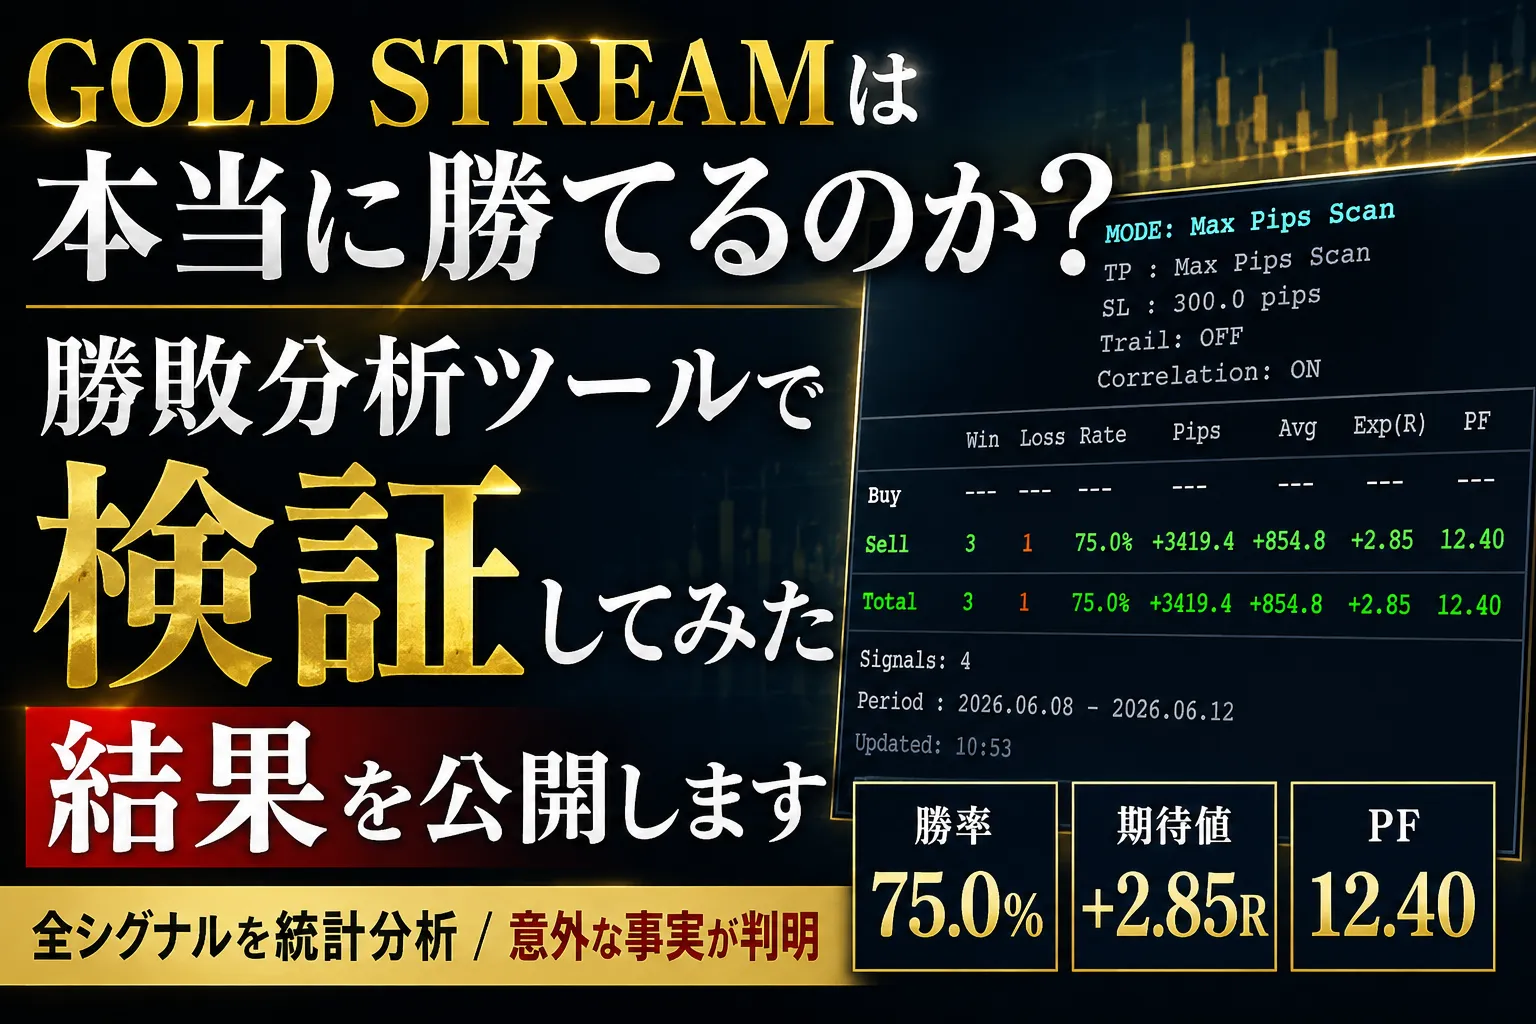
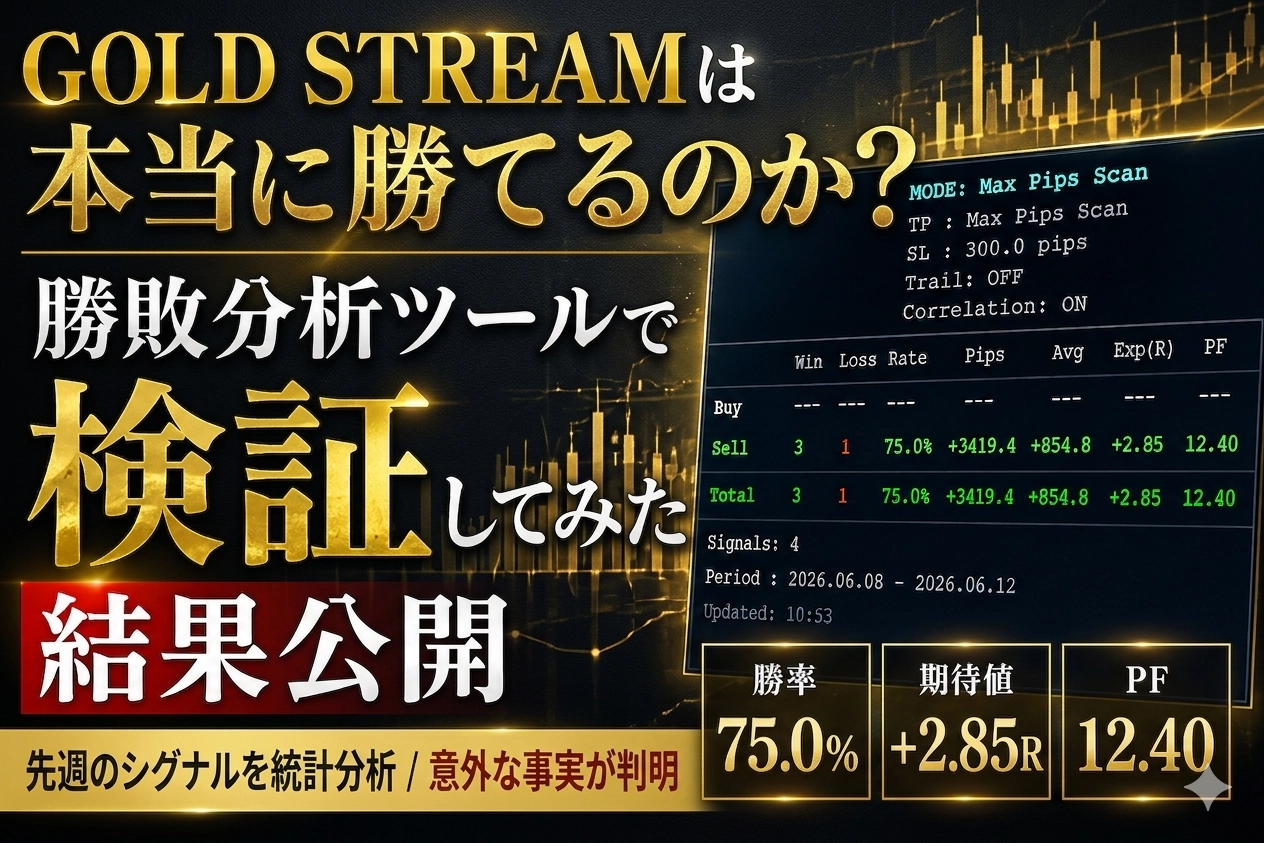
【Tool performance exposed】GOLD STREAM exclusive win/loss analysis tool verification results
●Introduction
When you’re looking at a trading tool,
one thing that will surely catch your eye are the large numbers.
If you only look at these prominently displayed numbers,
it’s natural to want to ask, “Is this true?”
Numbers can be inflated when taken out of context, so it’s only natural to doubt.
So what lies behind those numbers? How are they calculated?
In this blog, by showing the verification process itself,
we will confirm what the tool GOLD STREAM really does.
● What is GOLD STREAM:
M15 Day-Trading Specific Decision OS
GOLD STREAM is a dedicated system for short-term day trading gold (XAUUSD) that makes you "decide" without hesitation, without delay, and without wobble.
Even in volatile markets, it’s designed to enter only after aligning the rationale, supporting highly reproducible trades.
Seven strengths of GOLD STREAM
1. Fully specialized design for GOLD (XAUUSD)
A short-term day-trade logic optimized for GOLD’s unique volatility and correlation structure. It emphasizes “reliability × consistency” that generic indicators struggle with, focusing on M15 as the primary battleground.
2. Ready → Signal in a 2-stage notification
- Ready (preparation): advance notice that conditions are starting to align
- Signal (confirmation): a complete match notifying that entry decision is possible
This eliminates missed opportunities, overreactions, and haste, turning it into a habit to prepare before entering.
3. Immediate assessment of strength/weakness and correlation on one screen
Displays the essential GOLD攻略 elements in a sub-window without repainting:
- Relative strength
- Correlation direction
- Signal strength
No need to switch between multiple tools.
4. Visualize realistic profit targets with GOLD Pivot Line
- Day-trading: daily pivot
- Range pursuit: weekly pivot
You can instantly grasp a target that suits GOLD’s price movement.
5. ATR-based automatic exit (Trailing EA included)
- Targets auto-set to a minimum RR of 1:2
- In markets that don’t trend, trailing protects
- Eliminates emotional exits
The exit variability is resolved by design, eliminating the biggest cause of losses.
6. Hybrid operation of smartphone × EA
- Entries can be made from a smartphone
- Automated TP/SL/trailing by the exit-trail EA
Even on busy days, you can operate calmly.
7. Design to cultivate winning techniques
GOLD STREAM is not just a tool.
- Identify favorable market scenarios
- A correct RR sense
- Minimize unnecessary trades
It’s a system that helps traders grow themselves.
●For those who want to end these worries
- Direction is right but gets shaken out
- Entering is always late
- Decisions get inconsistent at exit
- GOLD is scary and lacks reproducibility
Most of the cause is the order of judgment.
“Preparation → Correlation match → Confirmation → Execution → EA exit”
Just riding this flow makes trading much more stable.
GOLD STREAM isn’t merely a signaling tool; it’s a decision OS for winning with GOLD.
● Is there a real edge? Why verification is needed
Reason for verification
Here comes an important question.
Whether GOLD STREAM truly demonstrates the strengths above,
how can we confirm it?
Intuition alone won’t suffice.
Data is required.
So we developed a dedicated win/loss analysis tool.
● About the Win/Loss Analysis ToolThis panel is
a weekly verification tool for GOLD STREAM developers.
Therefore,it is not distributed to users.
It’s not a discretionary trading aid; it’s an internal tool to verify the system’s advantage with numbers every week.
●What the analysis tool’s results show:
- Does this system truly win?
- What is the expected value?
- Including losing trades, is the overall result positive?
- Is the risk-reward ratio reasonable?
By examining these from four actual signals,
you can transparently verify whether the panel’s calculations are correct.
●Why introduce the tool in this article
Traders who used to win but lately can’t,
do not regularly verify the system’s edge with numbers, not intuition.
If this tool helps establish that habit, your trading will stabilize dramatically.
Now, let’s specifically check what numbers this tool shows.
● Understand the panel’s seven indicators
We’ll organize the numbers shown in the panel using an example table.
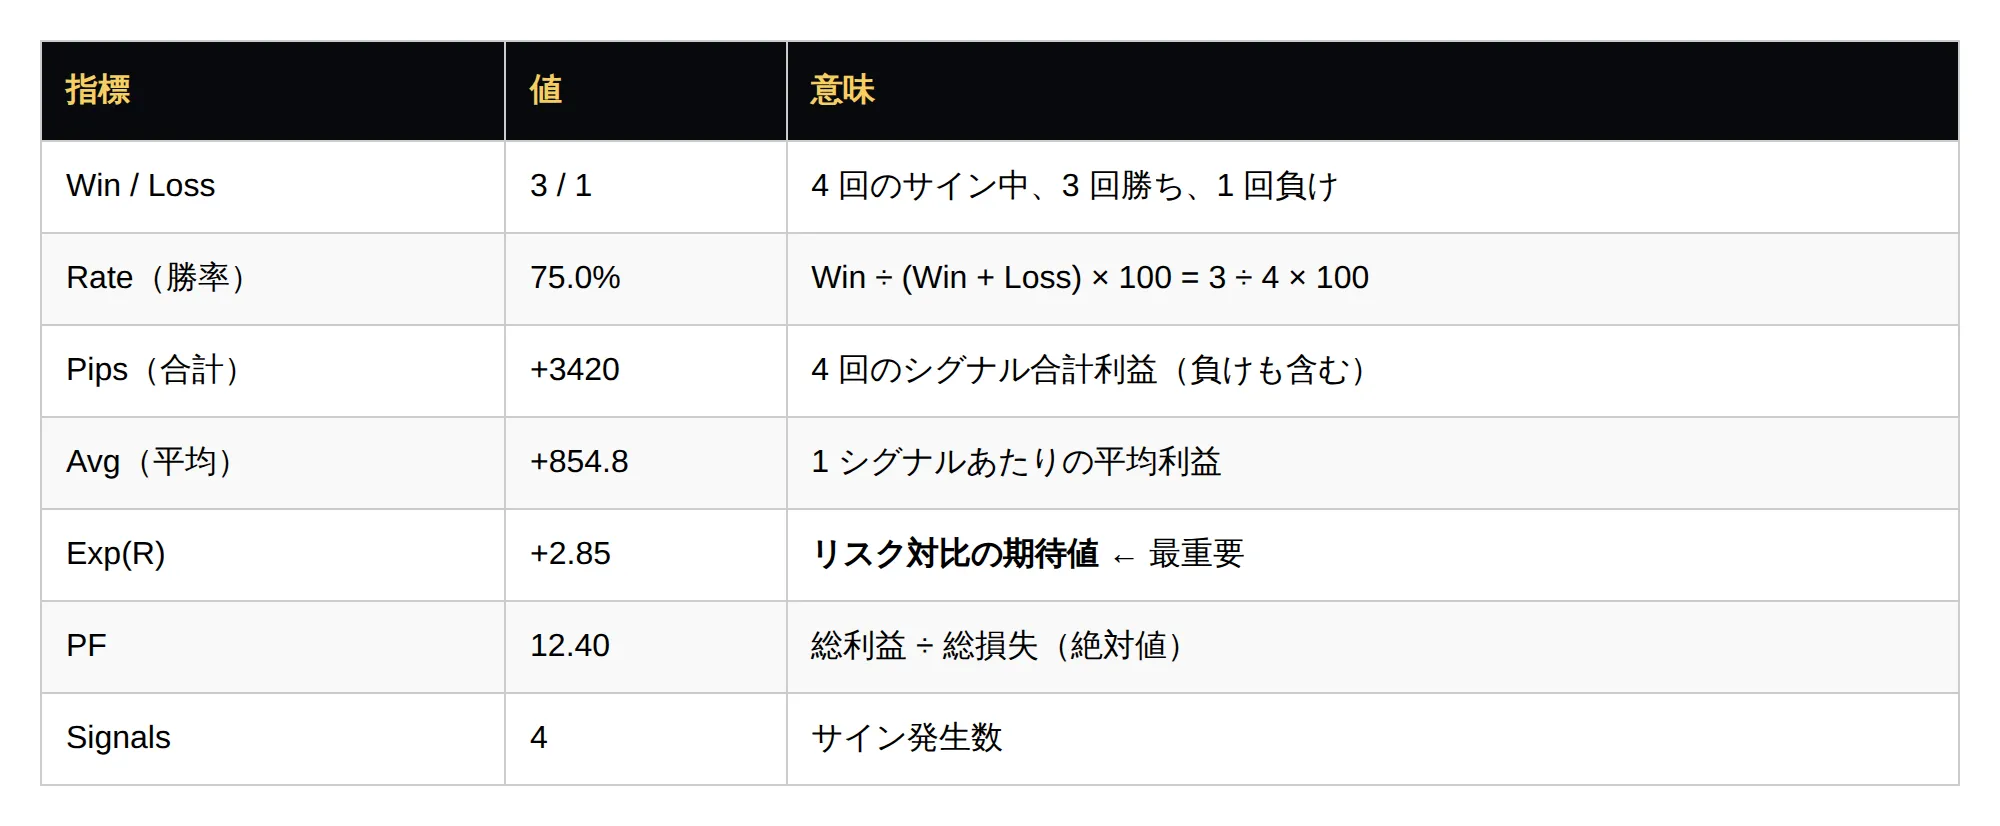
● Key points:
“High win rate” and “edge” are not the same
A win rate of 75% looks attractive, but a single big loss can wipe out three small wins.
Therefore, it’s important to look at total profit (Pips) and Exp(R) (expected value).
● About Exp(R):
This is the true metric for edge
Exp(R) = average profit ÷ risk (stop-loss width)
In this example: 854.8 ÷ 300 =2.85
What does this imply?
If you trade 1 lot:
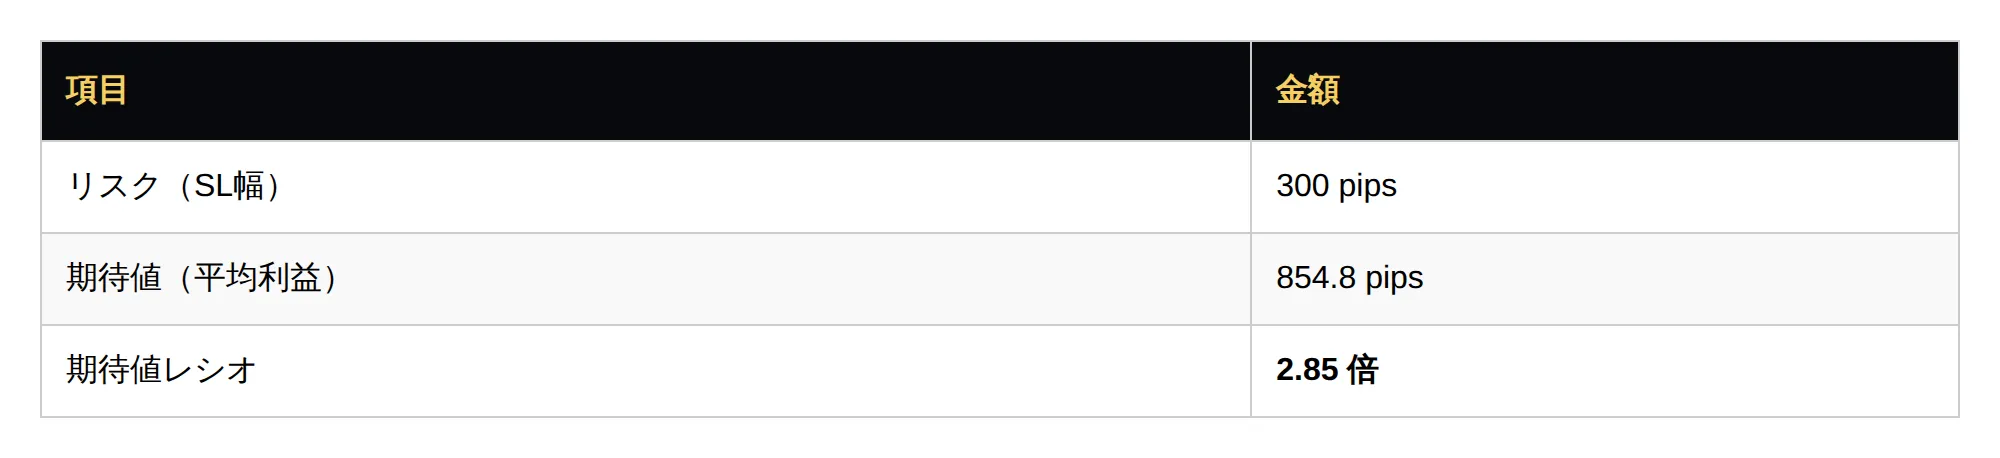
That means, for a trade risking 300 pips, you could gain an average of 854.8 pips.
A return 2.85 times the risk is a very high level of edge.
Generally, Exp(R) > 1.5 is considered “edge present,” so 2.85 is quite strong.
● Let’s review last week’s specific signals
Now, from the four actual signals that appeared on the chart last week, let’s see how the panel’s numbers are calculated.
• Measurement period: 2026-06-08 to 2026-06-12 (1 week)
The chart below marks the four signals generated by GOLD STREAM during the measurement period, with price ranges from entry to exit.
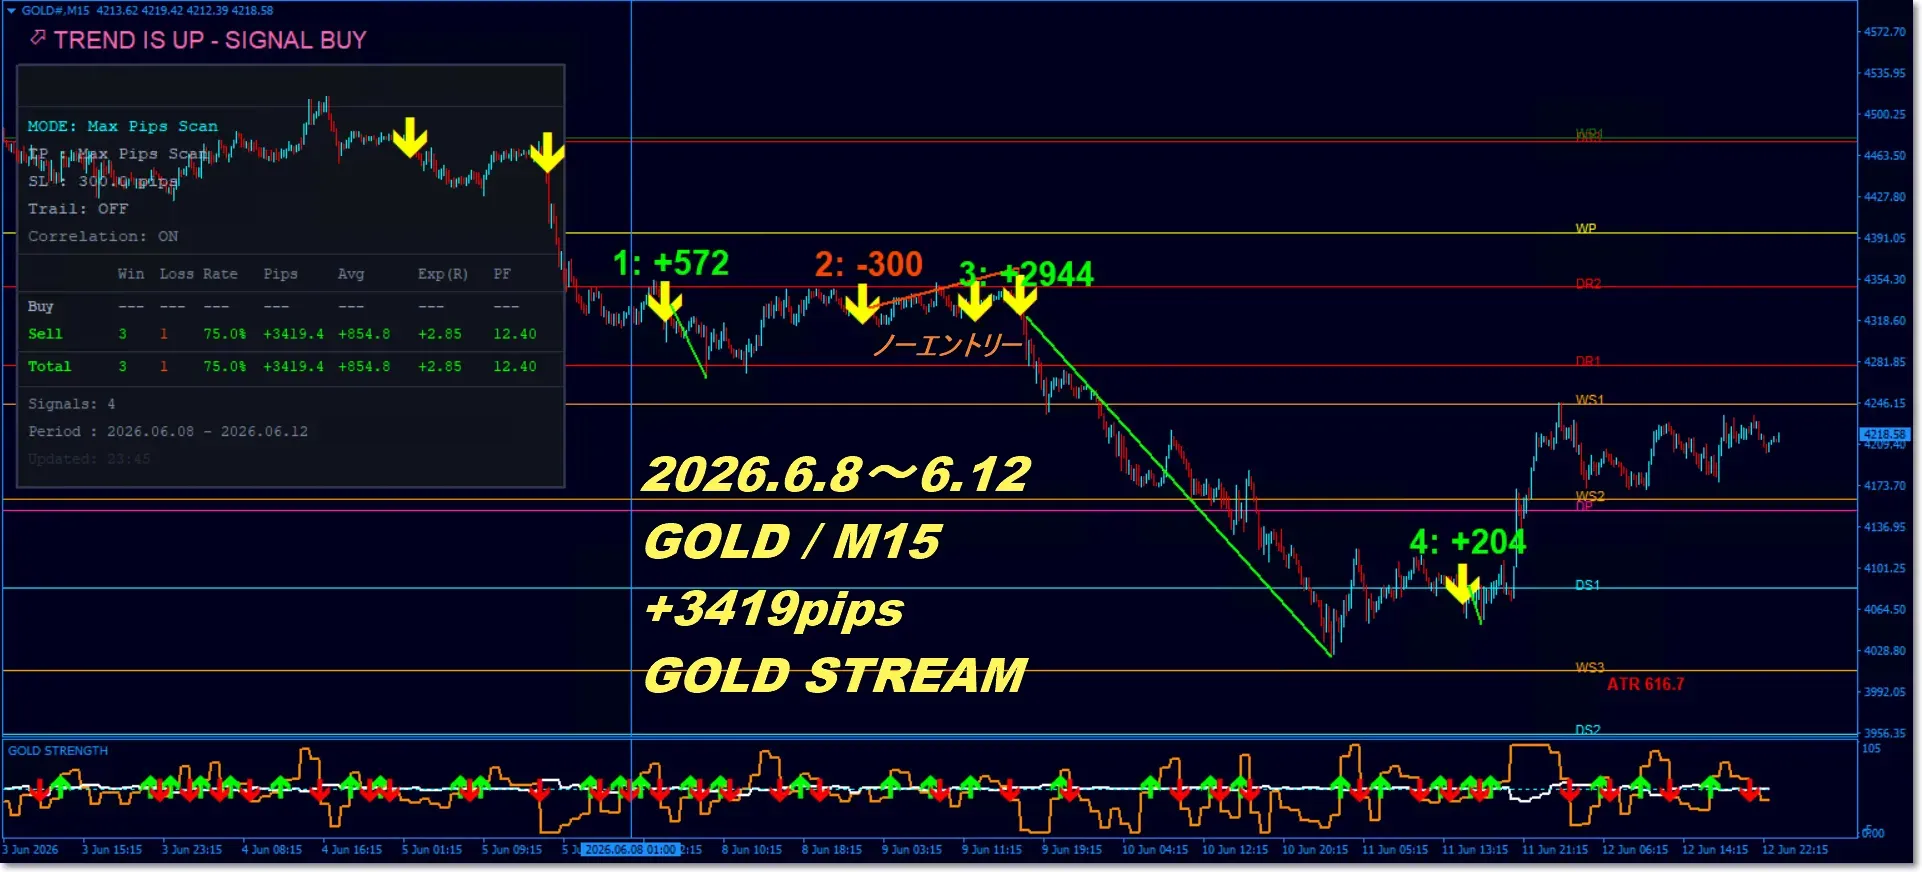
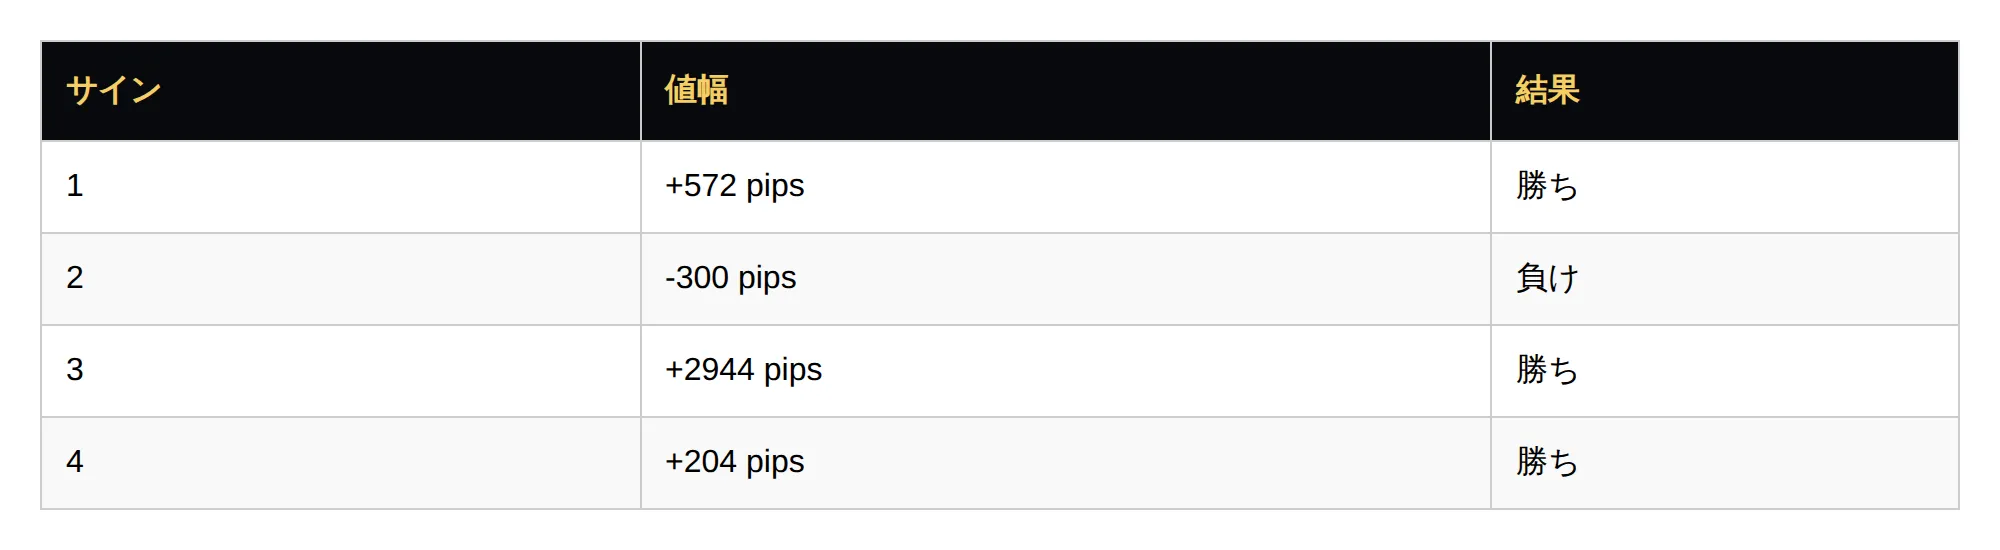
If you organize the four signals on the chart into a table, it looks like this:
Note: Signals 2 and 3 are not trades because correlation is mismatched.
●Reverse calculation verification: are these numbers real?
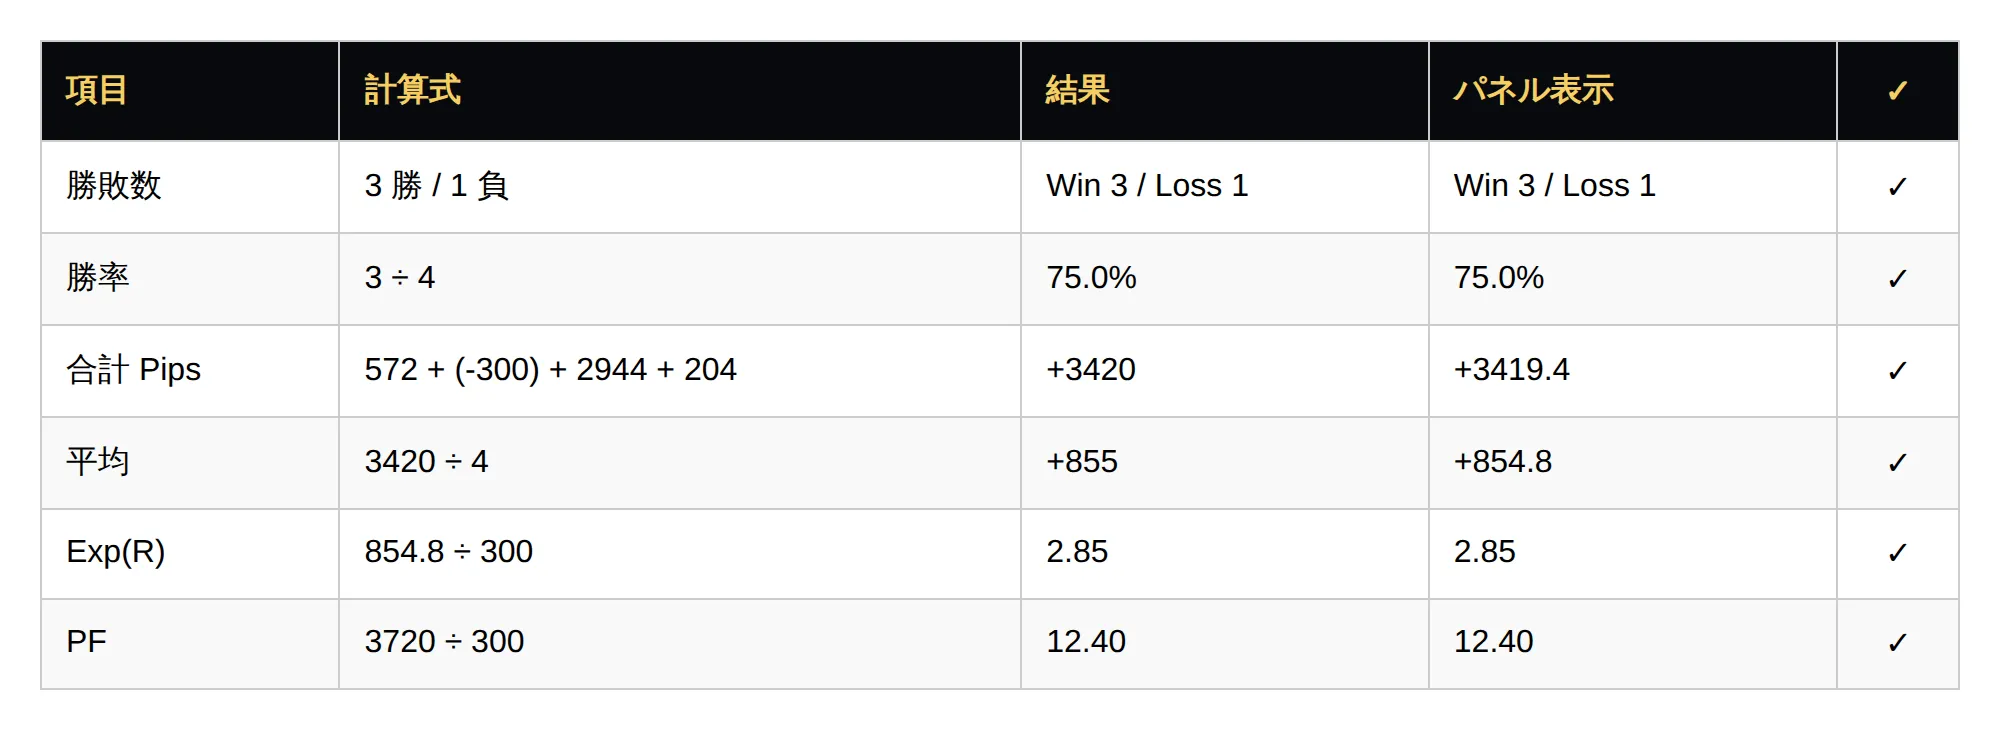
All numbers are precisely calculated from the four signals on the chart.
●Win/Loss Analysis Tool actual screen.
The calculations verified above are displayed in real time on the developer tool’s screen.
The image below shows the panel display at the end of the measurement period (2026-06-08 to 2026-06-12).
You can verify that the signals on the chart completely match the numbers on the panel.
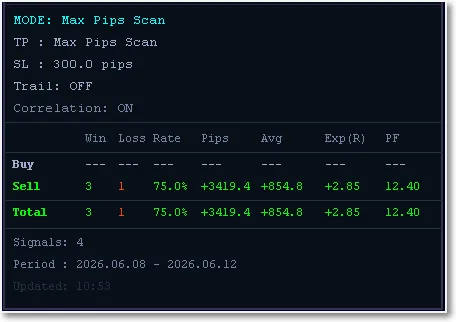
Thus,
4 signals → calculation formula → panel display forms a consistently built data chain.
“Inflating numbers without basis” is physically impossible by design.
● Important:
“Winning judgment criteria”
The Win/Loss Tool defines “win” and “loss” as follows:
Note: because market conditions vary, the SL value is currently fixed at 300 pips, but may change depending on circumstances.
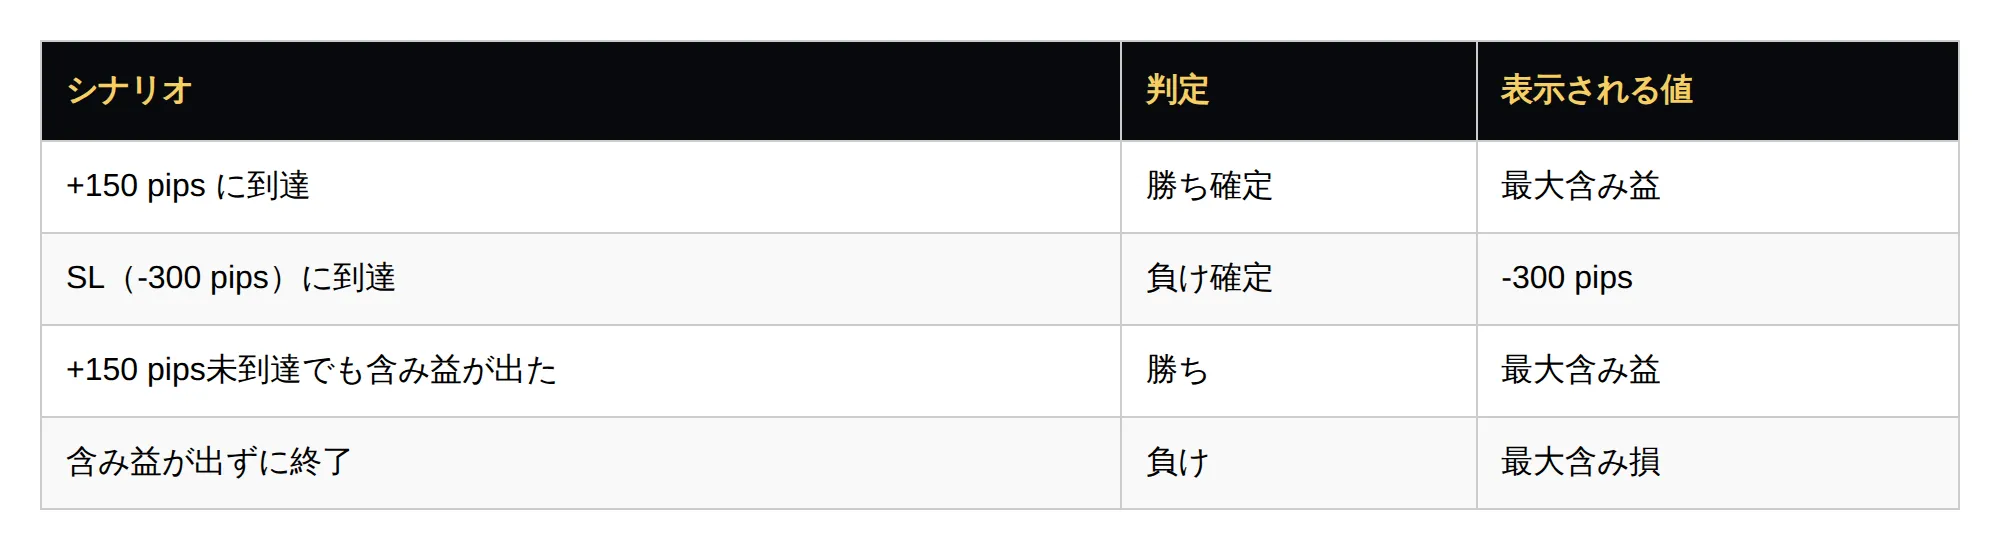
The key point is whether there is a certain amount of unrealized profit.
That amount determines the win/loss criteria.
- If unrealized profit is achieved even once →Win (displaying max unrealized profit)
- If unrealized profit never appears and it incurs a loss →Loss (displaying max unrealized loss)
In short,
the tool can precisely determine if there was a moment when the signal truly “worked.”.
●When applying to four signals
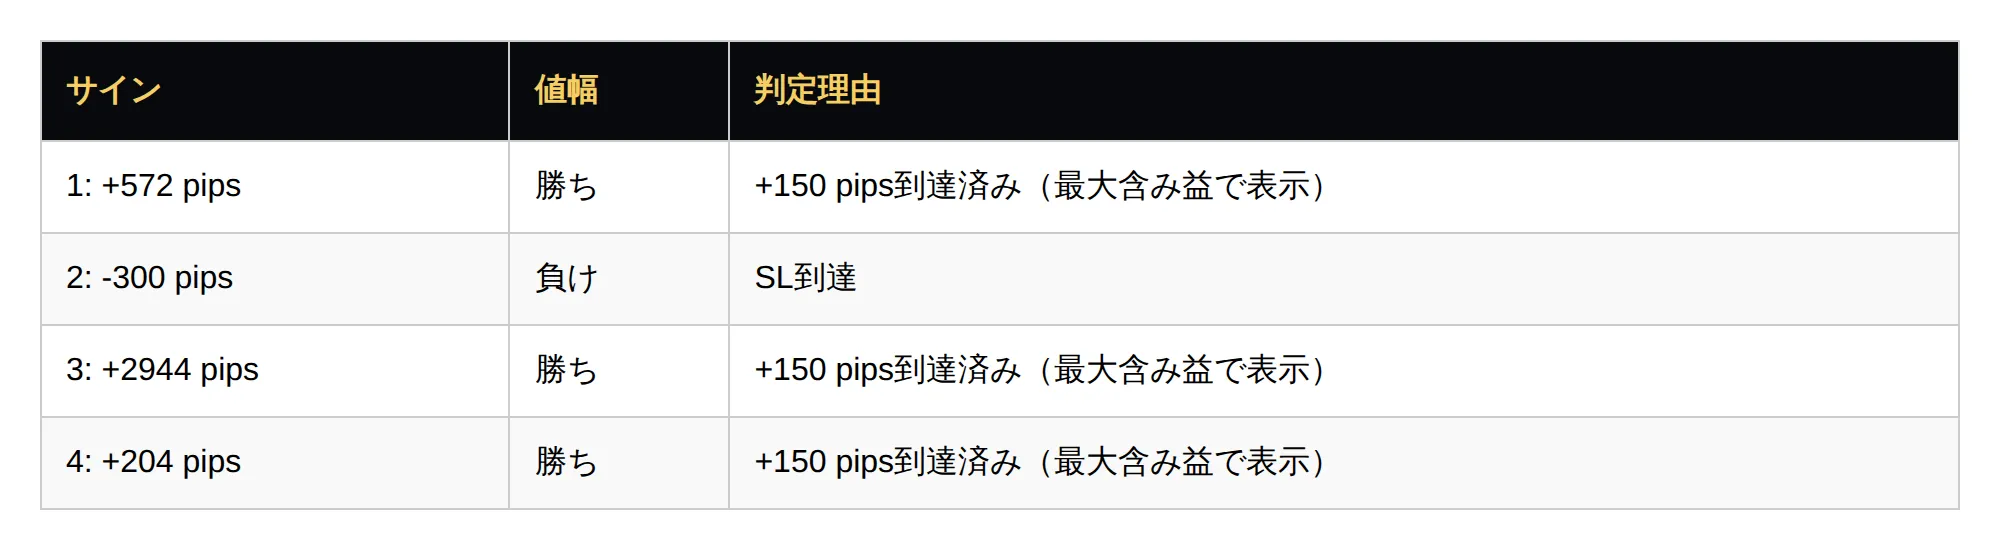
The signal to particularly note is Signal 4 (+204 pips).
It has recorded +204 pips as sufficient profit achievement.
This leads to a more accurate edge calculation.
● This is a “verification” tool
Important note:
This panel is strictly a developer verification tool.
The numbers on the panel do not necessarily reflect your real trading results.
Because,
Users trade freely within GOLD STREAM’s edge.
- From a capital-management perspective, you can choose to take profits early
- On weekends, you can choose “close at +150 pips before SL hits”
Therefore, a user’s Exp(R) will differ from this panel’s contents.
●So why display Exp(R) on the panel?
Because it is to determine whether the system itself has edge.
If your real trading has been losing recently,
then it’s either:
- The system has no edge
- The system has edge, but your exit decisions undermine it
To distinguish these,
the panel visualizes, as Exp, what could have been reached if you followed the system’s entry signals and the measurement-tool rules.
In other words, it’s an indicator to verify the system’s inherent potential without trader discretion.
- Don’t just chase a high win rate → It’s important to look at Exp(R) = 2.85, the risk-adjusted expectation
- Look at the total, including losing trades → Even with a single loss, overall profit remains
- Use the panel to verify the system’s true power → Train yourself to judge by numbers, not feel
If you have experienced earning more than +3000 pips in a month before, have you ever calculated what Exp(R) was then?
Most likely you haven’t.
You were just feeling that you won.
The GOLD STREAM panel’s Exp(R) = 2.85 is
the standard of edge you should aim for.
If your recent Exp(R) is in the 0.5 to 1.0 range, it may not be that the market changed, butyour rules (exit decisions) changed.
Use this tool weekly to confirm the system’s power and ensure your discretion isn’t eroding it. That’s the fastest route to reclaiming winning trades from the past.
● In closing
GOLD STREAM isn’t a magic that guarantees victory just by having it.
However, it is a tool to regularly verify with data whether your own system truly has edge..
Through this verification, your trading will gradually improve.
I hope the numbers displayed on the panel help you form a habit of evaluating with data rather than feeling.
● Disclaimer
The performance data presented in this blog is based on past verification results.
Past performance does not guarantee future profits.
FX trading involves substantial risk. Trade at your own judgment and responsibility.
This article publicly records individual verification results. Please make investment decisions at your own risk.
Verification period: 2026-06-08 to 2026-06-12 (1 week) | Sample size: 4 signals