NK225 Futures MTF Dow Theory 4-Scenario Analysis Report 2026-06-16 (for The Day Session)
NK225 Futures MTF Dow Theory Analysis Report
1. Trend Table
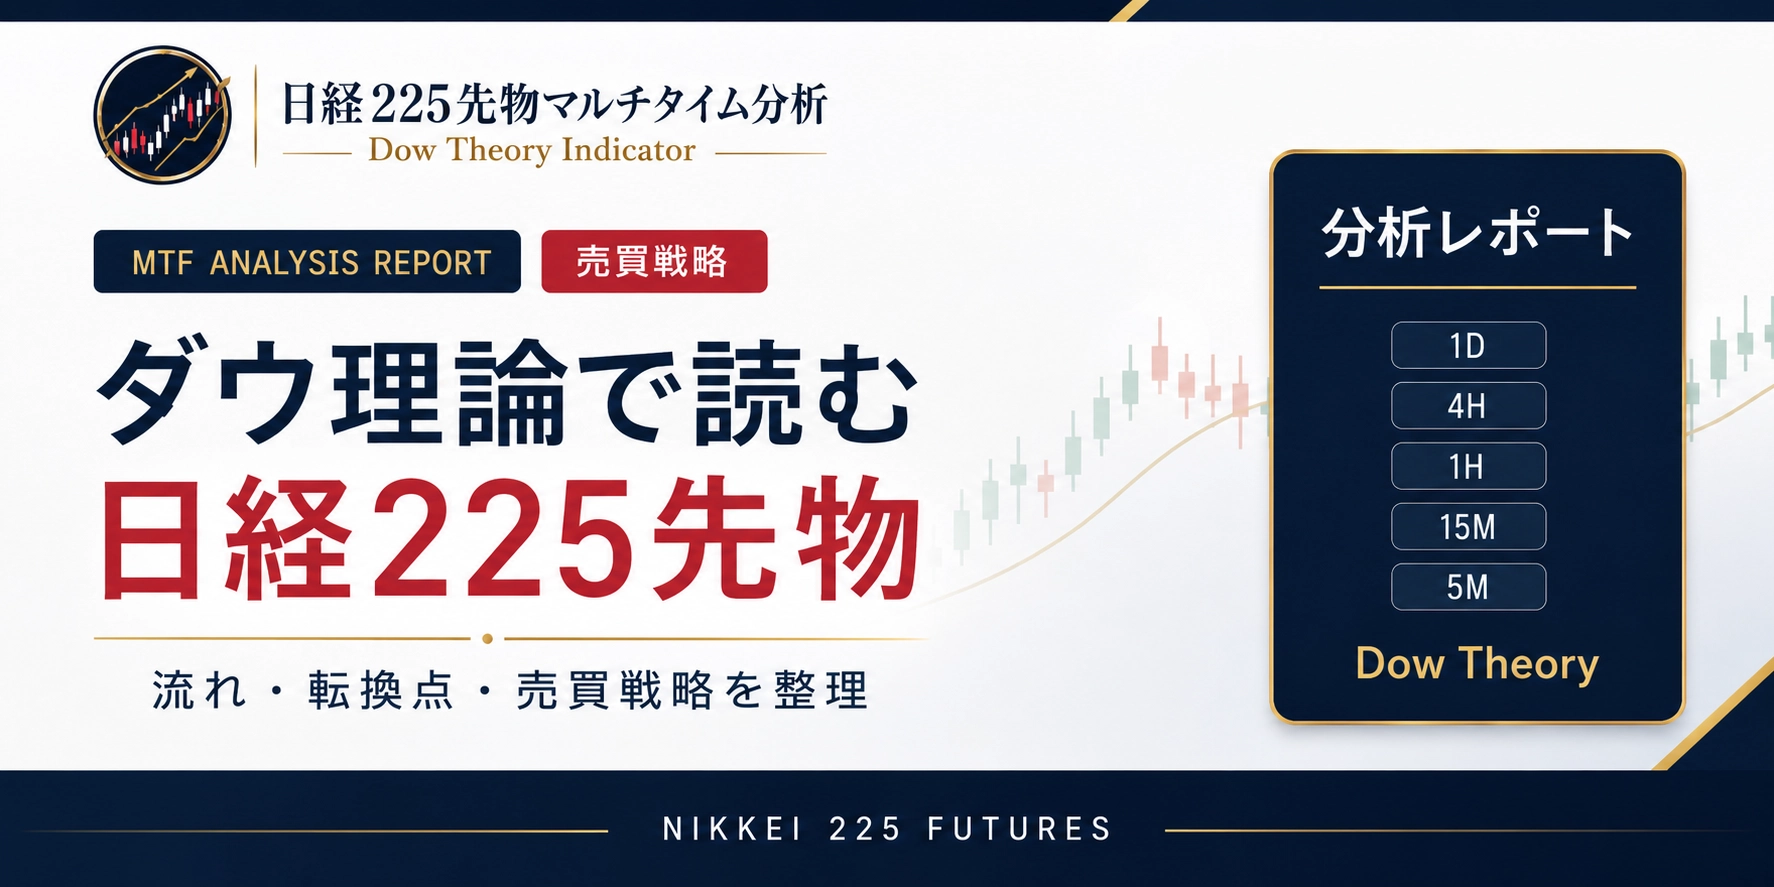
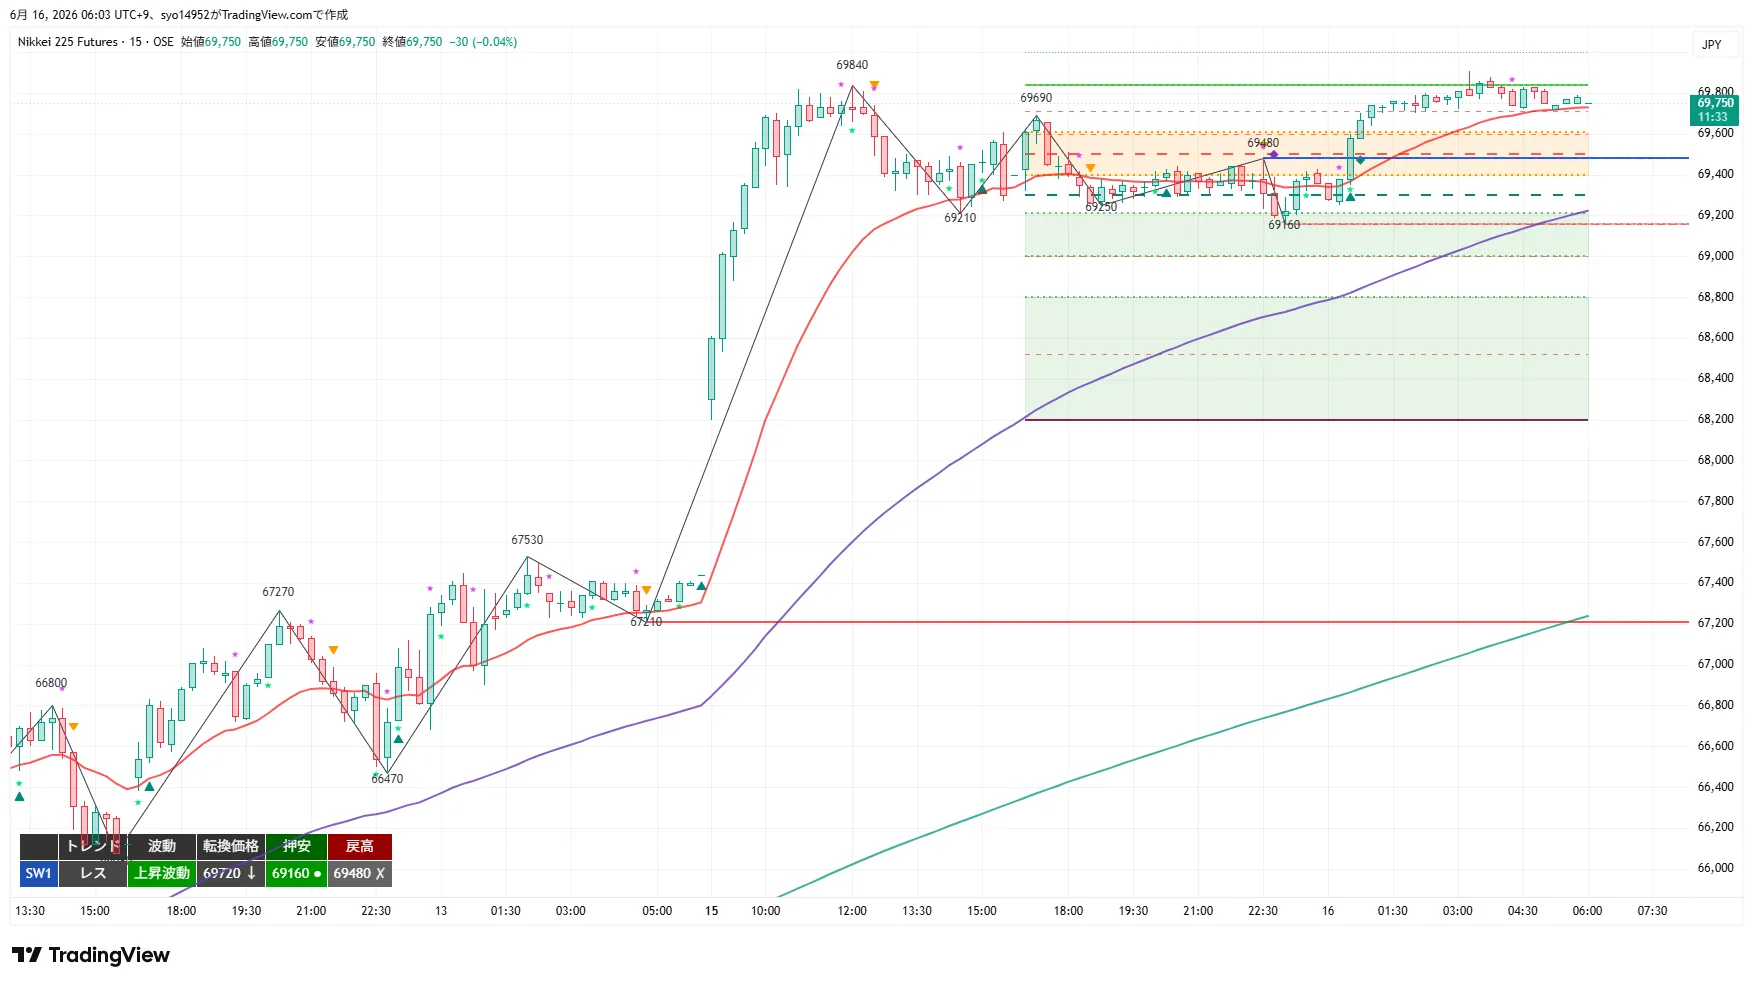
Uptrend / upward wave. Transformation price 66,900, support low 62,350, retracement high 66,110 (X = close price breakout). Night session also made a new high (wick up to 69,910) and closed at 69,750. 20EMA and 20SMA are rising; price remains well above 120EMA (daily 20EMA equivalent around 65,300) and 200EMA (psychological level). However, the 4H 20EMA (around 67,500) shows a large upward deviation from price, indicating overheating.
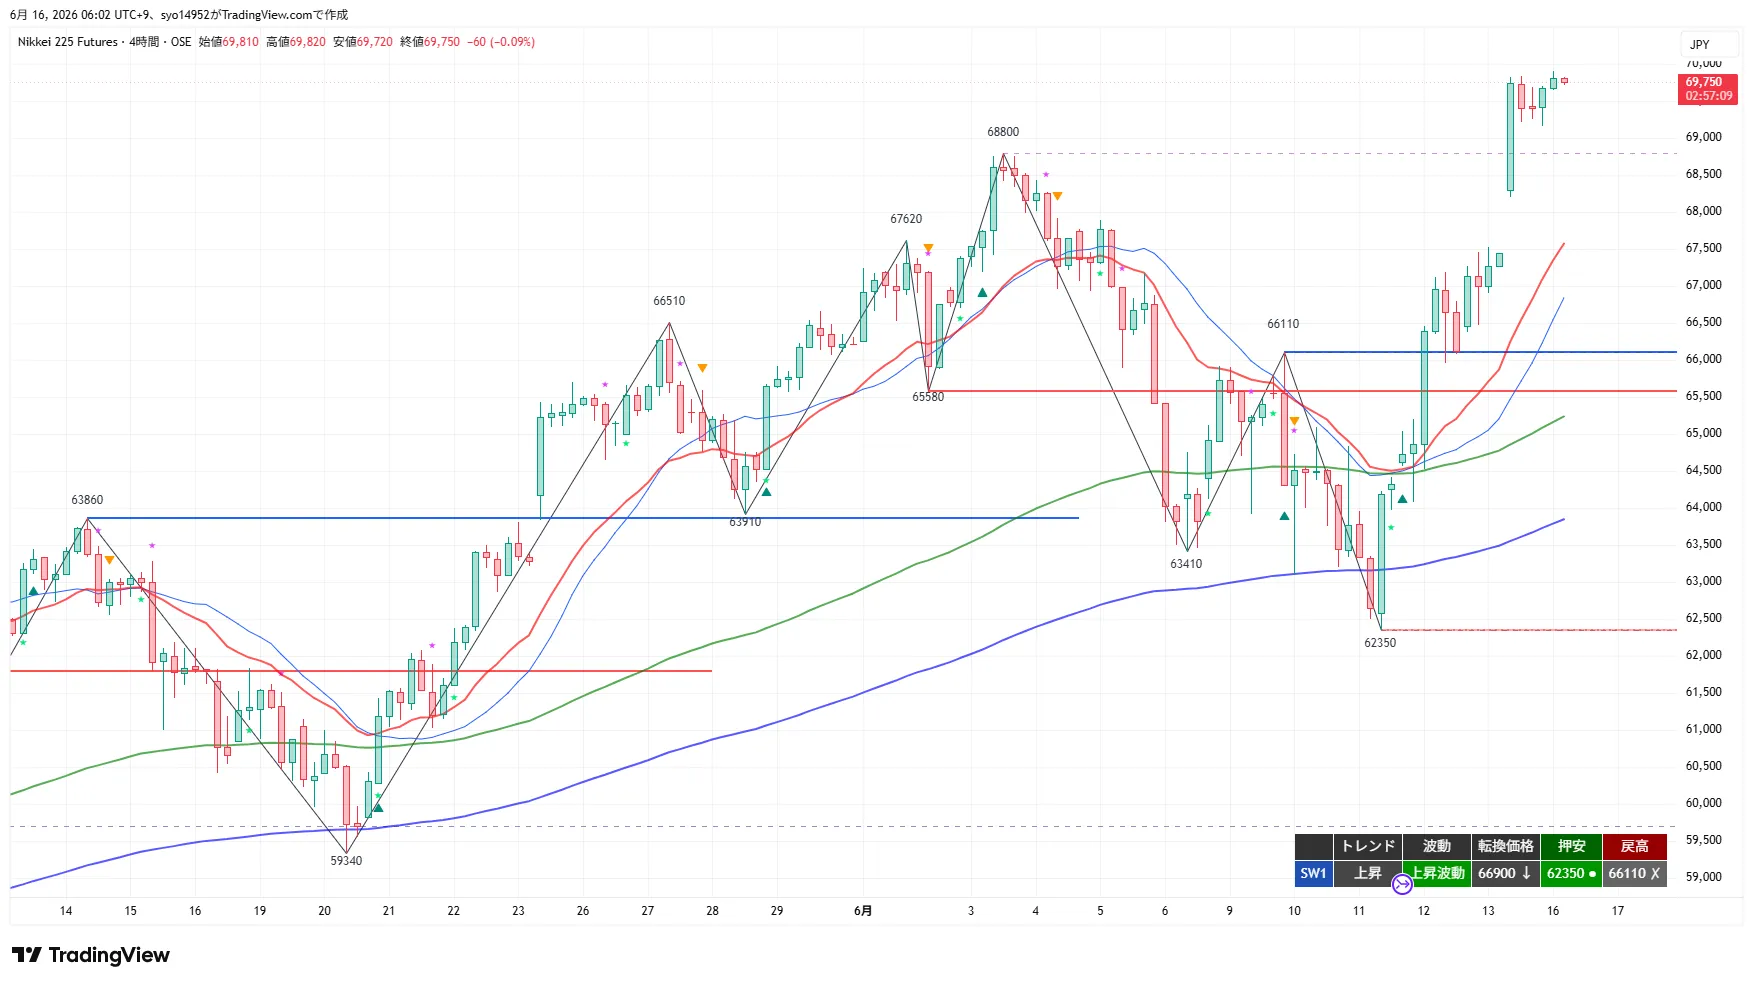
Range / Upward wave. Transformation price 69,160, pullback low 69,160, pullback high --- . Night session low 69,160 is the latest pullback (transformation). 20EMA, 80EMA (4H 20EMA equivalent), and 480EMA (daily 20EMA equivalent) are rising, but 20EMA is plateauing near the highs.
Range / Upward wave. Transformation price 69,720, pullback low 69,160, retrace high 69,480 (X = close price breakout). After breaking above 69,480, the upward wave transforms and rises to 69,910 (wick), then trades in a high-range around 69,160–69,910 and closes at 69,750. The 20EMA flattens, while the 80EMA (1H 20EMA equivalent) and 320EMA (4H 20EMA equivalent) trend upward, with price above them.
2. Important price levels
3. Validation of Previous Trade Ideas
Target: Night Session
Night high 69,910 is a wick, and the 3:30 close price is 69,850. The initial trigger 69,840 was broken at the 15m close, but RR to 70,000 was low, and remaining night time was short, so deferred.
At 0:30, break of 69,480 retrace high and upward wave transformation confirmed; entered at 69,580. T1 reached at 69,840. Since it did not retreat deeply into the initial pullback zone and stayed near the highs, entry was adjusted based on the lower-timeframe wave transformation price (69,480 break) in line with ongoing notes.
1H 20MA rising with slope, so avoided (counter-trend avoidance).
Did not break the lower end of the range; higher-timeframe uptrend continued.
4. 4H Analysis
The 4H remains in an uptrend and rising wave; the night session also made a new high (wick to 69,910) and closed at 69,750. Transformation moved up to 66,900, with pullback low 62,350 and retrace high 66,110 (X). 20EMA/20SMA are rising; price is well above 120EMA (daily 20EMA around 65,300) and 200EMA (psychological level). However, the 4H 20EMA around 67,500 shows a significant upward deviation, indicating overheating.
Resistance looks unlimited up to 70,000 (psychological level). Support down to 69,160 (recent range lower bound), 68,800 (old 4H high turned to support), 66,900 (4H transformation), and ultimately 62,350 (4H pullback low). As long as 62,350 holds, the big picture is bullish, but beware overheating near highs.
5. 1H Analysis
1H shows a range with an upward wave. Recent pullback low (transformation) at 69,160 (Night low). 20EMA, 80EMA (4H 20EMA equivalent), and 480EMA (daily 20EMA equivalent) are rising, but 20EMA remains near the highs and flatlining, indicating a range between 69,160 and 69,910.
If 69,160 holds as support, the dip-buying trend continues; if 69,160 closes below on a 1H basis, downside range break and bullish momentum collapse should be watched.
6. 15m Analysis
15m shows range / upward wave (transformation 69,720, pullback low 69,160, retrace high 69,480 X). 20EMA flattens near price, while 80EMA (1H 20EMA equivalent) and 320EMA (4H 20EMA equivalent) trend upward with price above them.
Short term range is 69,160–69,910. A close above 69,910 triggers new highs; a break below 69,160 breaks the range lower. Within-range pullbacks are limited to confirm the upper limit; due to 20EMA flattening, avoid rushing in and wait for clearer signals.
7. Conclusion
In summary, the night session broke above 69,480 to transform into an upward wave and rose to 69,910 (wick) but then traded sideways in a high-range around 69,160–69,910, closing at 69,750. The 4H maintains an uptrend and rising wave, while 1H and 15m are range-bound (rising waves). After a surge, momentum cools and price holds at a high level. During the day, base on 4H uptrend, use pullbacks for buying; wait for a breakout of the range upper limit 69,910 to chase new highs, or a break below 69,160 for a short-term correction, then act accordingly to confirm breakout away from the range.
Keep 69,160 (range lower bound) as support for dip buys, and use a breakout above 69,910 (range upper bound) for unlimited breakout long. If the range upper limit stalls, use pullback selling (limited to retracements). If price breaks below 69,160, watch for range breakdown and potential downside to 68,800 → 68,200. Although 4H shows uptrend, 1H and 15m are range-bound, so avoid chasing until momentum confirms a breakout; protect with MFE quickly.
In terms of coherence, 4H shows uptrend and rising wave, while 1H and 15m are in range-bound rising waves. The higher time frame (4H) should be prioritized for buying dips as the main axis, but since 1H and 15m are in a high-range, wait for confirmation of a breakout above the range upper limit (continued uptrend) or a break below the range lower limit (short-term correction). Returns on pullbacks should be limited within the range.
8. Trade Ideas
- Trigger: Break above 69,910 (Night high / range upper) with a 15m close (unlimited new highs).
- Precursor: After the break, pullback near the breakout price or near the tilted 20MA (watch for dip-buy) to time with a short-term entry (back entry; target around 69,910). Break price baseline.
- Main entry condition: Price recovers to 70,000 by 1H close.
- Stop/Invalidate: If the initial leg falls below 69,640, or the main leg falls below 69,160.
- Targets: 70,200 (partial take + position) and 70,500.
- RR: Based on precursor 69,910 / LC 69,640 (risk 270). T1 70,200 +290 = RR1.1, T2 70,500 +590 = RR2.2. As unlimited breakout, back-entry is essential; main position to be used.
- MFE protection: exit at +200 with break-even or small profit, or trail at +300 to secure at least +100. In unlimited, overheated zone, protect early.
- Standard: 69,160 (1H transformation / 15m pullback low / Night low = range lower bound) rebounds confirmed by 15m close. Deep pullbacks refer to 68,800 (old 4H high turned support) to 68,200 (old 1H transformation).
- Precursor: Confirm rebound at 15m close from pullback candidate (upper level around 69,300 shallow pullback, deep pullback 68,300). Enter above rising 20MA.
- Main entry condition: 69,720 recovers on 1H close.
- Stop/Invalidate: Precursor below 69,000 (deep pullback below 68,080), main below 68,800. Fully exit below 68,200.
- Targets: 69,840 (partial take + position) and 70,000–70,500.
- RR: Precursor 69,300 / LC 69,000 (risk 300). T1 +540 = RR1.8, T2 (70,000) +700 = RR2.3.
- MFE protection: exit at +200 to break-even or small profit, or +300 to secure at least +100 or trail. In high-range / overheated zone, favor shallow pullbacks and protect early.
- Standard: 69,840–69,910 (range upper) to cap upside and confirm stall with 15m close (limited to within-range retracements).
- Precursor: Stall at range upper confirmed by 15m close (precursor around 69,800).
- Main entry condition: Break below 69,160 (range breakdown).
- Stop/Invalidate: Precursor recovers to 69,950; main recovers to 69,910. Strong invalidation at 69,910 (Night high recovery).
- Targets: 69,160 (partial take + position), 68,800–68,200.
- RR: Precursor 69,800 / LC 69,950 (risk 150). T1 69,160 + 640 = RR4.3, T2 68,800 + 1,000 = RR6.7.
- MFE protection: exit at +200 to break-even or small profit, or +300 to secure at least +100 or trail. As 4H is rising, refrain from deep chasing; limit retracements within range and avoid chasing beyond rising 20MA. If the trigger is confirmed and target 1 is reached, skip entry.
- Trigger: Break below 69,160 (1H transformation / range lower bound / Night low) with a 15m close (range breakdown / collapse of uptrend).
- Precursor: After break, pullback near breakout price or near tilted 20MA (watch for pullback). Time with a short-term entry (back entry; around 69,160).
- Main entry condition: Break below 68,800 on 1H close.
- Stop/Invalidate: Precursor recovers to 69,480; main recovers to 69,720. Full exit at 69,910.
- Targets: 68,200 (partial take + cost basis), 67,530 / 67,210.
- RR: Precursor 69,160 / LC 69,480 (risk 320). T1 68,200 + 960 = RR3.0, T2 67,530 + 1,630 = RR5.1.
- MFE protection: exit at +200 to break-even or small profit, or +300 to secure at least +100 or trail. Since 4H is strongly rising, do not pursue below 69,160 break; ensure exit before deep decline. If a new high is reached and then reverses, beware false breakouts.
9. Current Actions
- Most important line 1: 69,160 JPY — 1H transformation, range lower bound, night low. Maintain and rebound for dip-buying (trend-following). If 15m close breaks below, range breakdown and short-term correction toward 68,800 (old 4H high) → 68,200 becomes a focus.
- Most important line 2: 69,910 JPY — Night high / range upper. Break above 15m close triggers unlimited new highs chasing (to 70,000 and beyond) with breakout-following long. If upper range stalls, respond with pullback selling (limited to retracements).
10. Cautions
- Entry price, trigger, and stop are set based on the chart shape at the close time (transformation price, pullback lows, retrace highs for each timeframe). If structure changes over time, unless higher-timeframe structure changes, entry prices should be adjusted based on the transformation prices of lower-timeframe waves (e.g., when a short-term leg moves into a-down wave then transforms into an up wave) to better reflect actual conditions.
- 4H is up and in the new-high zone, but 1H and 15m are in a high-range. Confirm direction after range break (upper break continues trend; lower break signals a short-term correction). Use MFE protection early for buys.
- Dip selling and breakout-short are counter-trend against the 4H rise; wait for confirmation of range upper stall or 69,160 break before acting. Avoid pressing long positions above the rising 20MA.
- If the trigger is confirmed and target 1 is reached, skip additional entries.
11. About This Report
This report analyzes NK225 futures using Dow Theory Indicator across three time frames: 4H / 1H / 15m.
Note: This report is provided for information purposes and is not investment advice. Investment decisions are the reader's responsibility.