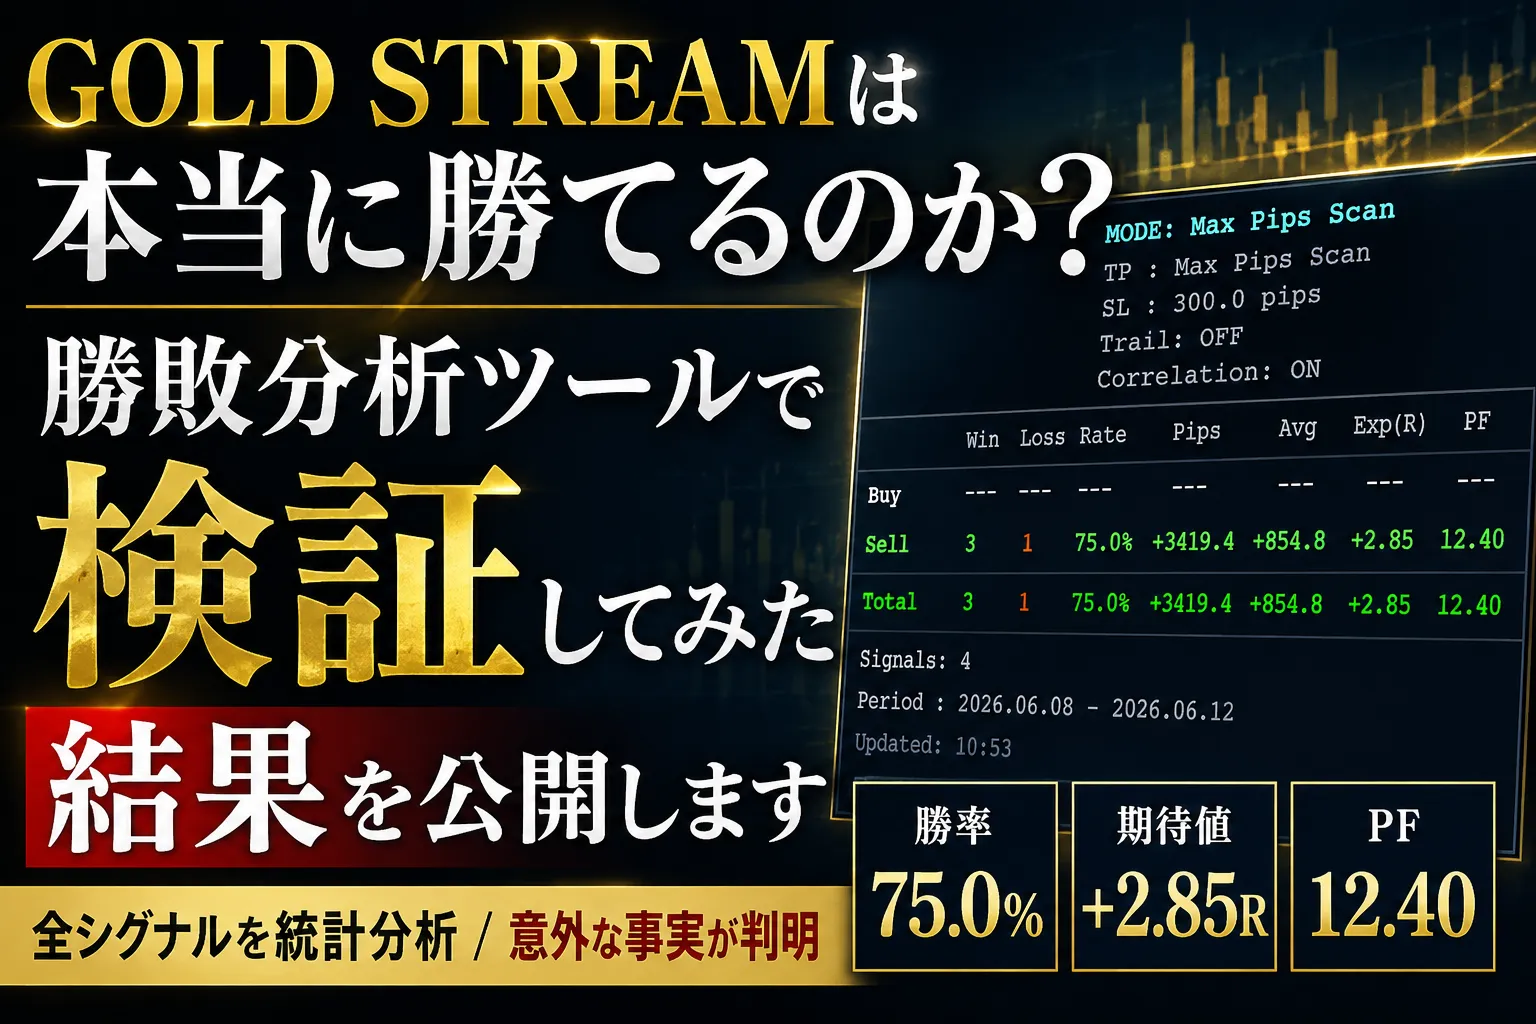
[Expose the Tool’s True Performance] GOLD STREAM Exclusive Win/Loss Analysis Tool Verification Result
●Introduction
As you look at trading tools,
the big numbers that grab your attention are unavoidable.
If you only look at these prominently displayed numbers,
it is natural to wonder, “Is this really true?”
Numbers can be manipulated when taken out of context, so you must be cautious.
So what is behind those numbers? How are they calculated?
In this blog, by showing theverification process itself,
we will confirm what the tool GOLD STREAM really does.
● What GOLD STREAM is:
M15 Day-Trade Specific Decision OS
GOLD STREAM is a dedicated short-term day-trade system for Gold (XAUUSD) designed to keep you from hesitation, delay, and fluctuation.
Even in a volatile market, it is designed to enter only after aligning the justification, supporting highly repeatable trades.
Seven strengths of GOLD STREAM
1. Pure GOLD (XAUUSD) specialization
A short-term day-trade logic optimized for GOLD’s unique volatility and correlation structure. It emphasizes “reliability x consistency” in real-world use centered on M15, where it performs best.
2. Ready → Signal two-stage notification
- Ready (preparatory): a head’s up that conditions are starting to be met
- Signal (confirmed): a complete match indicating a potential entry
This helps prevent misses, chasing, and rushing, turning the “process” into a habit.
3. Immediate assessment of strength and correlation on one screen
The following essential GOLD攻略 elements are displayed in a sub-window without repaint:
- Relative Strength
- Correlation Direction
- Signal Strength
No need to switch between multiple tools.
4. Visualize realistic take-profit levels with GOLD Pivot Line
- Day-trade: Daily Pivot
- Range targeting: Weekly Pivot
Instantly grasp “reachable” take-profits that align with GOLD’s price moves.
5. ATR-based automatic exit (Trail EA included)
- Target automatically set for a minimum RR of 1:2 or better
- In markets that don’t trend, trailing protects
- Eliminates emotional exits
Exit slippage is eliminated by the system in favor of disciplined exits.
6. Hybrid operation of smartphone and EA
- Entries can be made on a smartphone
- Decision-trail EA handles TP/SL/trail automatically
Even on busy days, you can operate calmly.
7. A design that cultivates winning technique
GOLD STREAM is more than just a tool.
- Identify high-edge market situations
- A proper RR sense
- Reduce wasteful trades
It’s a mechanism that helps traders grow themselves.
●For those who want to end these troubles
- Direction matches but gets whipsawed
- Always late to enter
- Decision slippage at exit
- GOLD is scary and not repeatable
The main reason is often the “order of judgment.”
“Prepare → Correlation match → Confirm → Execute → EA exit”
Just following this flow makes trading instantly more stable.
GOLD STREAM is not just a signal tool; it is a decision OS to win with GOLD.
● Is there really an edge?
Why verification is necessary
A key question arises here.
Can GOLD STREAM truly demonstrate the strengths described above,
and how can we verify it?
It cannot be judged by intuition.
Data is required.
So we developed a dedicated win-loss analysis tool.
● About the Win-Loss Analysis ToolThis panel is
the weekly verification tool for GOLD STREAM developers.
Therefore, it is not distributed to users.
It is not a discretionary trading aid, but an internal tool to confirm the system’s edge weekly with numbers.
●What the analysis tool results convey.
- Does this system truly win?
- What is the expected value?
- Do losses included still result in a positive overall?
- Is the risk-reward ratio reasonable?
By validating these against four actual signals,
you can transparently confirm whether the panel’s calculations are correct.
●Why introduce this tool in this article
Traders who once made profits but recently struggle
do not have the habit of regularly verifying the system’s edge with numbers rather than feeling.
If this tool becomes the trigger to develop that habit, your trading will stabilize quickly.
Now, let’s specifically check what numbers that tool reveals.
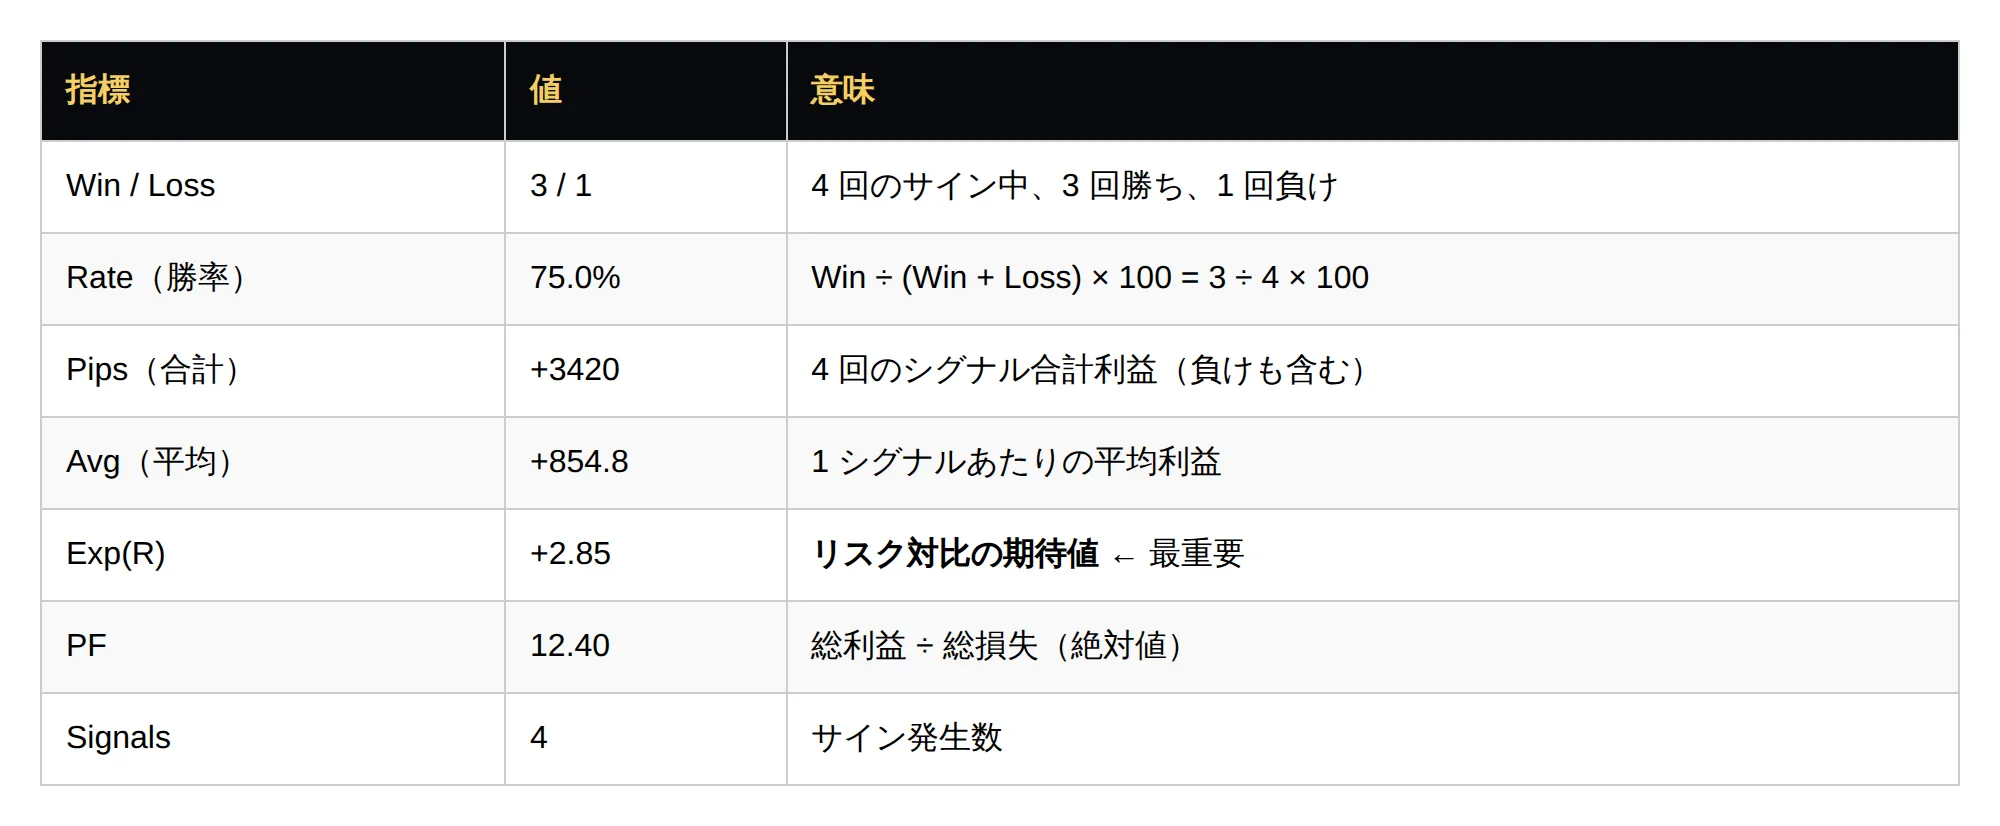
● Understand the panel’s seven indicators
The numbers shown on the panel are organized with a table-like example.
● Key points:
“Higher win rate” and “edge” are different things
A win rate of 75% looks attractive, buta single large loss can erase three small wins.
Therefore, it’s important to look at total profit (Pips) and Exp(R) (expected value).
● About Exp(R):
This is the true measure of edge
Exp(R) = average profit ÷ risk (SL width)
In this example: 854.8 ÷ 300 =2.85
What does this mean?
If you trade 1 lot:
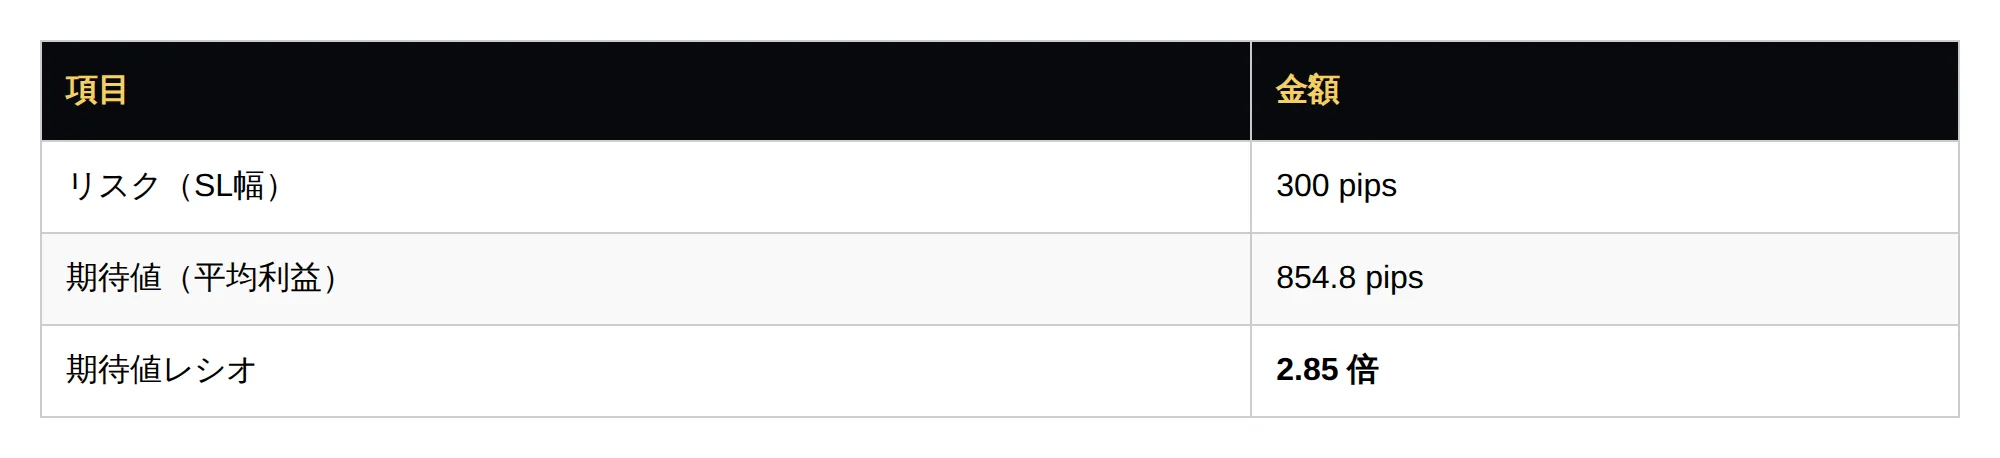
That is, for a risk of losing 300 pips on one trade,
you have the potential to gain an average of 854.8 pips.
A return 2.85 times the risk indicates a very high level of edge.
Generally, Exp(R) > 1.5 is considered “edge,” so 2.85 is quite strong.
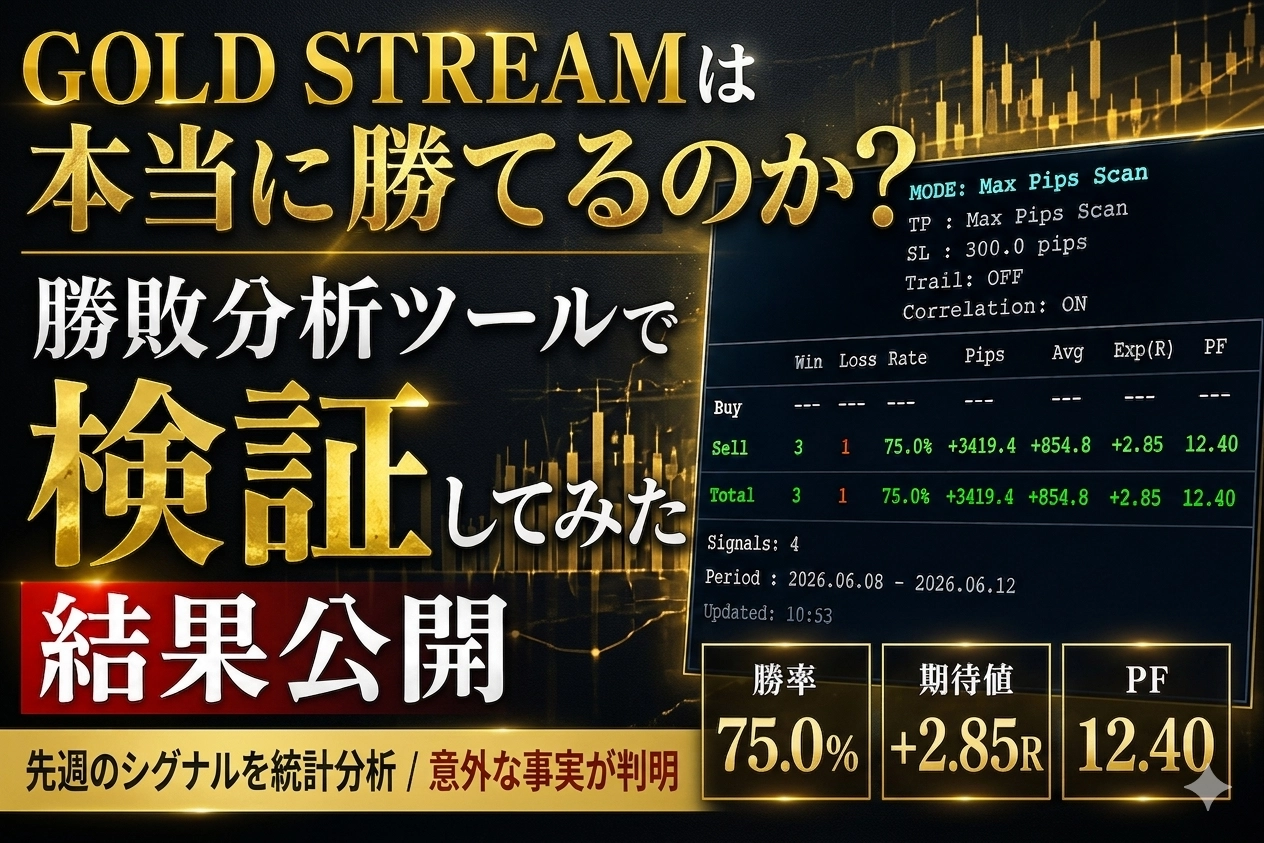
● Let’s review last week’s concrete signals
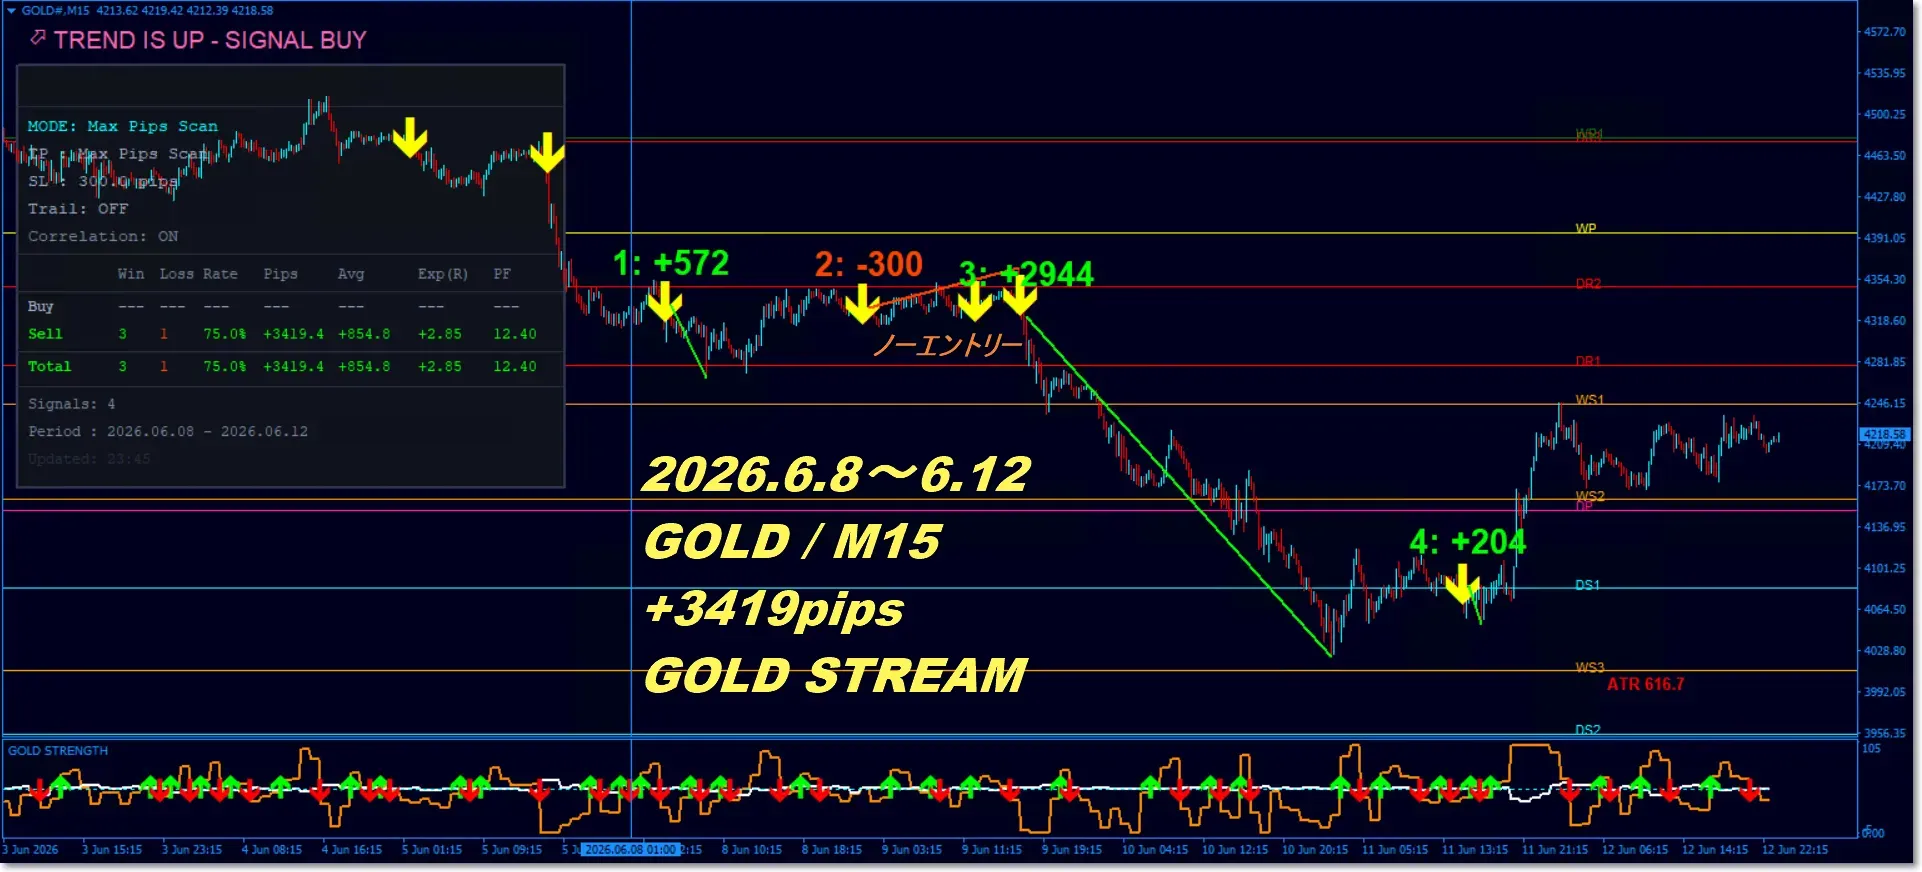
Now, from the four actual signals that appeared on the chart last week, let’s see how the panel’s numbers are calculated.
・Measurement period: 2026-06-08 to 2026-06-12 (1 week)
The chart below marks the four signals generated by GOLD STREAM during the measurement period, including entry-to-exit price moves.
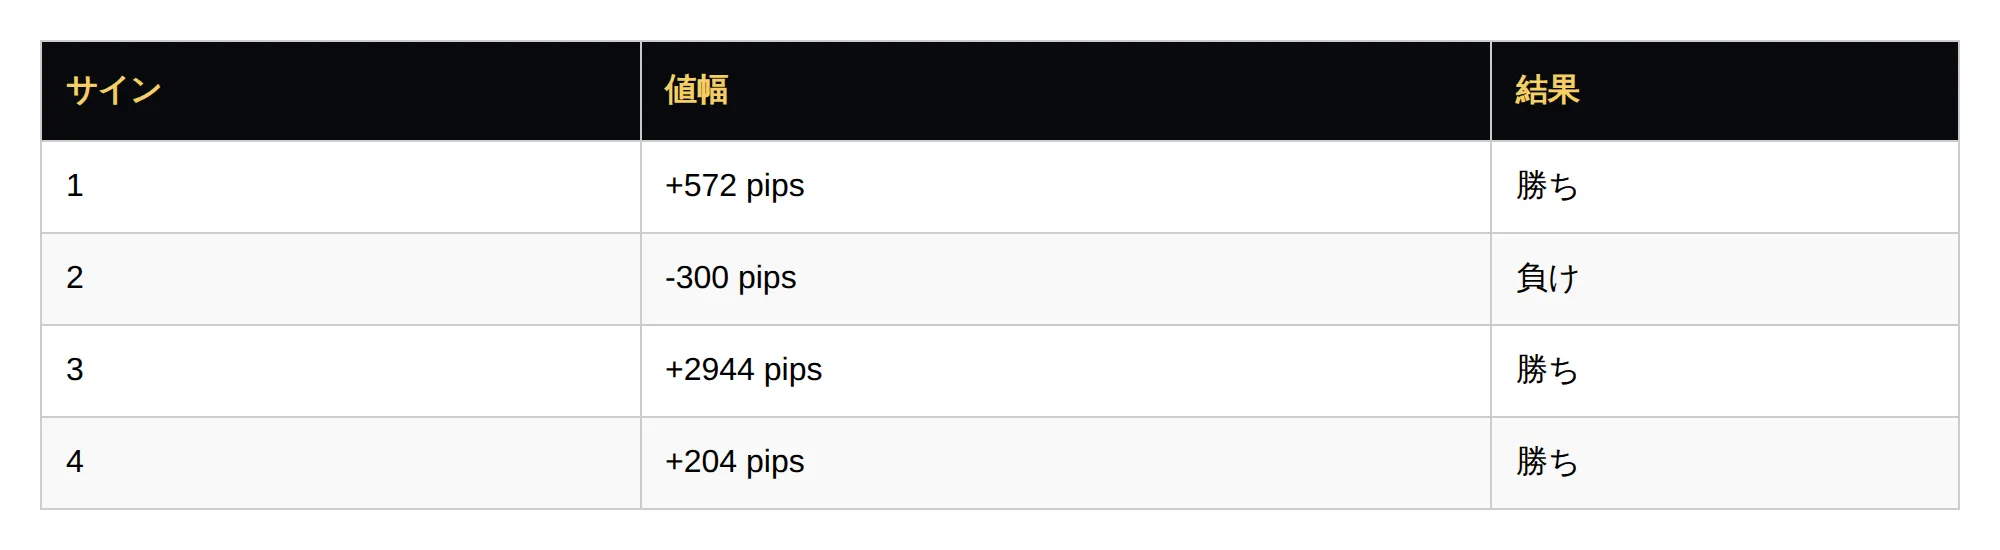
If you organize the four signals on the chart into a table, it looks like the following.
Note: The signals between 2: and 3: are not traded due to inconsistent correlation, so they are not traded decisions.
●Back-calculation verification: Are these numbers accurate?
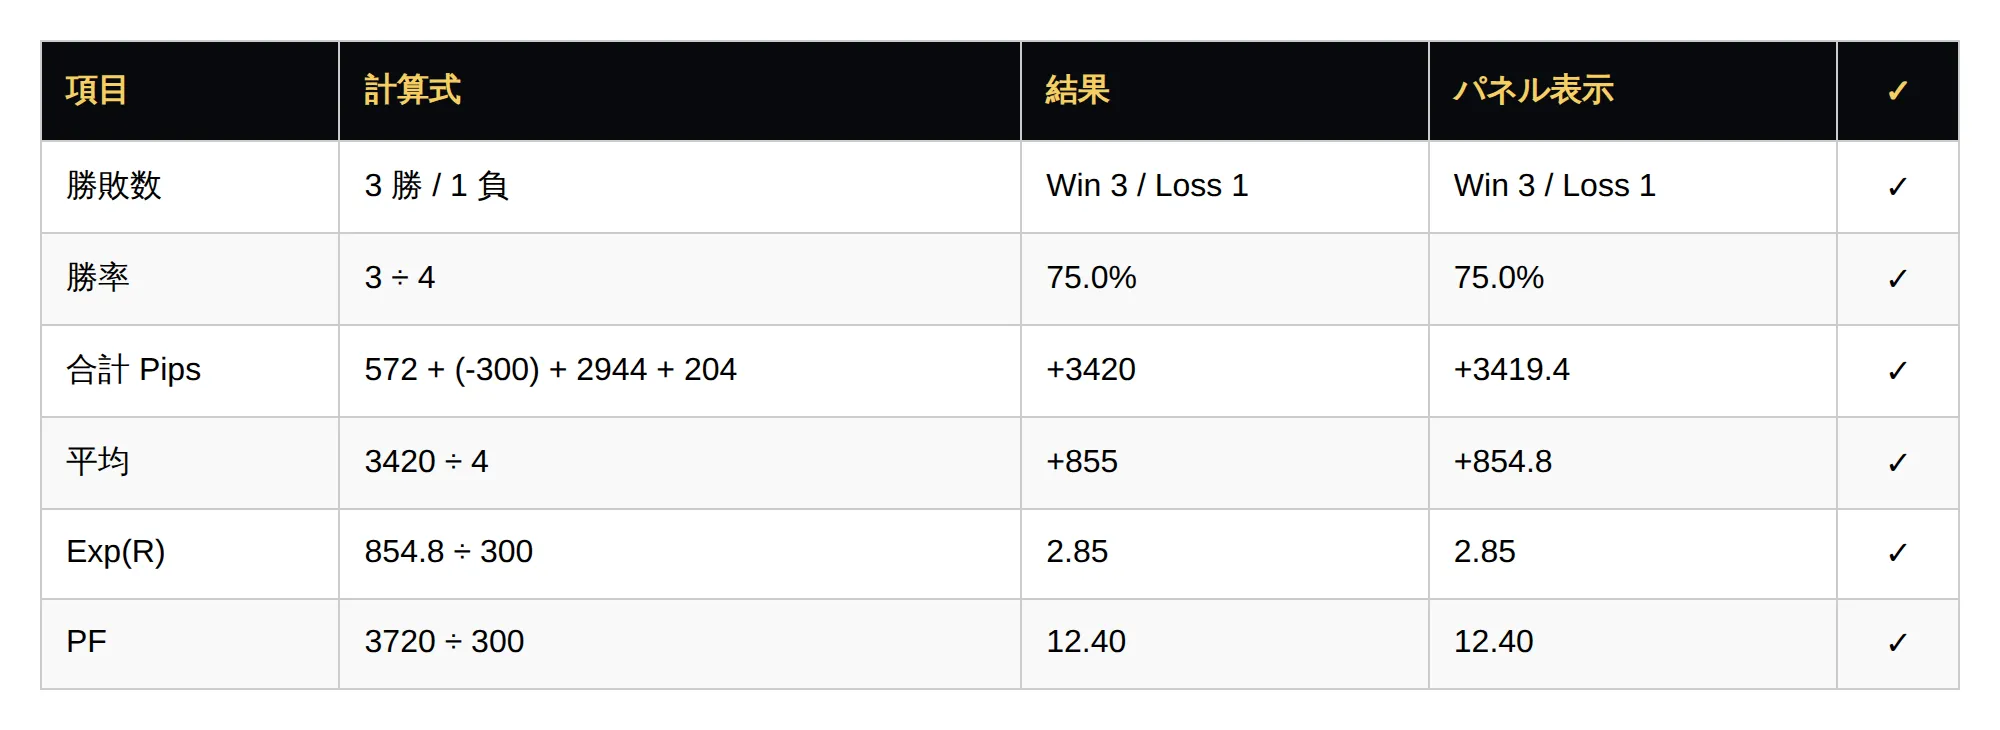
All numbers can be precisely calculated from the four signals on the chart.
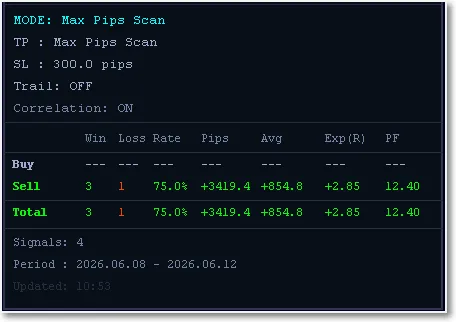
●Win-Loss Analysis Tool in actual view
The calculated results from the back-calculation are shown in real time on the developer tool above.
The image below is the panel display at the end of the measurement period (2026-06-08 to 2026-06-12).
You can confirm that the signals on the chart completely match the panel numbers.
Thus,
the flow of four signals → calculation formula → panel display is built entirely from consistent data.
It is physically impossible for the numbers to be “inflated.”
● Important:
“Win decision criteria”
In the Win-Loss Analysis Tool, “win” and “loss” are defined as follows.
Note: the current SL is fixed at 300 pips, but may be adjusted depending on market conditions.
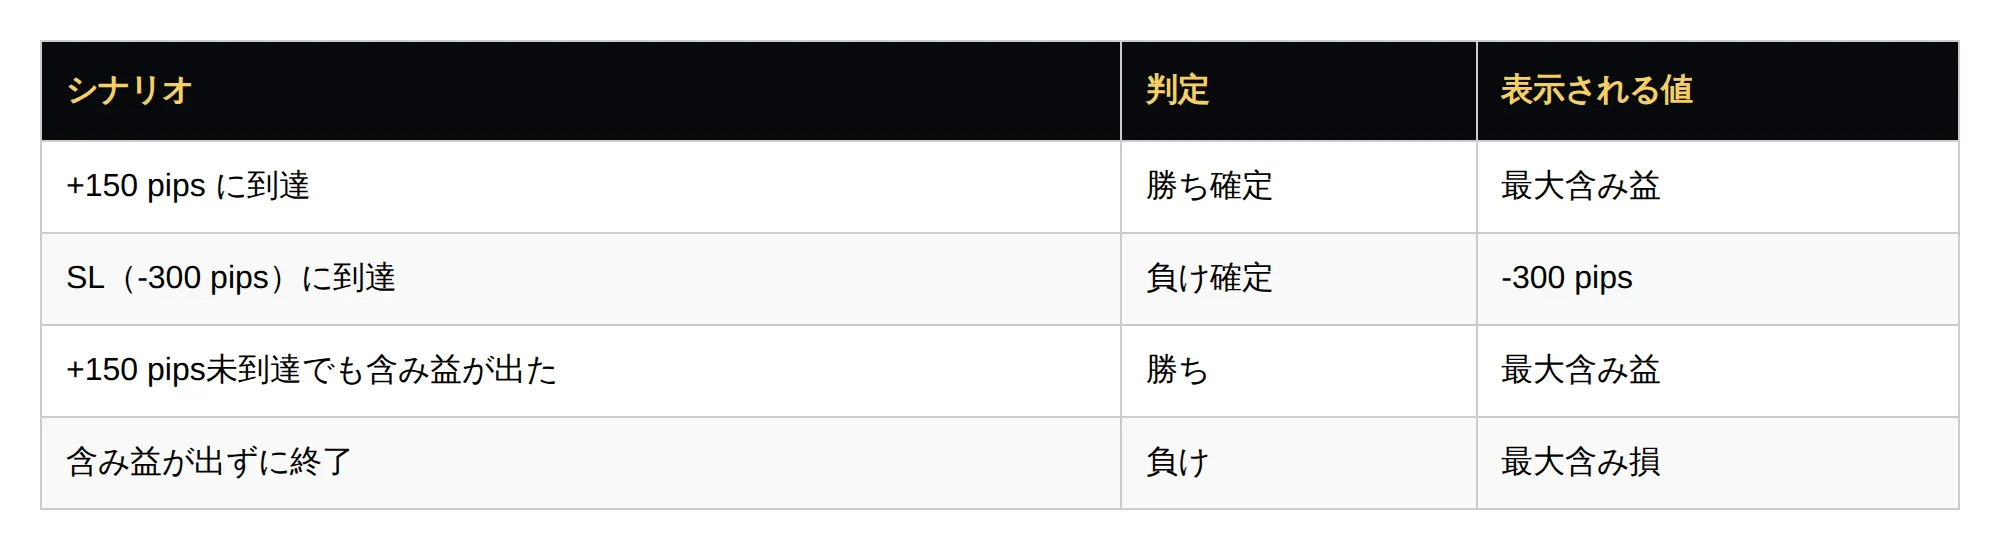
The key point is whether there has been a certain amount of unrealized profit.
This serves as the win/loss benchmark.
- If unrealized profit appears even once →Win (shows max unrealized gain)
- If unrealized profit never appears and there is a loss →Loss (shows max unrealized loss)
In other words, you can accurately determine whether the signal actually “worked” at the moment it did.
●When applying to four signals
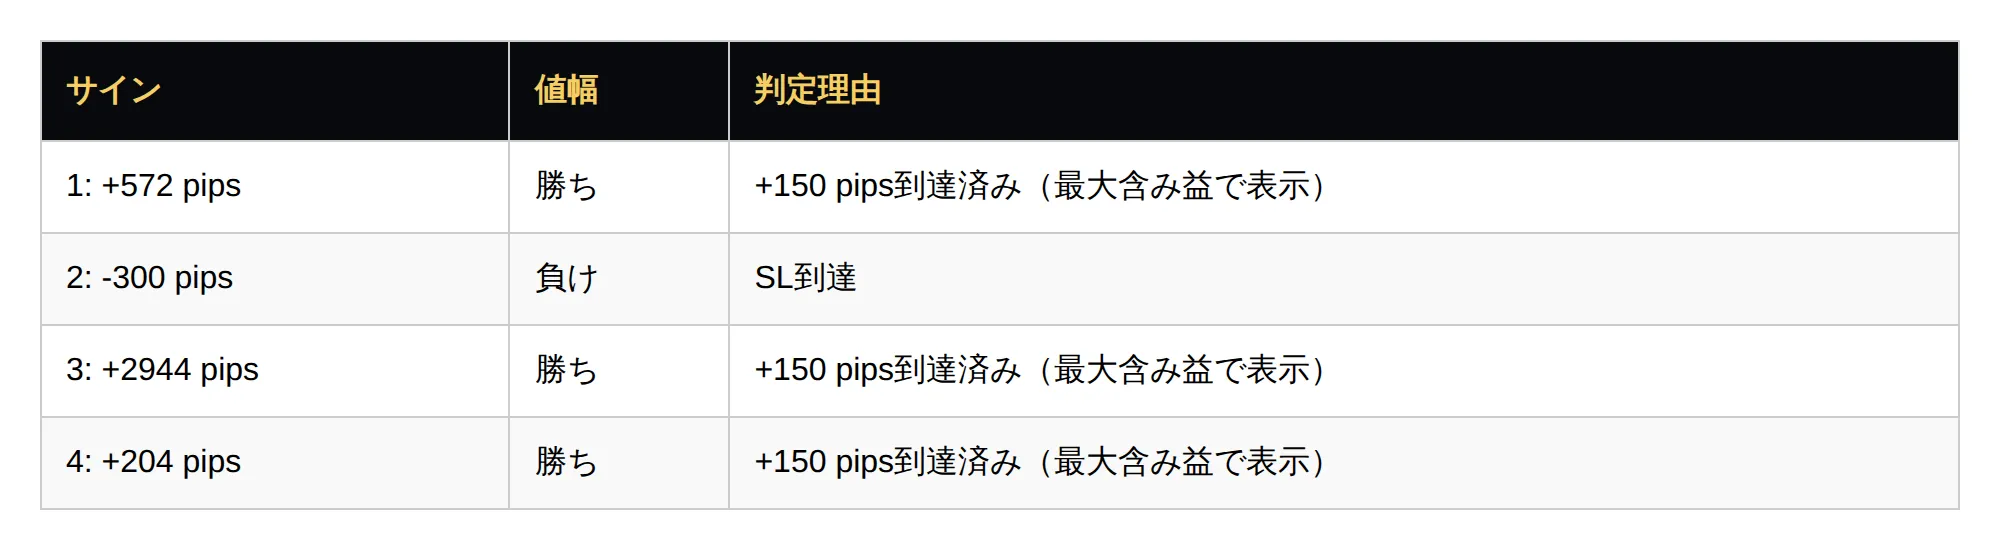
The signal to watch especially is Signal 4 (+204 pips).
Reported as a sufficient profit achievement: +204 pips.
This leads to more accurate edge calculation.
● This is a “verification” tool
Important note:
This panel is merely a developer’s verification tool.
The numbers displayed on the panel do not become your real-trade results.
Because,
Users can freely trade within GOLD STREAM’s edge.
- From a capital management perspective, you can choose to take profits early
- On weekend decisions, you can choose to terminate at “+150 pips before SL”
Therefore, a user’s Exp(R) will differ from this panel’s content.
●So why display Exp(R) on the panel?
Because it is to determine whether there is an edge in the system itself.
If your real trading has recently been losing,
this means:
- There is no edge in the system
- The system has edge, but your exit decisions undermine it
To distinguish these,
the panel visualizes, as expected value, how far you could have reached if you followed the system’s entry signals and the measurement tool’s rules
in other words, it is an indicator to confirm the system’s inherent potential without trader discretion.
- Don’t rely only on high win rate → It is important to look at Exp(R) = 2.85 (risk-reward ratio)
- Look at the total, including losing trades → Even with a single loss, overall profit remains
- Use the panel to confirm the system’s true power → Develop a habit of judging with numbers, not gut feeling
If you have a memory like “I used to take over 3000 pips a month,” have you ever calculated what Exp(R) was then?
Most likely you have never.
You just felt it was winning.
The Exp(R) = 2.85 shown by GOLD STREAM’s panel should become your standard for edge.
If recently your Exp(R) is in the 0.5 to 1.0 range, it may not be the market that changed, but your rules (exit decisions) that changed.
Use this tool weekly to verify the system’s power itself and ensure your discretion isn’t eroding it. That’s the fastest way to reclaim previous winning trades.
GOLD STREAM is not a magic solution that guarantees you’ll win just by having it.
However, it is a tool that lets you verify weekly, with data, whether your own system truly has an edge.
Through that verification, your trading will gradually improve.
I hope the numbers shown on the panel help you form the habit of deciding by data, not feeling.
●Disclaimer
The performance data shown on this blog is based on past validation results.
Past performance does not guarantee future profits.
FX trading carries significant risk. Trade at your own risk and responsibility.
This article publicly shares personal validation results for reference. Investment decisions are your responsibility.
Validation period: 2026-06-08 to 2026-06-12 (1 week) | Sample size: 4 signals