
How to attack this week’s USD/JPY
Gogo-Jeon president Hayakawa and I's interview VTR can be viewed here
There are also free gifts available.
Good morning, everyone.
At the start of the week, the dollar-yen opened the window slightly lower and has moved down a bit.
If it surpasses 160.20, will it become a scenario where it chases last weekend's high?
Since the rise is unclear, I will keep a stance of buying at the low points that overlap with the billion-trader line.
Although the Nikkei fell at the start of last week, it has now recovered to the 68,000 yen level.
Are they raising it up to then bring it down due to a crash?
On a Monday like this, the action is always the same.
Buy at the low, sell high
Sell at the high, buy back cheaply
This is why I watch the Billion Trader Chart & Billion Trader Line, so make it a habit to compare market moves with the Billion Trader chart.
Once you get that habit, you will be able to think, “Wait now,” “Buy or sell from here,”
“Enter a position now”—these obvious things become possible.
Once you can do that, the next step is to verify the results and develop countermeasures.
This repetitive practice, like brushing teeth every day, will greatly influence your results depending on whether you can maintain it.
To tip the odds in your favor, your own actions are the most influential, perhaps?
In a sense, confidence?
maybe.
No one knows the answer, so continue finding your own way to answer, determine what works best, and make it your own.
I believe this is the best trading strategy.
*What works best…
- Breakouts or pullback/retracements; long or short; hedged positions; contrarian strategies—these are all covered by my offerings.
In short, these are tools.
When the tools are fixed, the next step is to build the “method.”
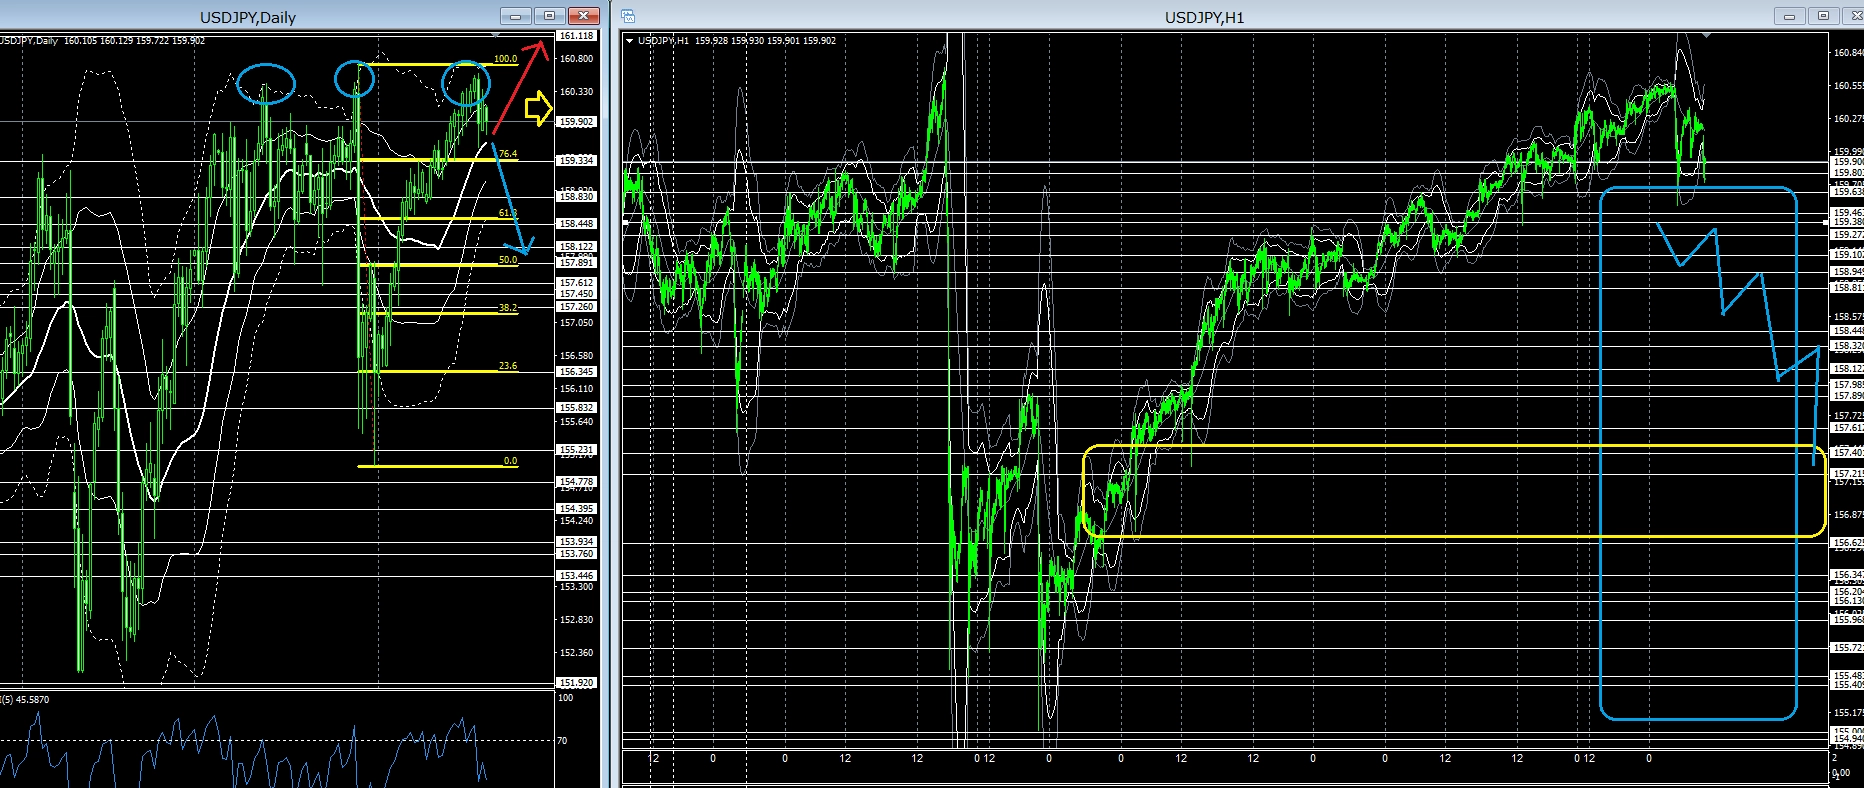
Dollar-Yen MT4 daily chart & 1-hour chart

The daily chart is in a triple-top state.
Will it fall as blue down arrows suggest, rise as red up arrows, or become a range like yellow arrows…
From the MT4 view, it has not yet reached yesterday’s high by 100%.
Well, it’s fine to feel like you’re back near the high area.
The 1-hour chart shows a sharp decline followed by a gradual rise.
The rise will be pursued at cheap levels using the 1-minute Billion Trader Chart.
Timing is at the initial move of buy/sell switching, with stop loss near recent lows.
If possible, I would like to go short.
Because the blue blank zone is large, according to the Billion Trader Chart, a drop to around 15,700 could be expected.
In the case of selling, we would implement Billion Trader Line break sales and reverting sales.
The first retracement after the 1-minute buy/sell switch is a place I want to short.
Changing topics, in the Diet Council, they’re debating raising the食品 consumption tax rate by 1%, and they’re flustered—are they really idiots?
I think so.
Why did they make us obtain a My Number Card? Politicians don’t seem to understand….
Thank you for your continued support today as well.
For those who desperately want to succeed in trading, who wish to make a living from trading, I recommend my product—the trading techniques that can be learned through self-study are these below: