
Don't be misled by noise! Use "L1 Trend Filtering" to grasp the true form of the trend — An easy introduction to MetaTrader 5's new features for beginners
① Quickly explains MetaTrader 5's “Official Features & New Features”
The L1 trend filter is a built-in feature (vector method) newly added to MT5. You don't need to prepare any difficult calculation libraries yourself, and anyone can use it right away.
② A new concept to solve “moving averages are slow”
Aims to clearly capture trend turning points by reducing the typical “lag” and false signals associated with standard moving averages and HP filters.
③ Beginner-friendly with diagrams
We have reorganized the topic, which tends to involve many formulas, so that it can be understood intuitively with conceptual diagrams and comparison charts.
④ Ready to apply directly in practice
Its strength lies in wide applicability, including how to embed it into trend indicators, seven volatility metrics, and four standard strategies (moving average, MACD, ADX, EMA).
⑤ Settings that are reusable
Adopts the idea of “relative parameters (λmax basis),” which can be set with the same sense even if currency pairs or timeframes change. Tuning effort is greatly reduced.
Introduction — What on earth is this about?
When you look at a chart, price often moves in a jagged way.
Because of this jaggedness, experiences like “it started to rise, but soon fell,” or “got caught by a false signal” are common to everyone.
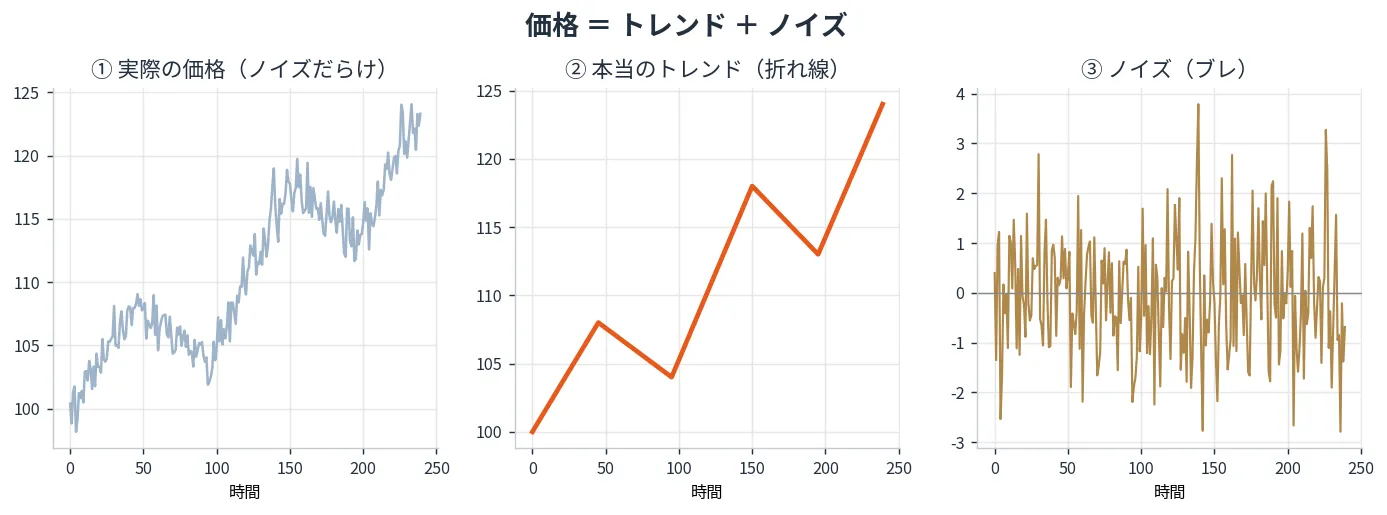
Price movement can be roughly divided into two parts:
- Trend=the real direction of the market (slowly rising, etc.)
- Noise=temporary small fluctuations (up and down)
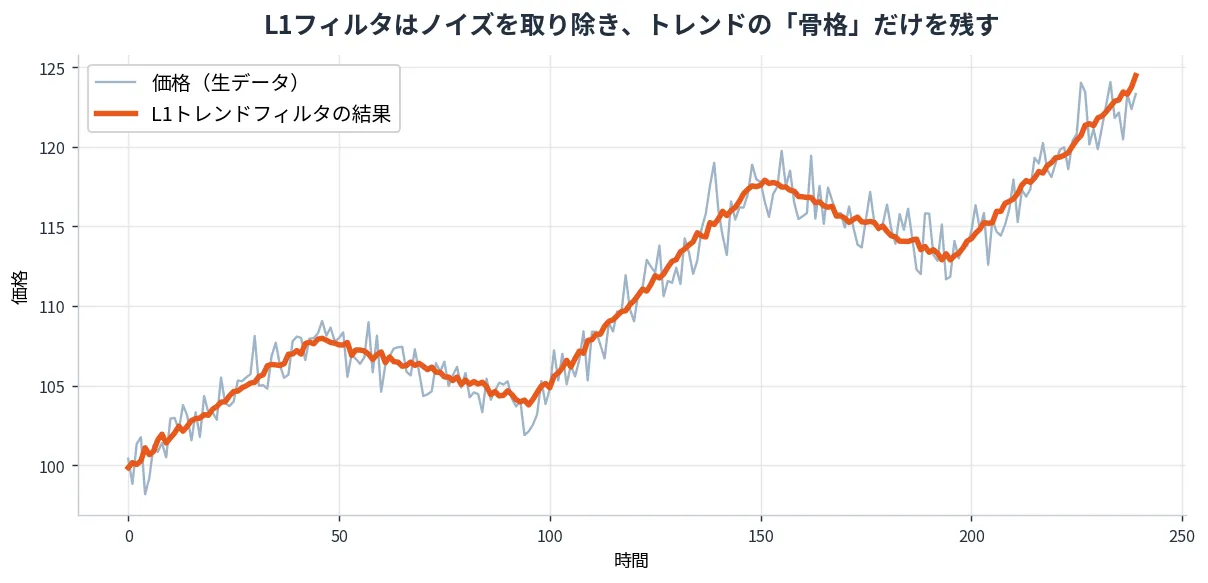
L1 Trend Filteringis a method to effectively remove this “noise,”extracting only the backbone of the trend.
Moreover, rather than merely smoothing,it clearly preserves turning points the moment the trend changes.
Now, let’s look at it in five steps.
1. What is L1 Trend Filtering? — A tool to reduce noise
First, start from the idea that price = trend + noise.
As in the diagram below, within the messy price (①), there is a trend (②) indicating the real direction and noise (③) which consists of small fluctuations.
L1 Trend Filter extracts from raw price data (thin line) only the backbone of the trend, like the thick orange line.Only the trend’s backbone.
Without being swayed by noise, it becomes easier to see which direction the market is currently facing.
And here is the most important point.
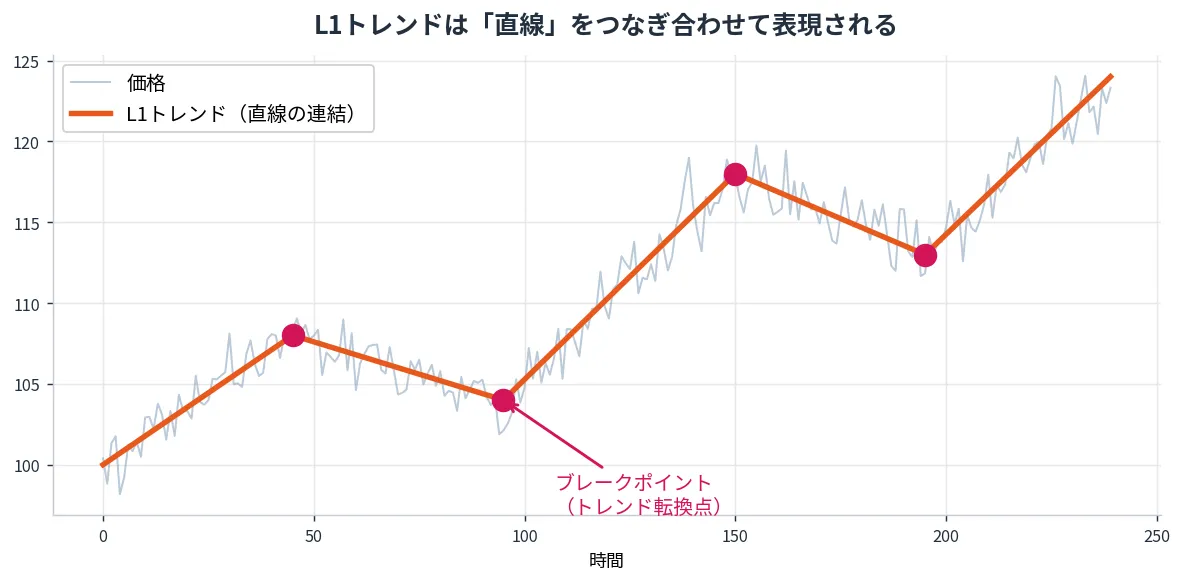
L1 Trend is not a smooth curve, butan assortment of straight lines connected by cornersto represent the trend.
The junctions between straight lines (the red points in the figure below) are the “breakpoints = turning points of the trend.”
It is an image of mechanically identifying the place where the market’s flow changes.
2. Differences from Moving Averages — Why it’s less delayed
You might think, “If you want to see the trend, moving averages should be enough.”
However, moving averages have a weakness:they react slowly.
Because they average over the past, it takes time for the line to catch up even if the market has already changed direction.
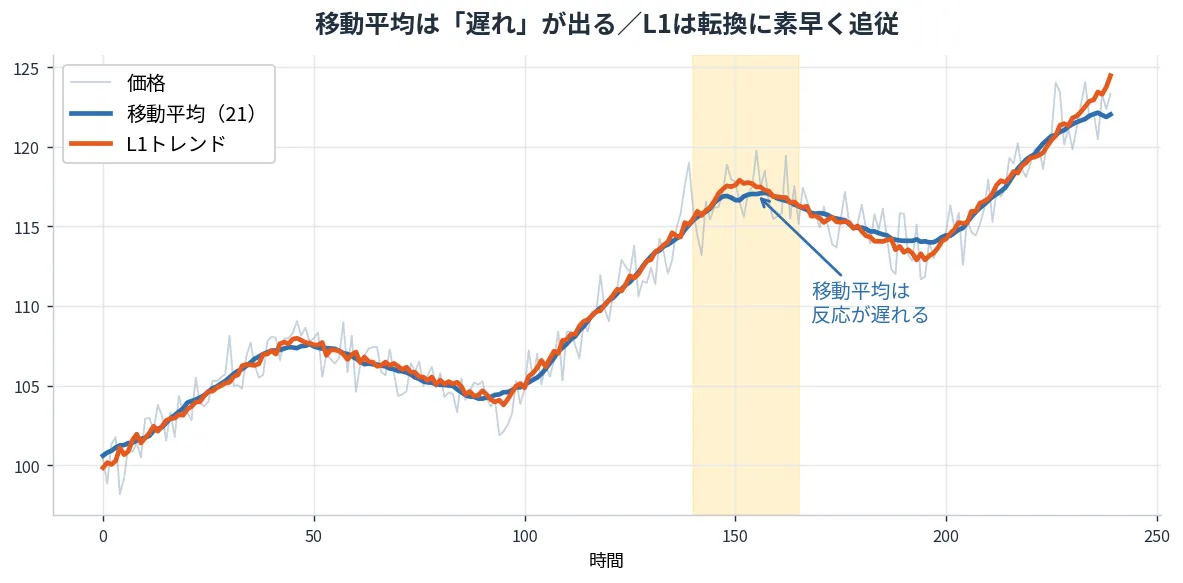
In the diagram below, the moving average (blue) lags in responding to a trend change, while the L1 Trend (orange) follows more quickly.
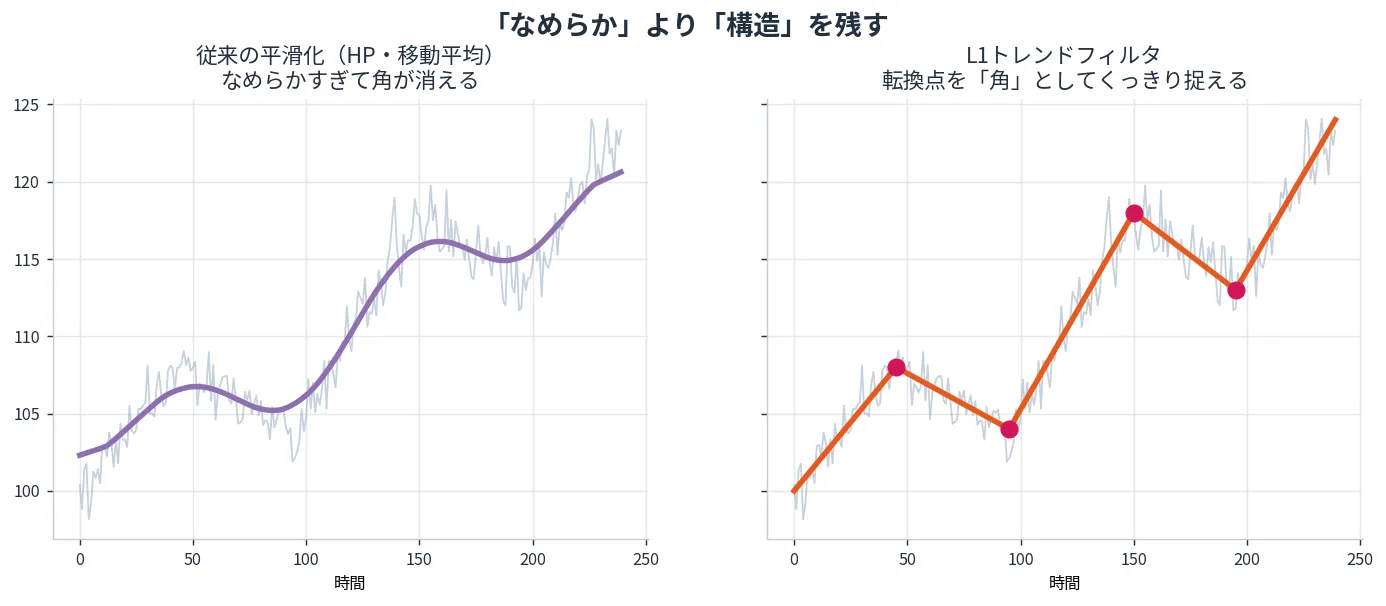
Also, traditional methods like moving averages and HP filters prioritize smoothness, which can erase the “corners” of the trend and make turning points unclear.The trend’s corners disappear, and turning points can become ambiguous.
On the other hand, L1 Trend preserves turning points as “corners.” It prioritizes the market’s structure over smoothness.
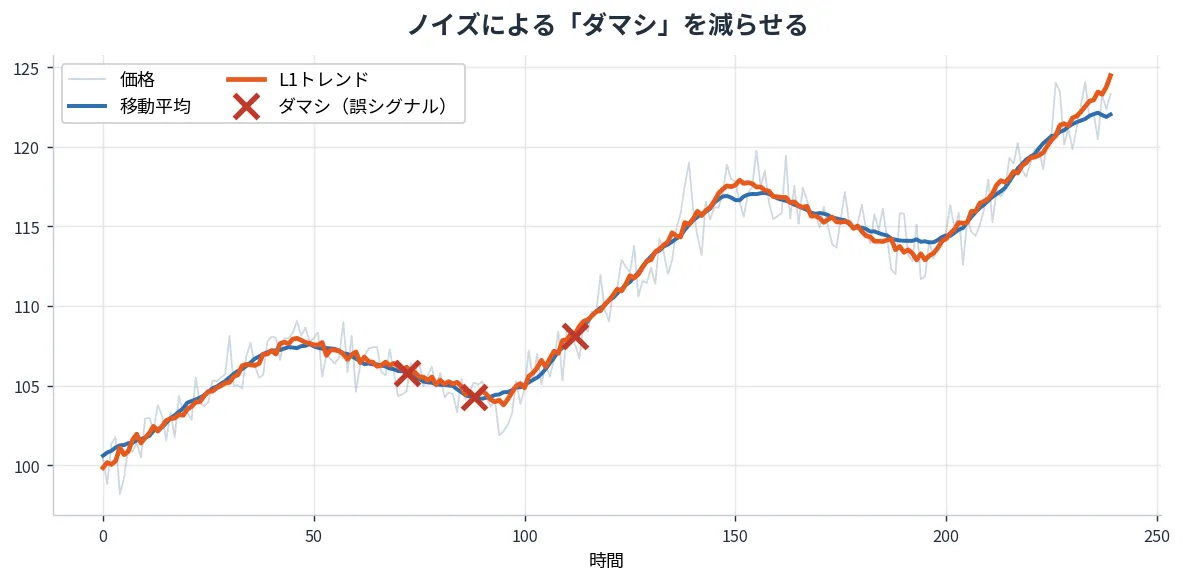
Because of this property, it is easier to reduce false signals caused by noise.
The crosses in the figure below show examples where moving averages reacted to noise (false signals). L1 Trend is less susceptible to such small fluctuations.
3. How to use λ (Lambda) — Decide the roughness of the trend
L1 Trend Filter has one important setting calledλ (Lambda).
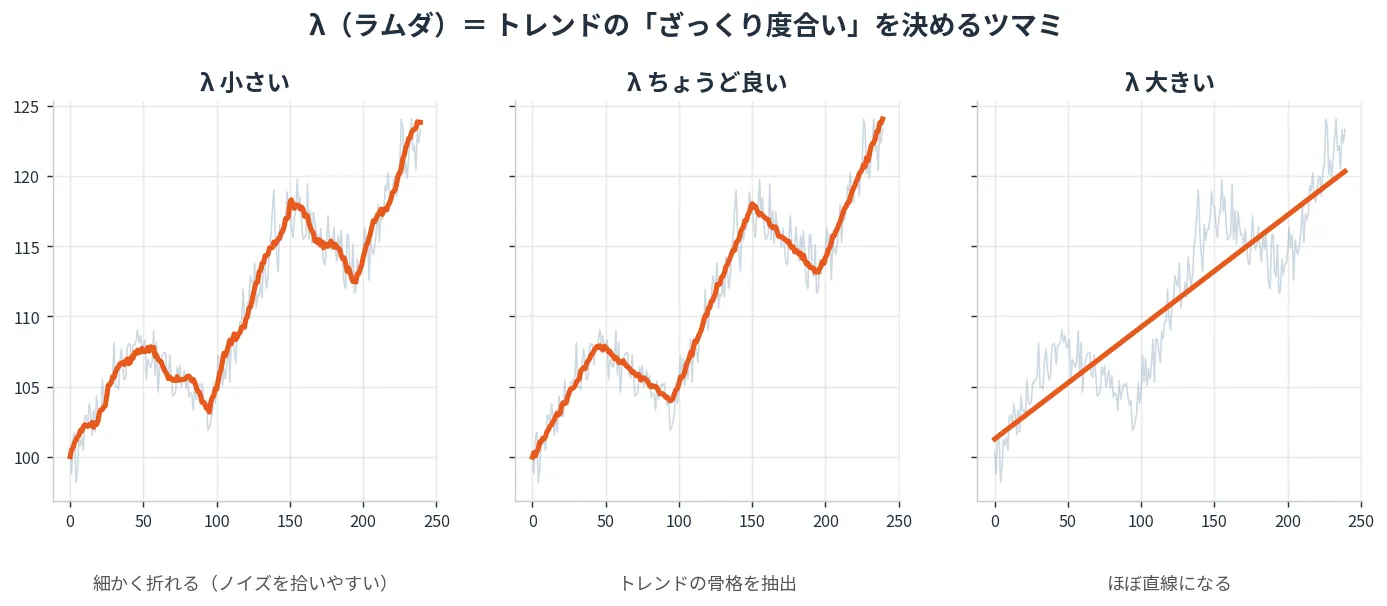
Think of this as the knob that decides how roughly you capture the trend.
- If λ is small: makes the line bend more (picks up more noise)
- If λ is just right: cleanly extracts the backbone of the trend
- If λ is large: reduces the number of bends, approaching a single straight line
However, the “just right” value of λ tends to vary by currency pair and timeframe.
Therefore, this method uses a convenient approach called setting based on a reference value called λmax (lambda max).
For example, if you specify “10% of λmax (0.1),”you can reuse the same setting across different markets and timeframes.
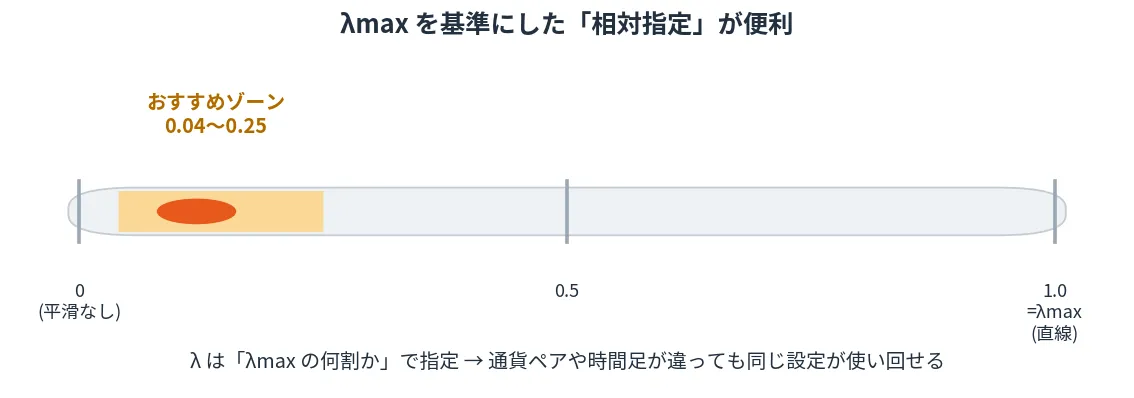
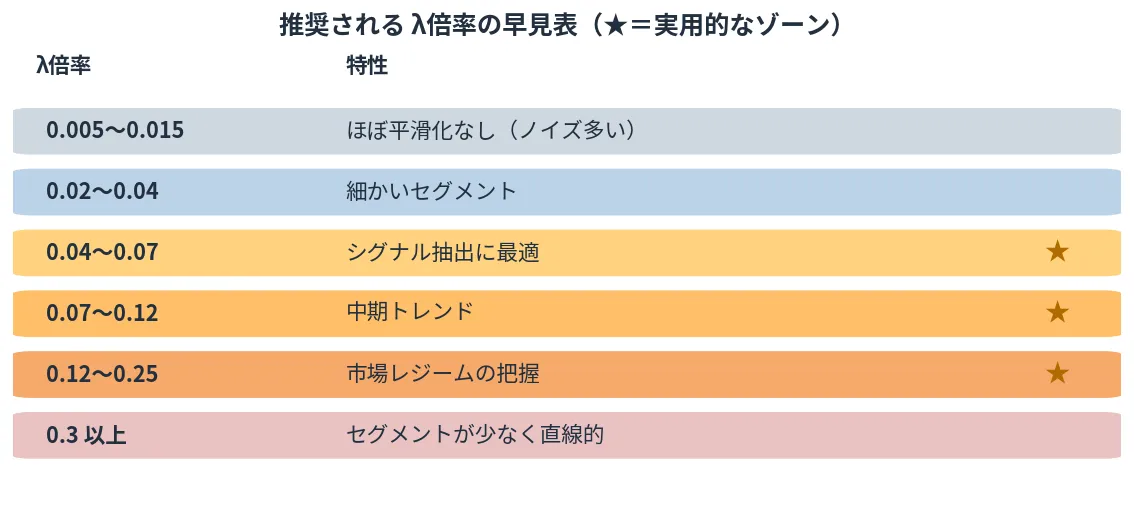
As a practical guideline, the original article provides the following quick reference table.
In practice, roughly0.04〜0.25zone (★ mark) is typical. It’s recommended to start trying around here.
4. Volatility and regime detection — Reading the market’s state
Another useful application of L1 Trend ismeasuring volatility (price movement intensity).
The method is simple.
Look at the divergence (residual) between the actual price and the L1 trend.
If the divergence is small, the market is calm; if it’s large, it’s volatile.
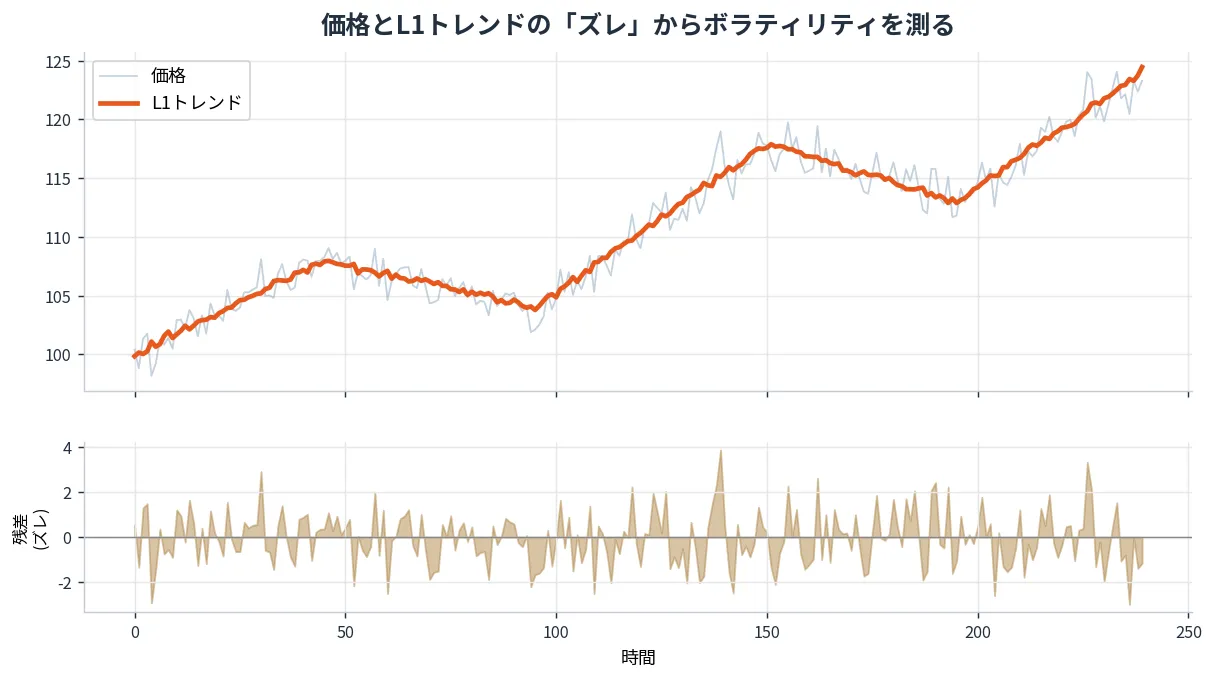
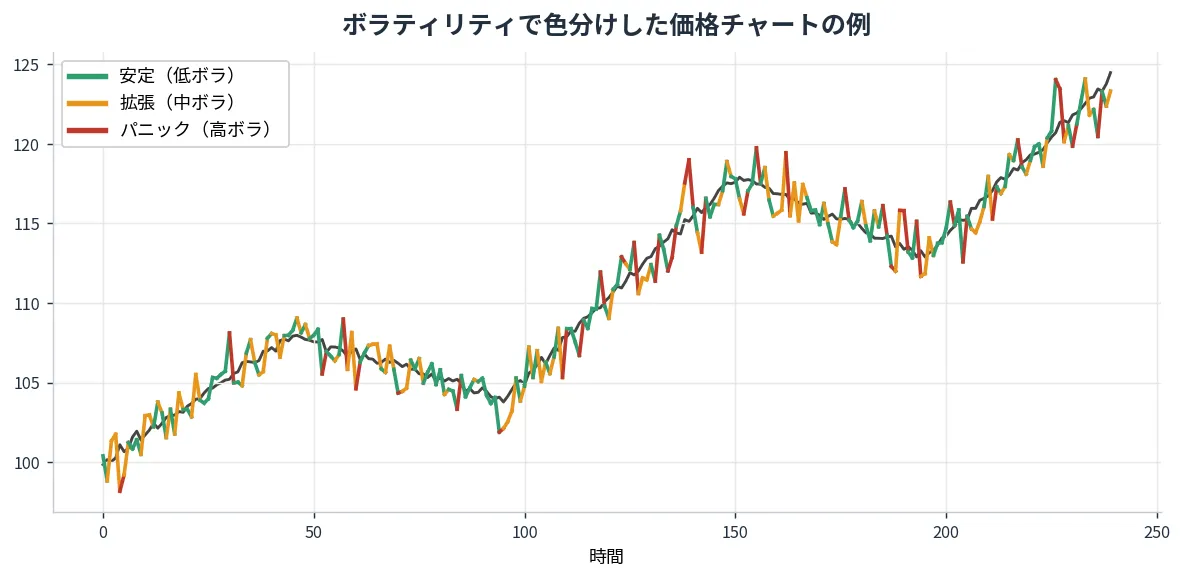
Using the magnitude of this divergence, you can classify the market state (regime).
The original article describes categorizing into phases such as “range / trend / expansion / panic.”
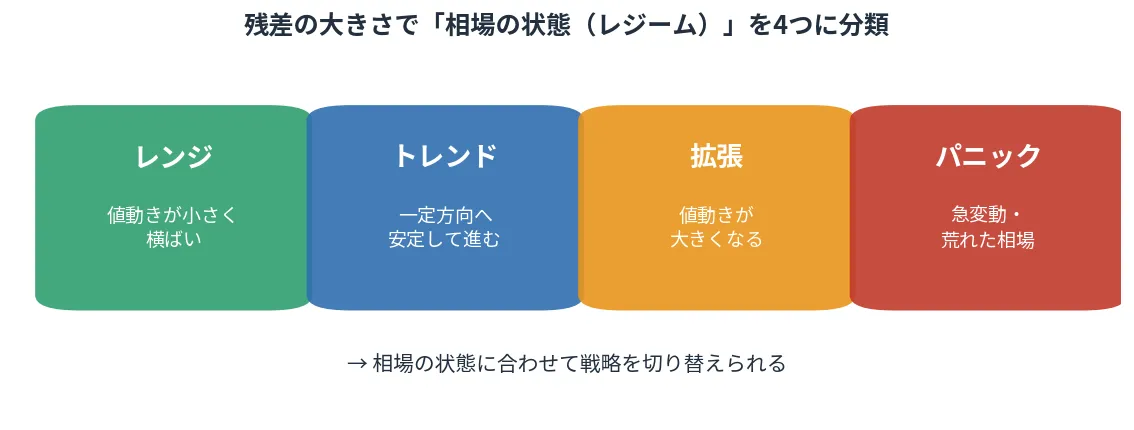
Knowing the market state makes it easier to act according to the situation, for example “be aggressive when calm and cautious when volatile.”Contextual stance.
Below is an example where price is color-coded by volatility. Green = stable, orange = expansion, red = panic. It shows at a glance what kind of market it is now.
5. Application to trading strategies — using it as a “filter”
Finally, how to use it in actual trading.
The most practical use of the L1 Trend is tofilter buy/sell signals.
The flow is simple.
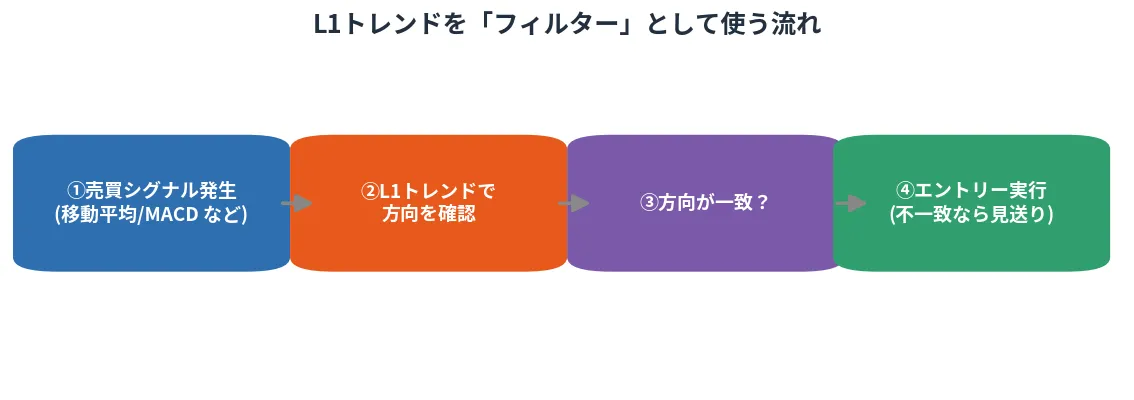
When moving averages, MACD, etc., generate a signal,check if the signal aligns with the L1 Trend direction, and enter only when they match. If the directions do not align, you skip it.
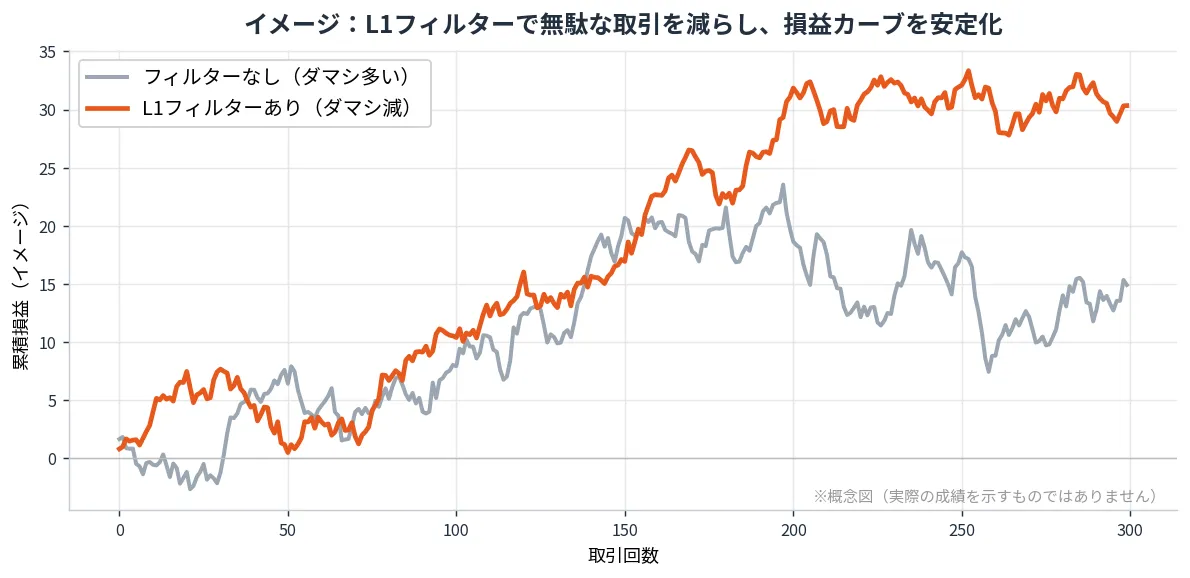
By adding this extra step, you can reduce wasted trades that go against the trend (false signals) and stabilize the profit/loss curve.
Note: The figure below is only an illustrative diagram and does not guarantee any performance.
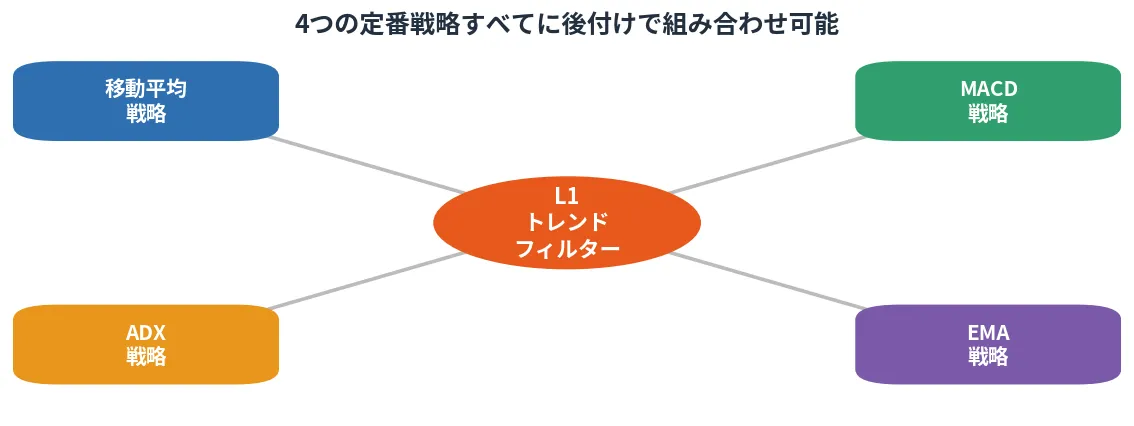
Moreover, this filter is not limited to a specific method.
In the original article,it is tested with all four classic strategies: moving average, MACD, ADX, EMA, applying it as an afterthought to each.
It’s nice that you can try it by simply adding it to strategies you already use.
Conclusion — Who L1 Trend Filter is suited for
Finally, here is a recap of the content so far.
- Divide price into “trend + noise,”extract only the backbone of the trend
- Less lag than moving averagesand clearly capture turning points
- λ (especially relative λmax specification)allows easy adjustment of roughness
- Read volatility and market state from the divergence with price.
- Can be added as a filter to existing strategiesafter the fact
“Struggling with false signals,” “want to know turning points earlier,” “wish to add a tweak to your current method” —
for such people, L1 trend filtering is a new tool worth trying.
First try around λ multiplier 0.04–0.25 on your charts to observe the movement.