
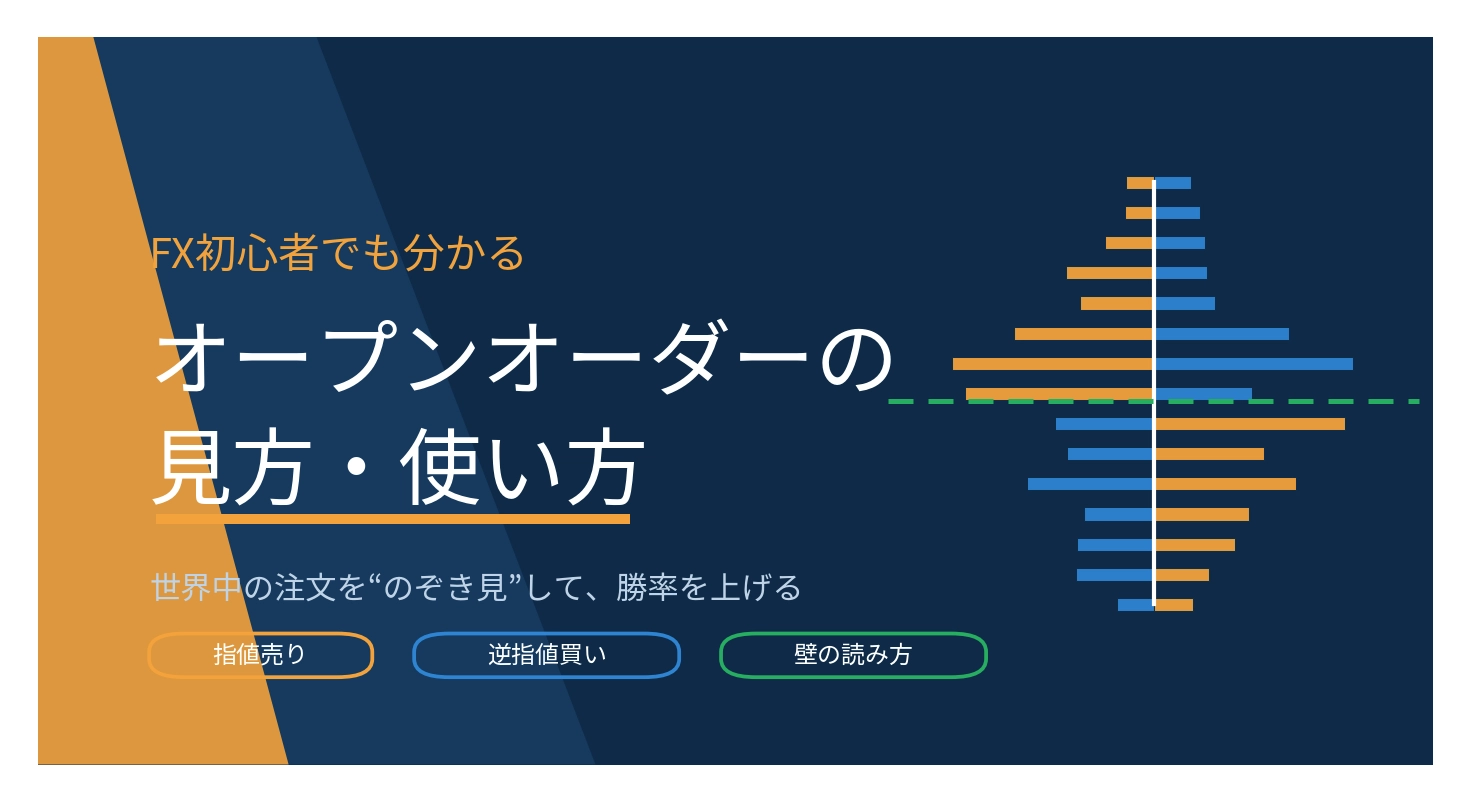
[FX for Beginners] How to Read and Use Open Orders - Peek at Orders Worldwide to Increase Your Win Rate
────────────────────
① What is Open Order?
Open order is, in a word—
“A graph of orders from traders all over the world who want to sell or buy at this price.”
.
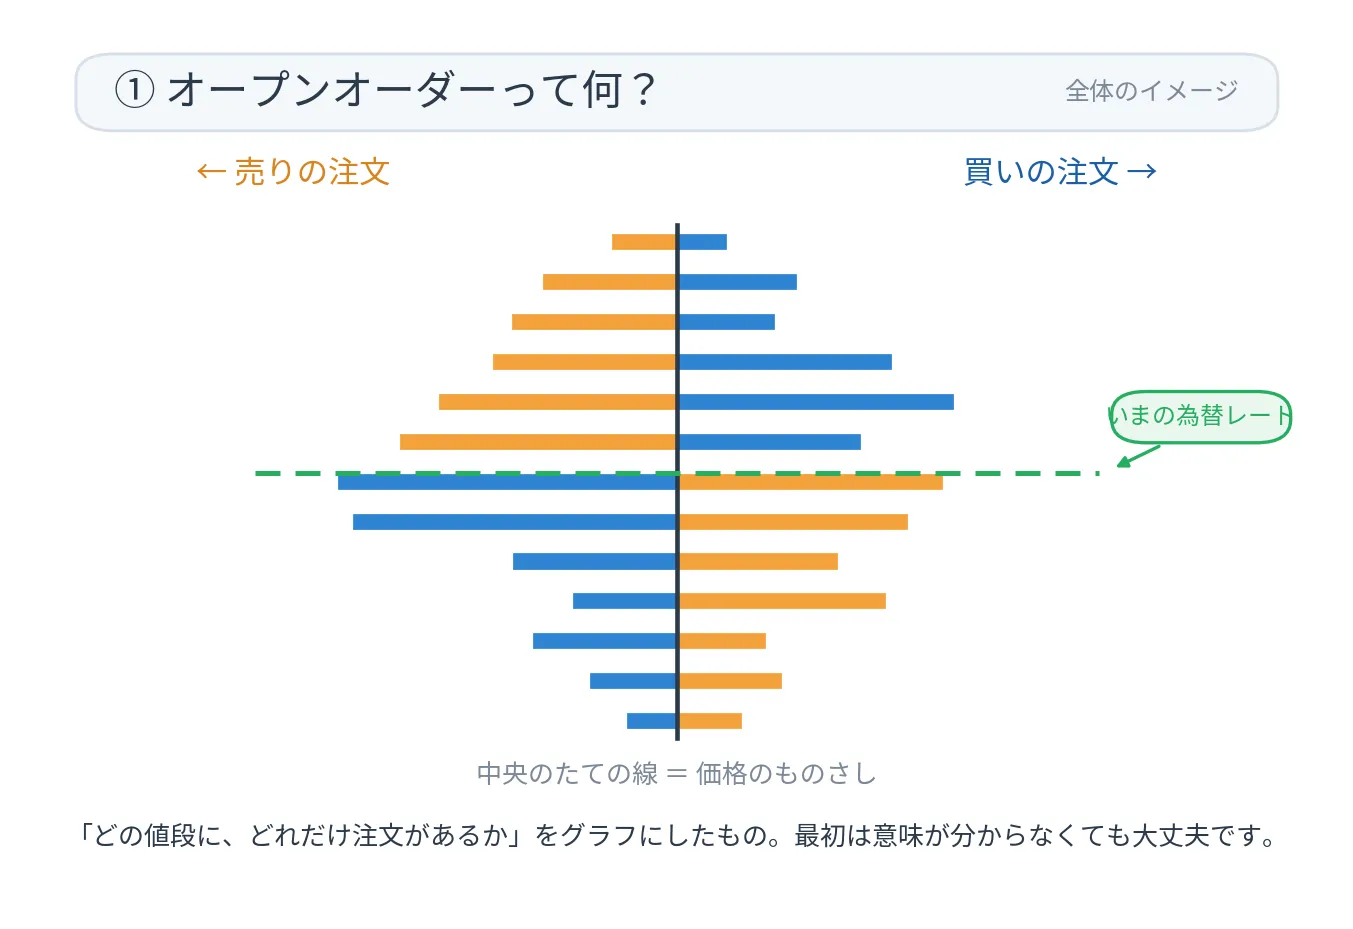
Even if you look at the graph suddenly, at first you may think, “I don’t quite understand…”.
But don’t worry. From now on, we’ll explain it slowly, step by step.
〔You are connected to someone across the sea〕
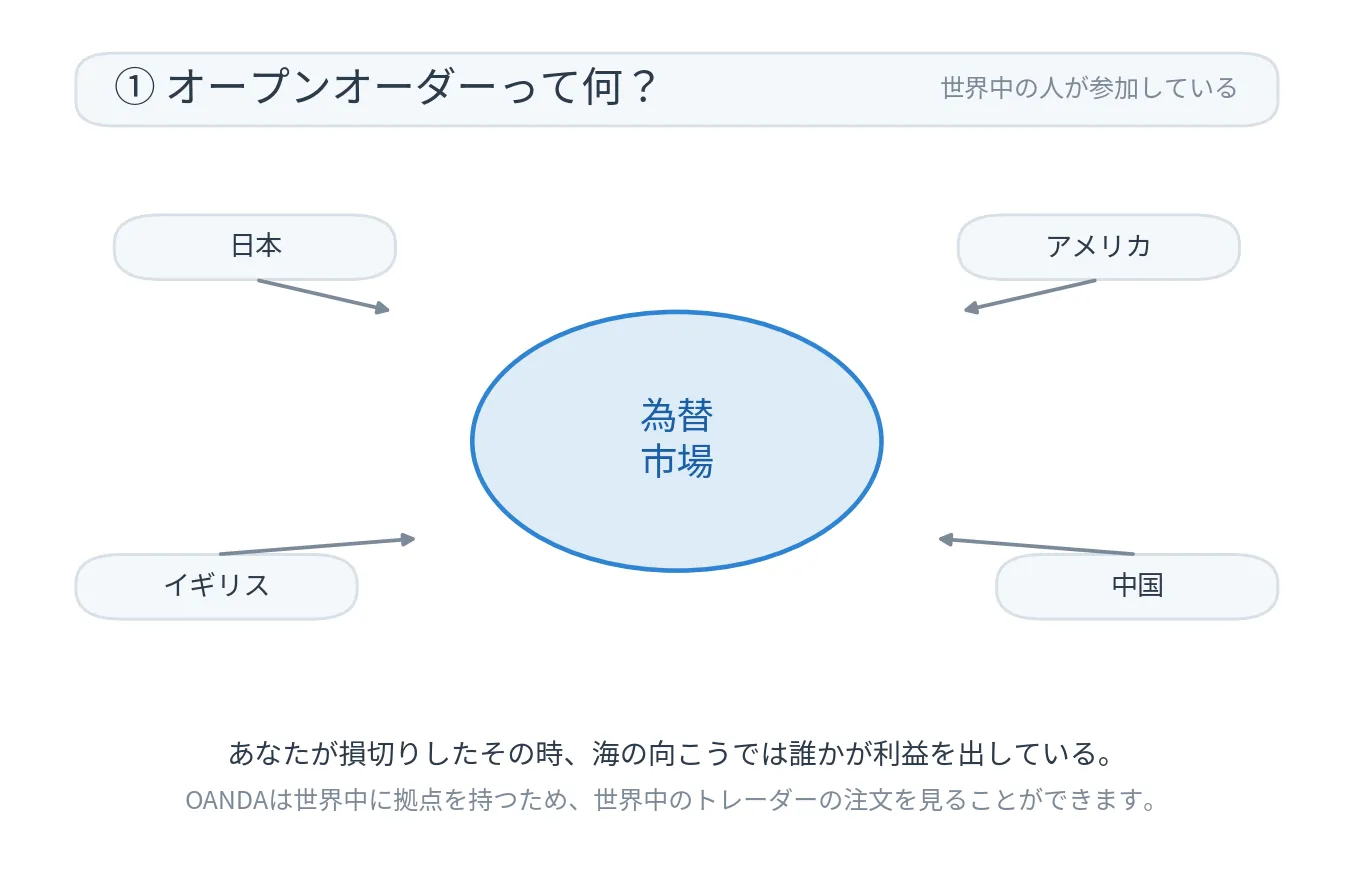
FX is not something only Japanese people do.
Americans, Britons, Chinese—people from all over the world participate in the same market.
The moment you take a loss, somewhere across the sea someone else is locking in a profit.
That is happening in real life.
The foreign exchange market moves mainly in the Western world, such as New York and London.
That’s why it’s not enough to only look at Japanese movements.
Knowing how participants around the world intend to move is the shortcut to increasing your win rate.
OANDA (OANDA) is an FX company with bases worldwide, so
you can see orders from traders all over the world with this open order.
〔Until orders become one graph〕
Open orders are created in the following flow.
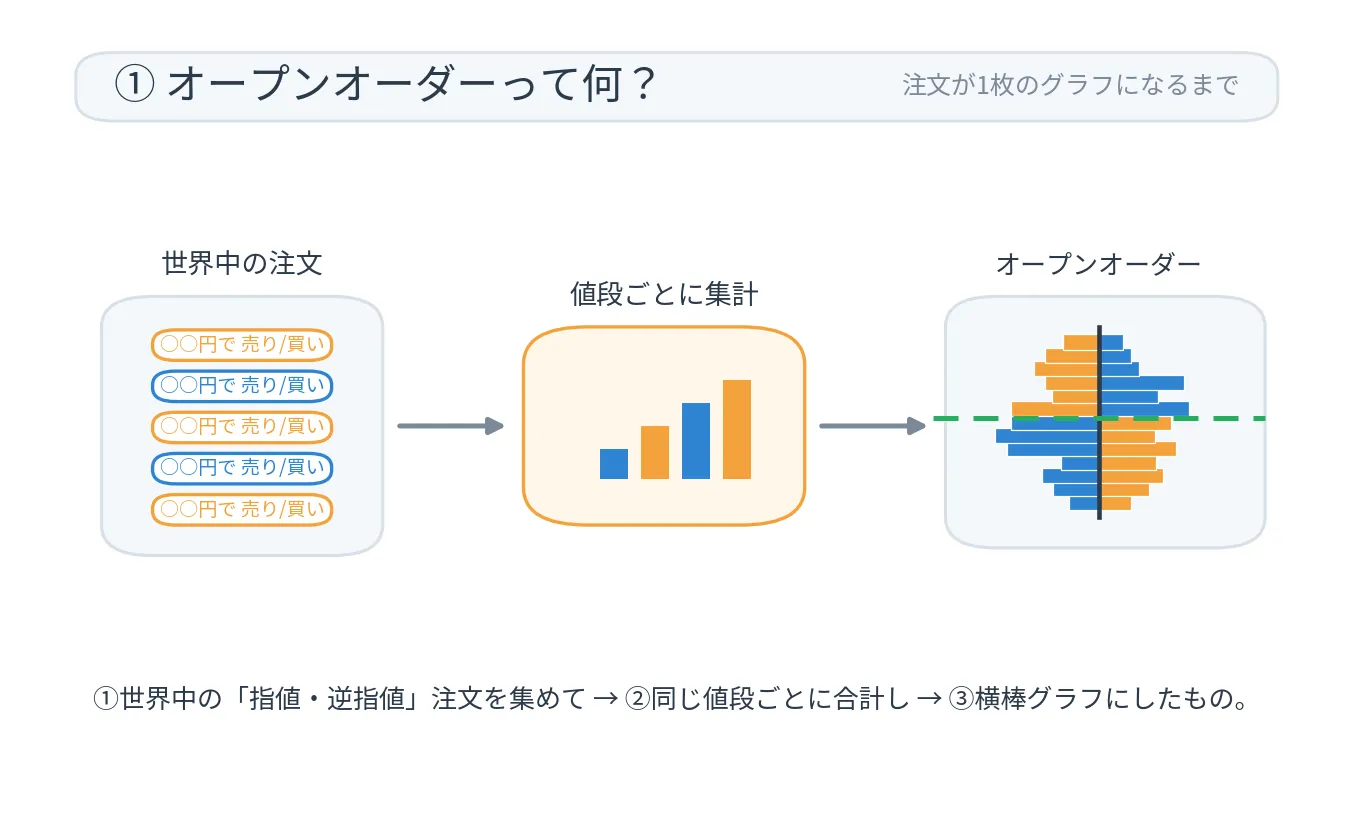
① Gather orders from around the world: limit orders and stop orders
② Sum them for each price
③ Make a horizontal bar graph out of them
That’s all there is to it.
You can immediately tell “at which price how many orders have piled up.”
────────────────────
② Four kinds of orders that appear on the graph
Open order graphs show, in large part, four kinds of orders and the current exchange rate.
And what’s important is—the meaning is determined by where the orders are displayed.
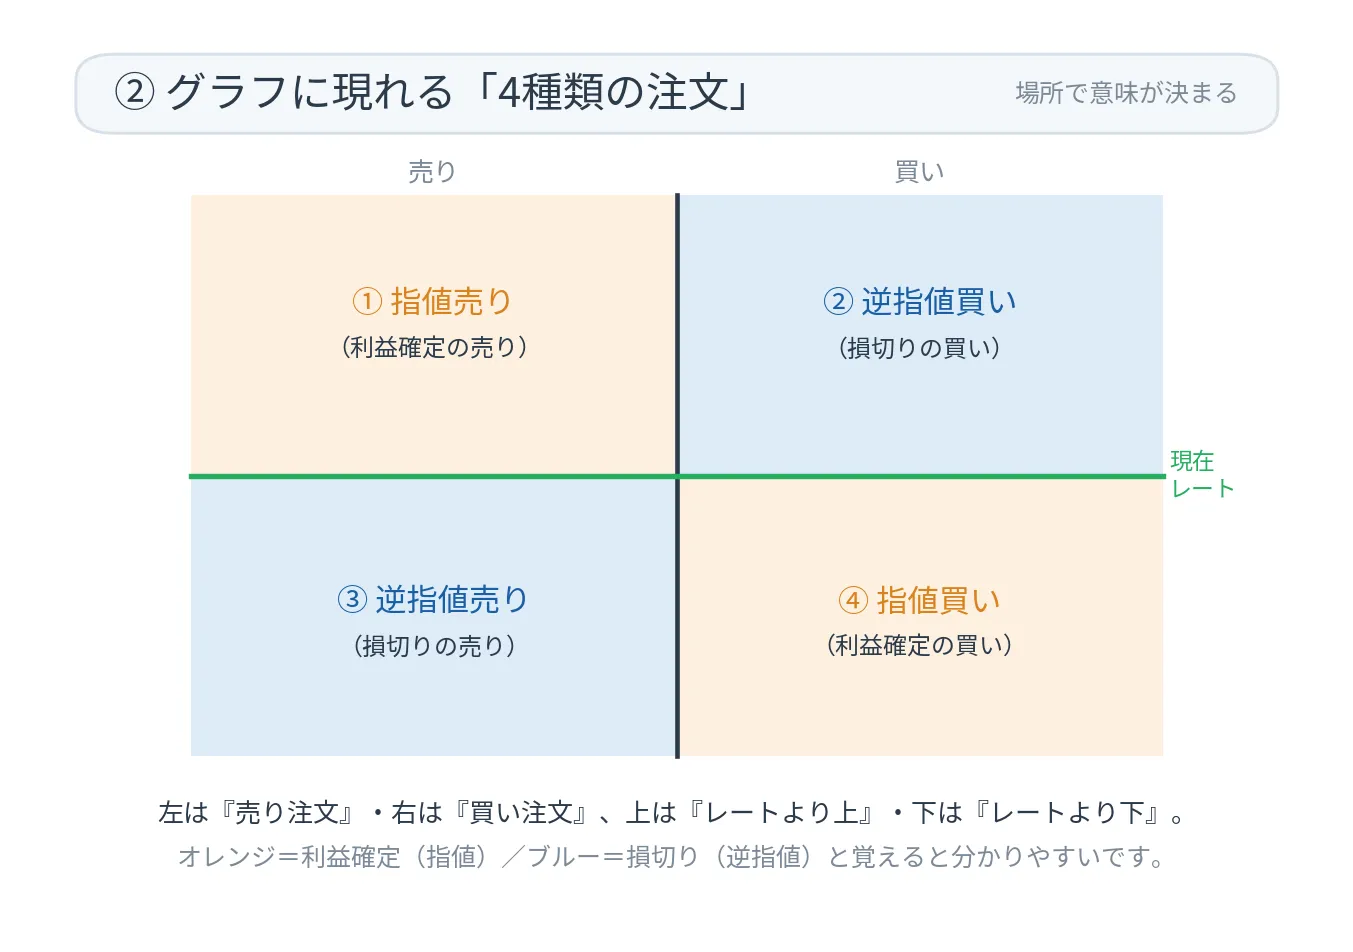
The viewing rules are very simple.
・Left is sell orders, right is buy orders
・Above is prices higher than the current rate, below is prices lower than the current rate
・Orange is take-profit orders (limit orders), blue is stop-loss orders (stop orders)
With this combination, you get four types.
〔Orders arranged “above” the rate〕
Who would place orders above the current rate?
Let’s look at concrete characters.
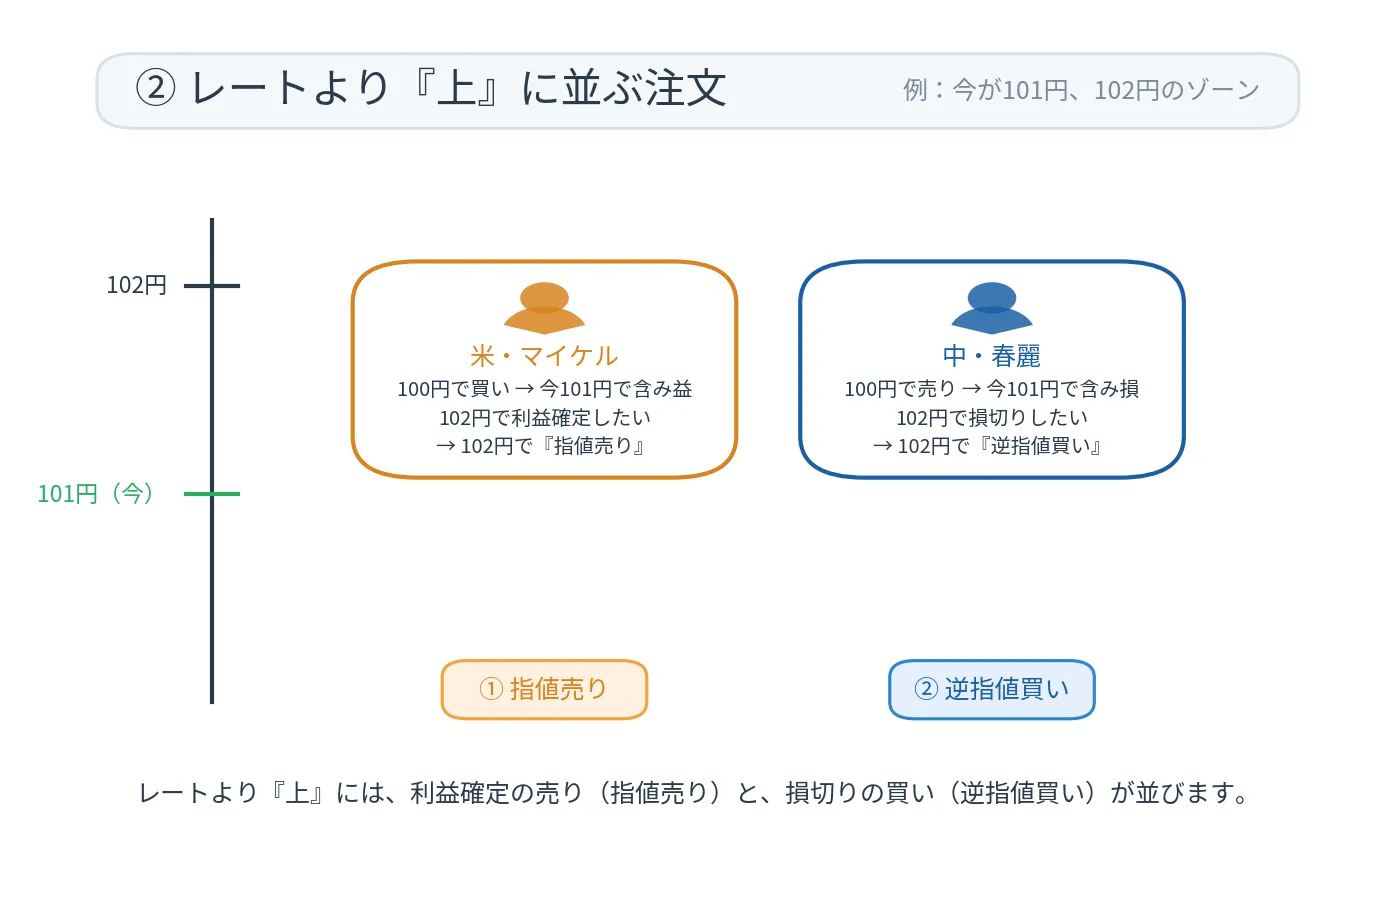
Michael in the United States buys at 100, now at 101. He has unrealized profit.
Thinking, “If it rises to 102, I want to lock in the profit,” he placed a take-profit order to sell at 102 (top left, orange).
Chunlei in China sells at 100, now at 101. He has unrealized loss.
Thinking, “If it rises to 102, I’m afraid of more loss, so I’ll cut losses,” he placed a stop-buy order at 102 (top right, blue).
〔Orders arranged “below” the rate〕
Next, look below the current rate.
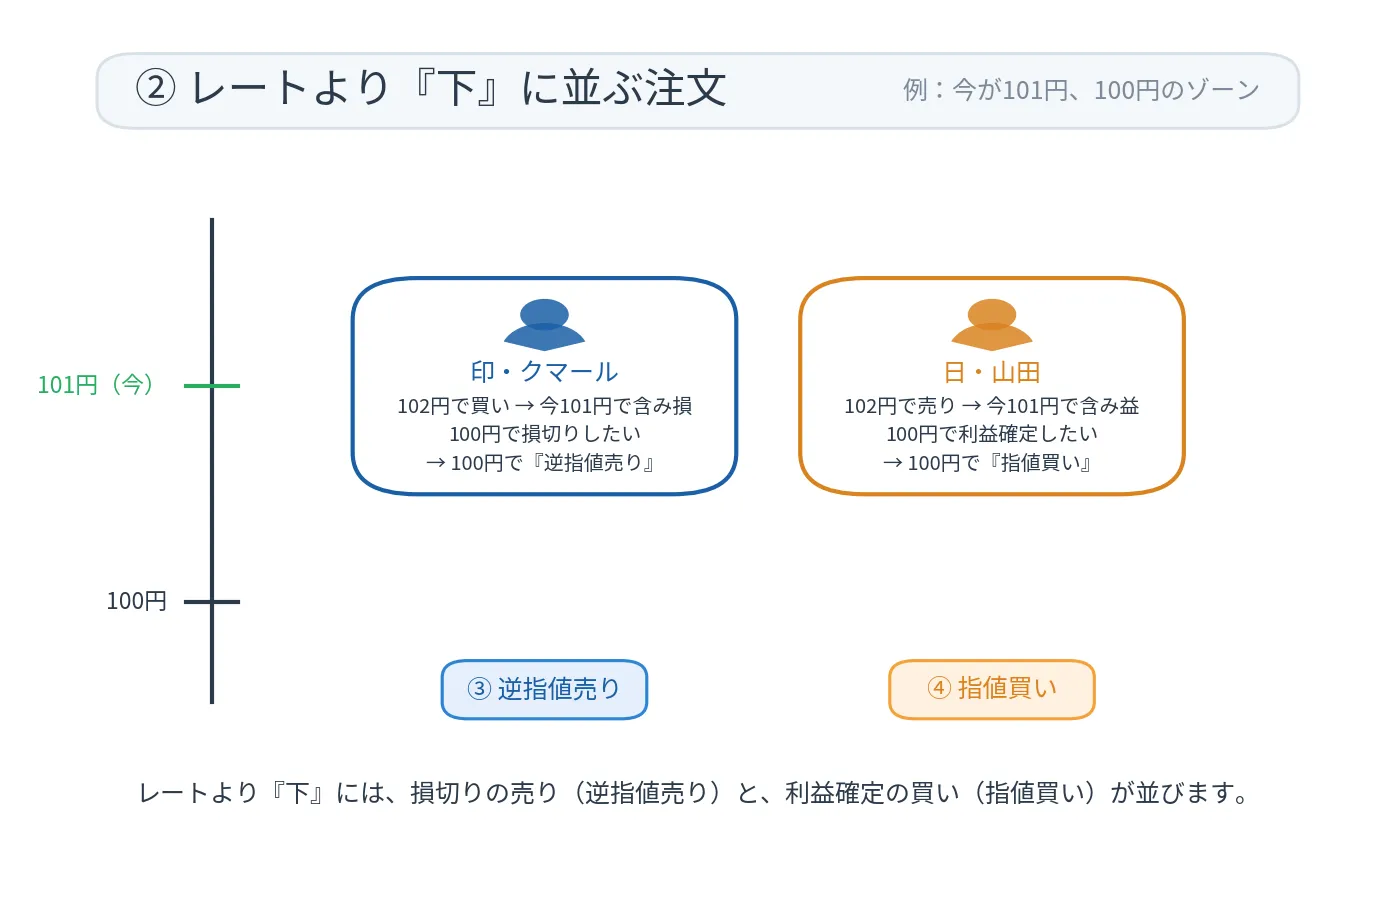
Kumar from India buys at 102, now 101. He has unrealized loss.
“If it drops to 100, I’ll cut losses,” he places a stop-sell order at 100 (bottom left, blue).
Yamada from Japan sells at 102, now 101. He has unrealized profit.
“If it drops to 100, I want to lock in the profit,” he places a take-profit order to buy at 100 (bottom right, orange).
〔Summary of the four types〕
This is summarized in a table. If you remember only this, you’re fine.
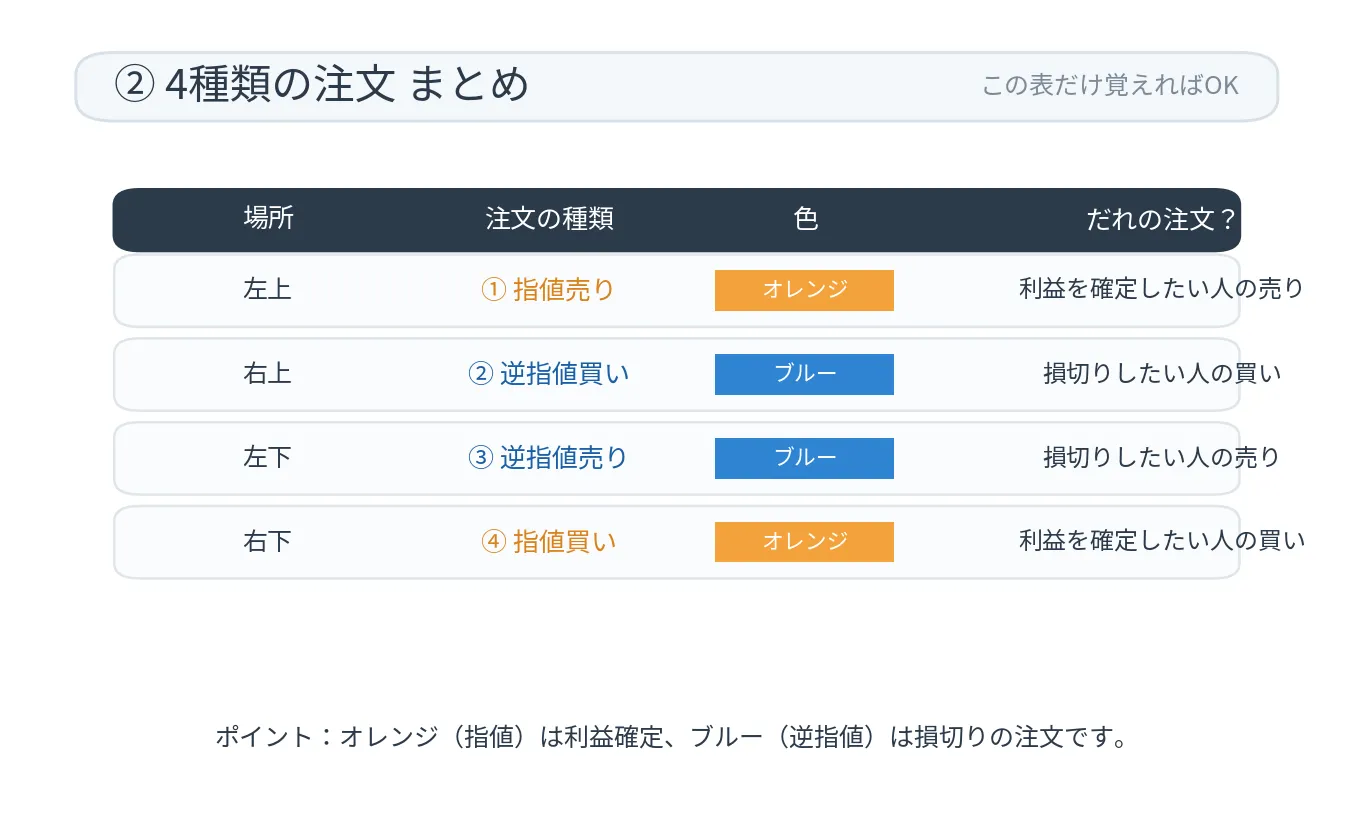
Two key points.
Orange (take-profit) = profit-taking orders, Blue (stop) = loss-cutting orders.
If you remember this, you’ll be able to read the meaning of the graph smoothly.
────────────────────
③ How to use it to raise your win rate
Once you understand the view, it’s time to apply it in real trading.
There is only one central idea.
“Prices with many orders tend to act as a ‘wall’ to price movement.”
If there are many buy orders at a certain price,
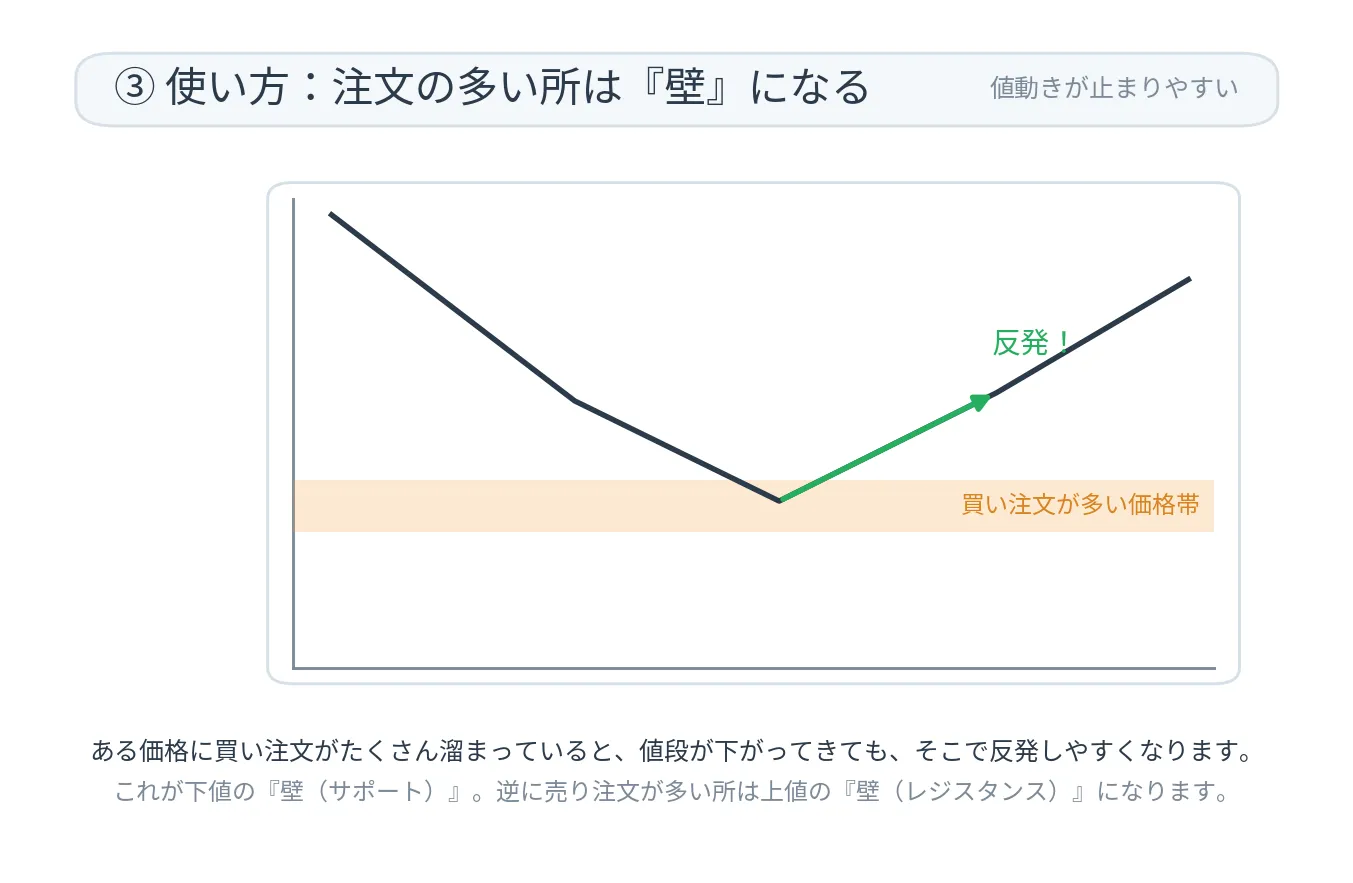
even if the price falls, those buys can support it and cause a rebound.
This is the lower bound “wall,” known as support.
Conversely, prices with many sell orders form the upper wall, known as resistance.
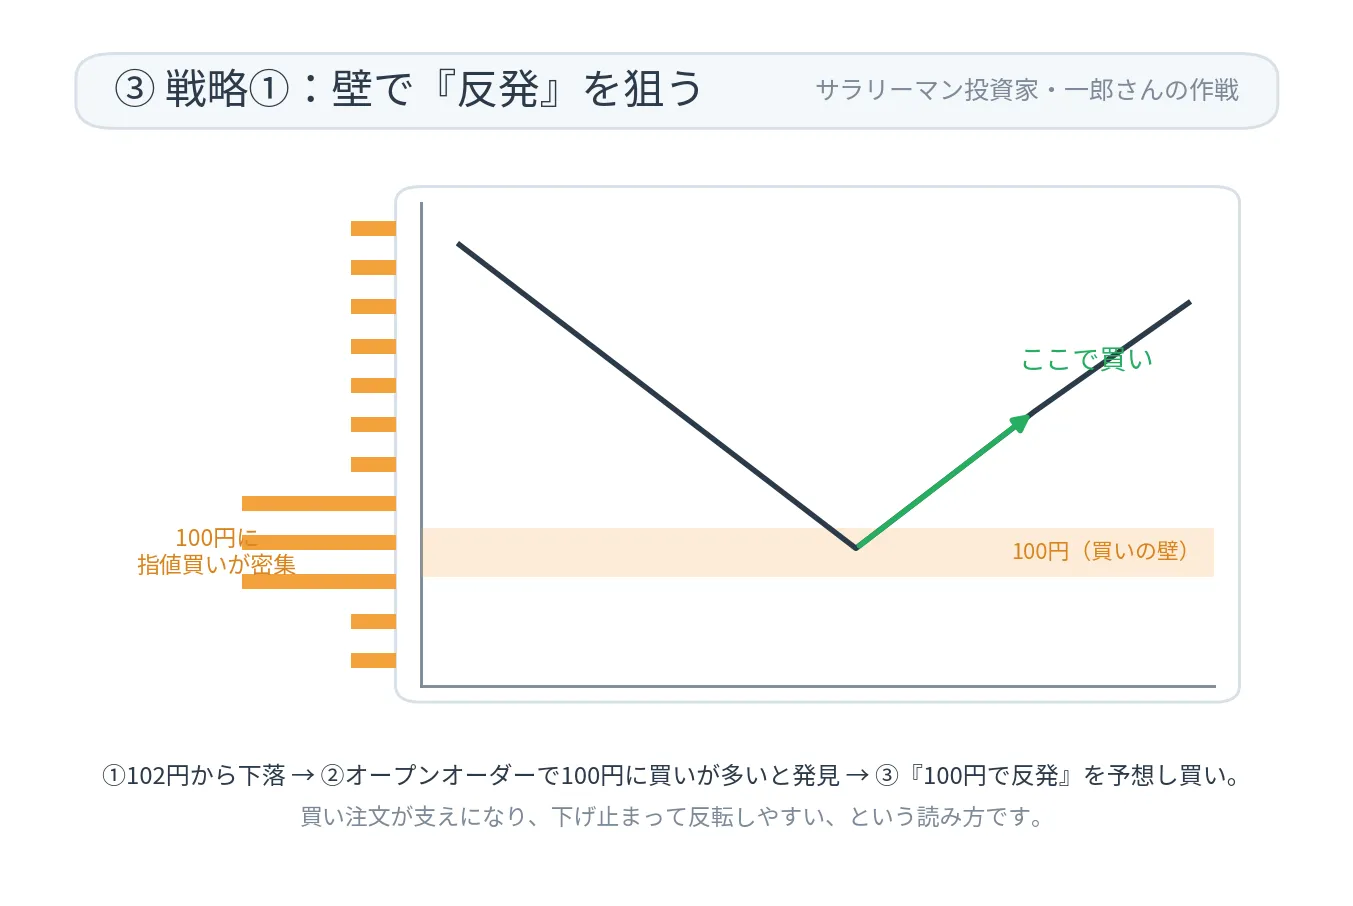
Let’s look at the plan of a salaryman investor, Ichiro.
① That day, USD/JPY was sliding from 102.
② When Ichiro looks at open orders, he notices many buy orders at 100.
③ “If there are many buys, it might rebound at 100 even if it falls. So I’ll buy aiming for the rebound.”
Using buy walls as a point where price tends to stop falling.
〔Strategy ②: If the wall is broken, aim for acceleration〕
Now it’s the plan of Mama investor Midori.
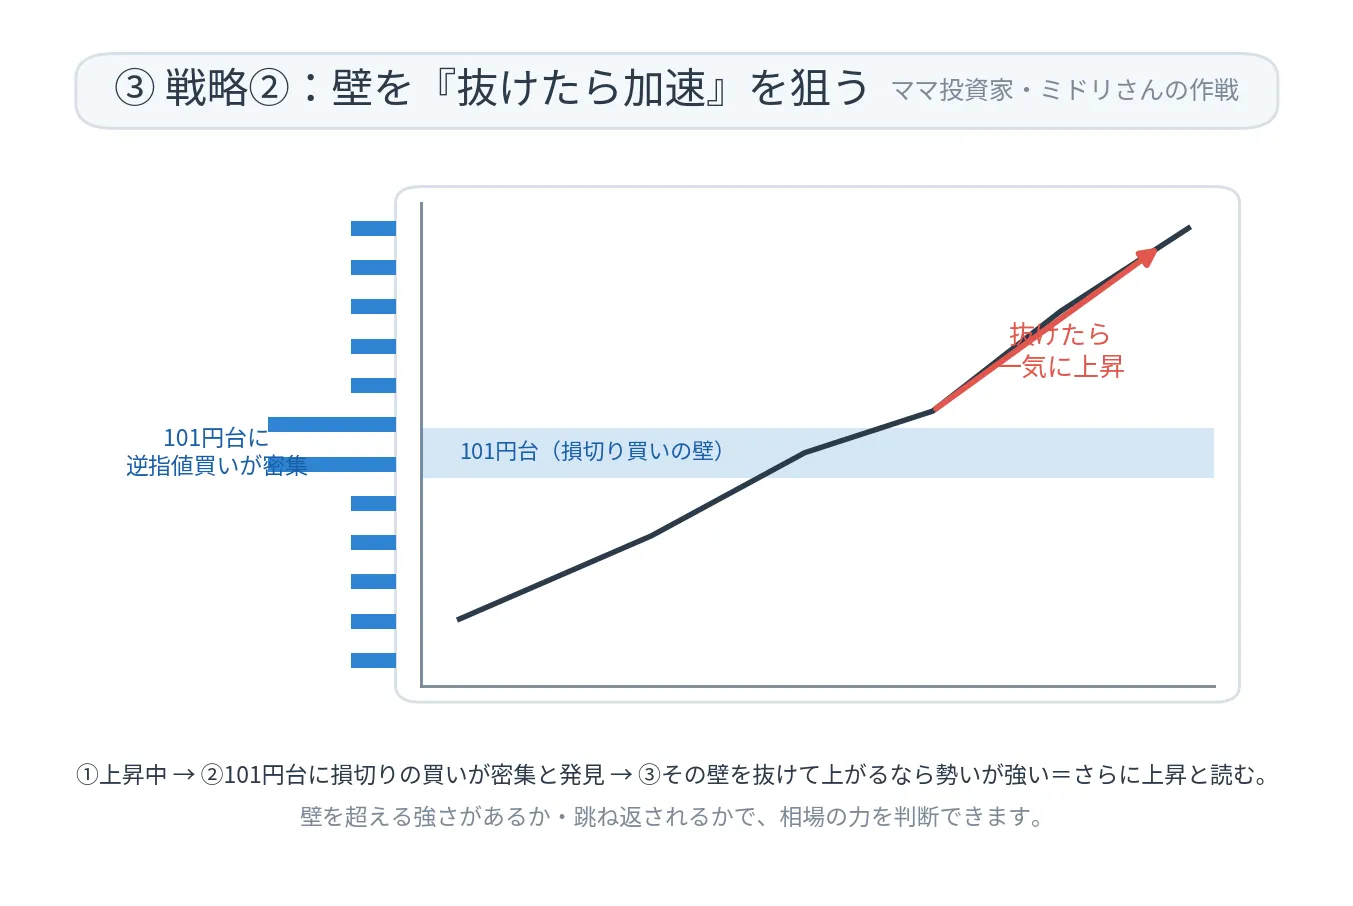
① That day, USD/JPY showed an upward trend.
② When Midori looks at open orders, she notices many stop-buy orders around 101.
③ “If those stop orders are overcome and it still goes up, that would be a very strong upward momentum. It might go higher!”
Will the wall be bounced off or broken through?
By watching this, you can judge the market’s momentum.
────────────────────
■ Summary
Open orders are a tool that visualizes where traders around the world want to buy and sell.
・Left-right: sell vs. buy, Up-down: above vs. below the current rate
・Orange indicates take-profit, blue indicates stop-loss
・Prices with many orders form a “wall” and serve as a guide for rebounds or breaks
Just remembering these three points will greatly change how you view the market.
Open orders are information that anyone can view for free.
Please try peeking at the actions of participants around the world in today’s trades.
────────────────────
Reference video on how to use Open Orders
https://www.youtube.com/watch?v=0HG_-GSHWSo&list=PL80k3owZmtdSr2f1IjFCD83IdRTwIem7j&index=2
※This article is intended to provide information that may be helpful for investment decisions and is not intended as an invitation to invest. Please make your own final investment decisions at your own responsibility.