

【Gold FX】+600 pips 超の爆益!The secret of the hourly chart channel and "range trading"
In April 2026, gold (XAU/USD) showed an extremely technically faithful move.
This time, following the +415.1 pips on the 8th, a further +202.9 pips were accumulated through a pullback buying trade, which we will dissect in detail.
“How to profit from volatile gold?” The answer lies in the higher-timeframe market awareness and the fractal structure on the lower timeframes.
【Market Context】 Scenario construction using a 1-hour ascending channel
In FX, the most important question is “which direction are we facing now?”
First, take a look at the 1-hour chart.
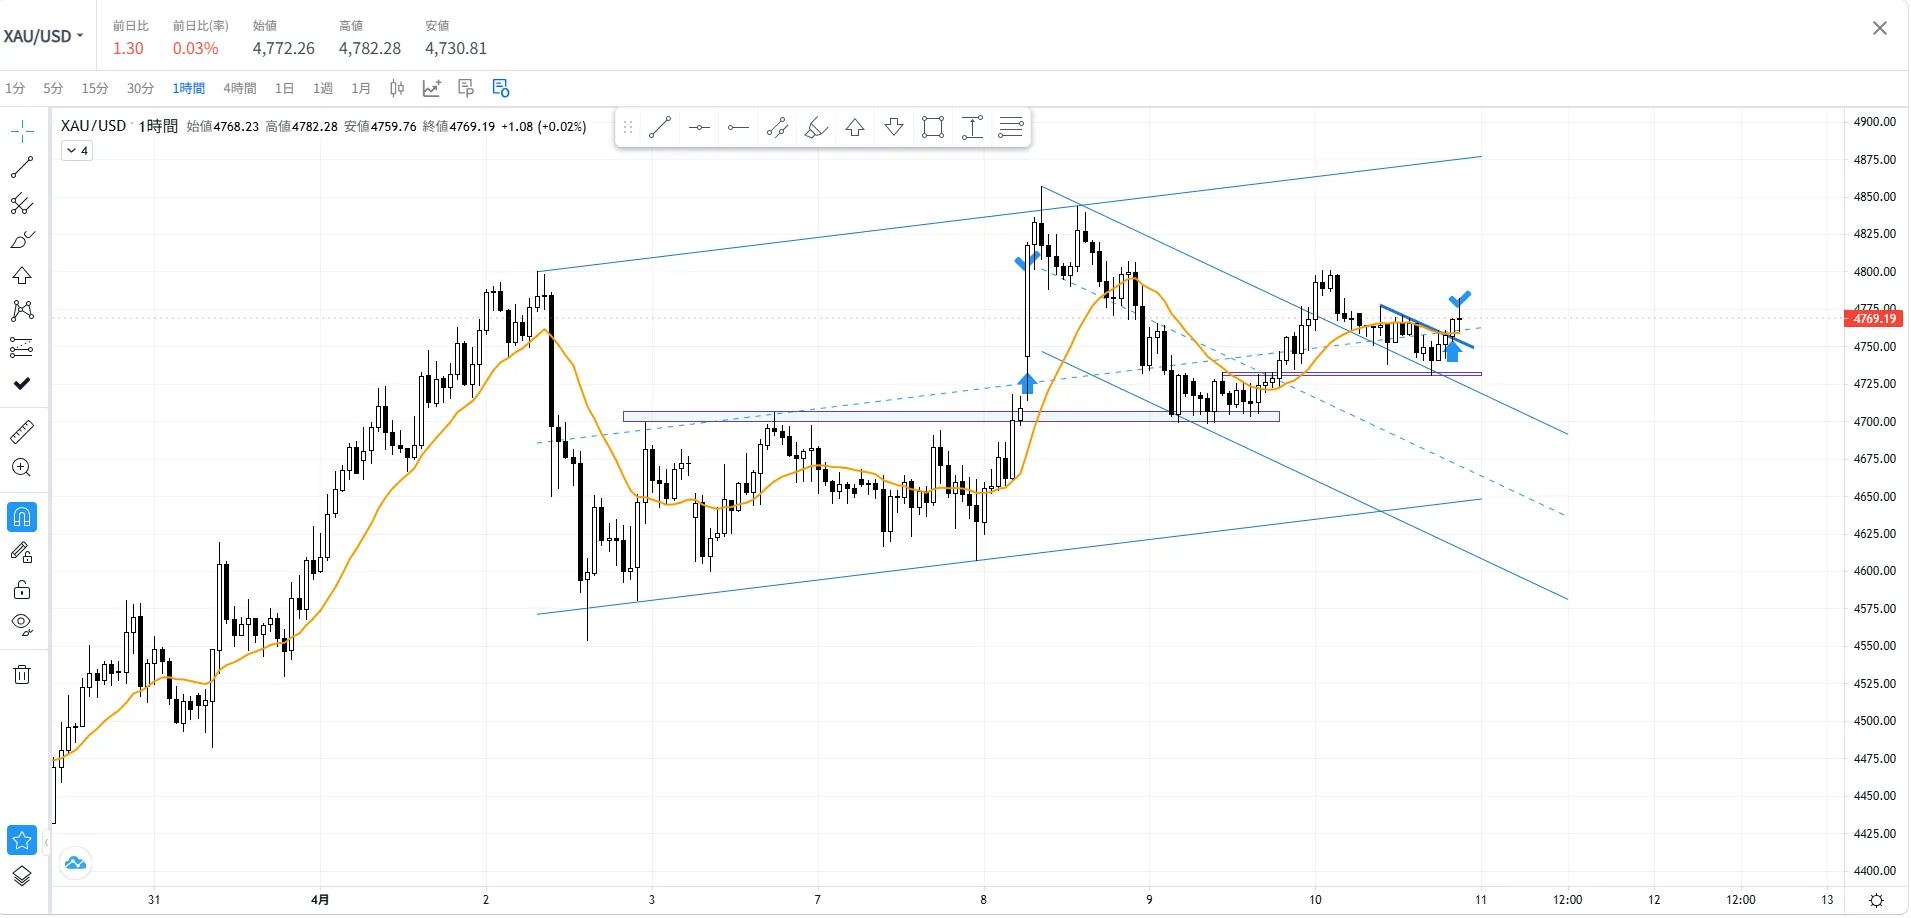
Targeting a range breakout within an ascending channel
You can see the blue parallel lines (the ascending channel) functioning on the chart.
In the trade on the 8th, I captured the moment of breakout from this range within the channel.
After confirming the morning strong rise, entry on the breakout of the range
The target we aimed for was the “price range” and it stretched perfectly, so +415.1 pips was realized.
We rode a powerfully trending move typical of gold.
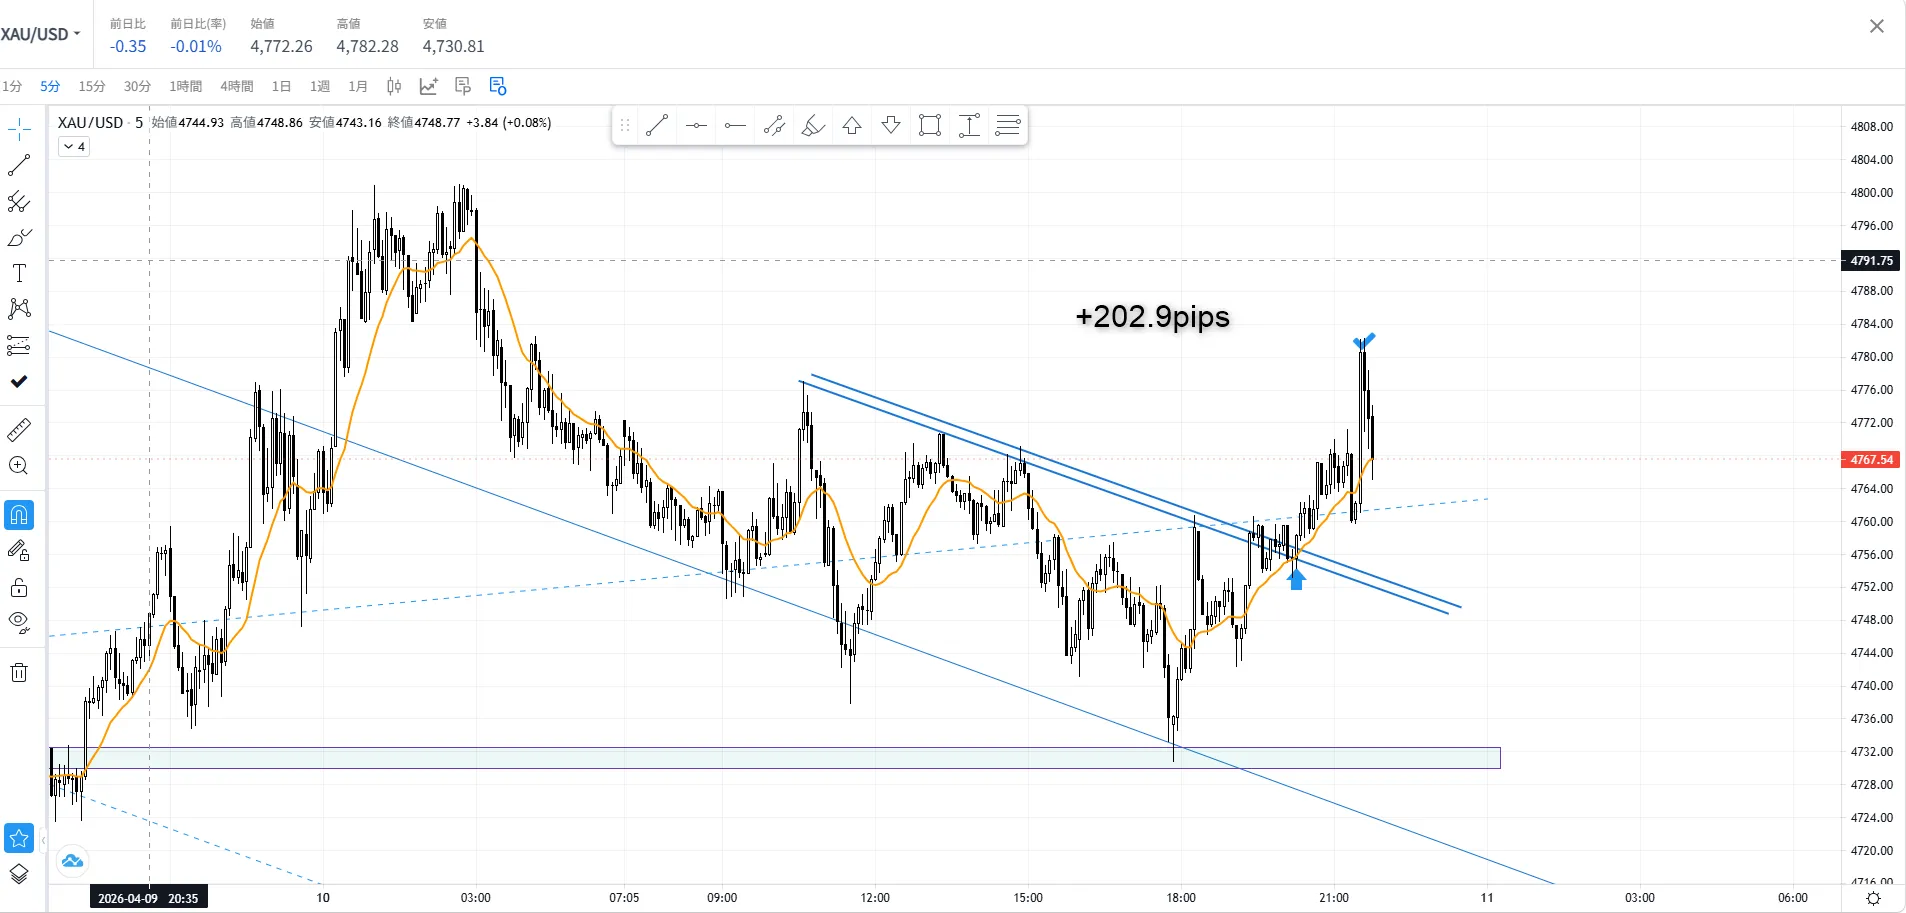
【5-minute Chart】 Basis for pullback buying: resonant reversal fractal
After a big trend emerges, a correction (pullback) always occurs.
Rather than rushing in here, I waited for points where the rationale aligned.
Where a “big wall” and a “small wall” coincide
The basis for this pullback buy is in the following fractal structure (nested structure).
- Higher-timeframe basis:Price fell to the 1-hour range high (former resistance).
- Lower-timeframe basis:On the 5-minute chart, price clearly rebounded at a nearby key level.
Thus, when a resistance area becomes a support (resistance-turned-support, a rollover reversal) occurs simultaneously across different timeframes, it creates a very strong entry point.
A confident entry after breaking the downtrend line
The trigger was the moment price moved above the drawn “downtrend line” on the 5-minute chart.
Breaking the line signaled that the pullback selling had ended. From there, I entered long.
【Exit Strategy】 Clear exits with a price-range capture method
Have you ever tried to extend profits only to have them pull back?
I use a unique method called“price-range capture” to mechanically determine exits.
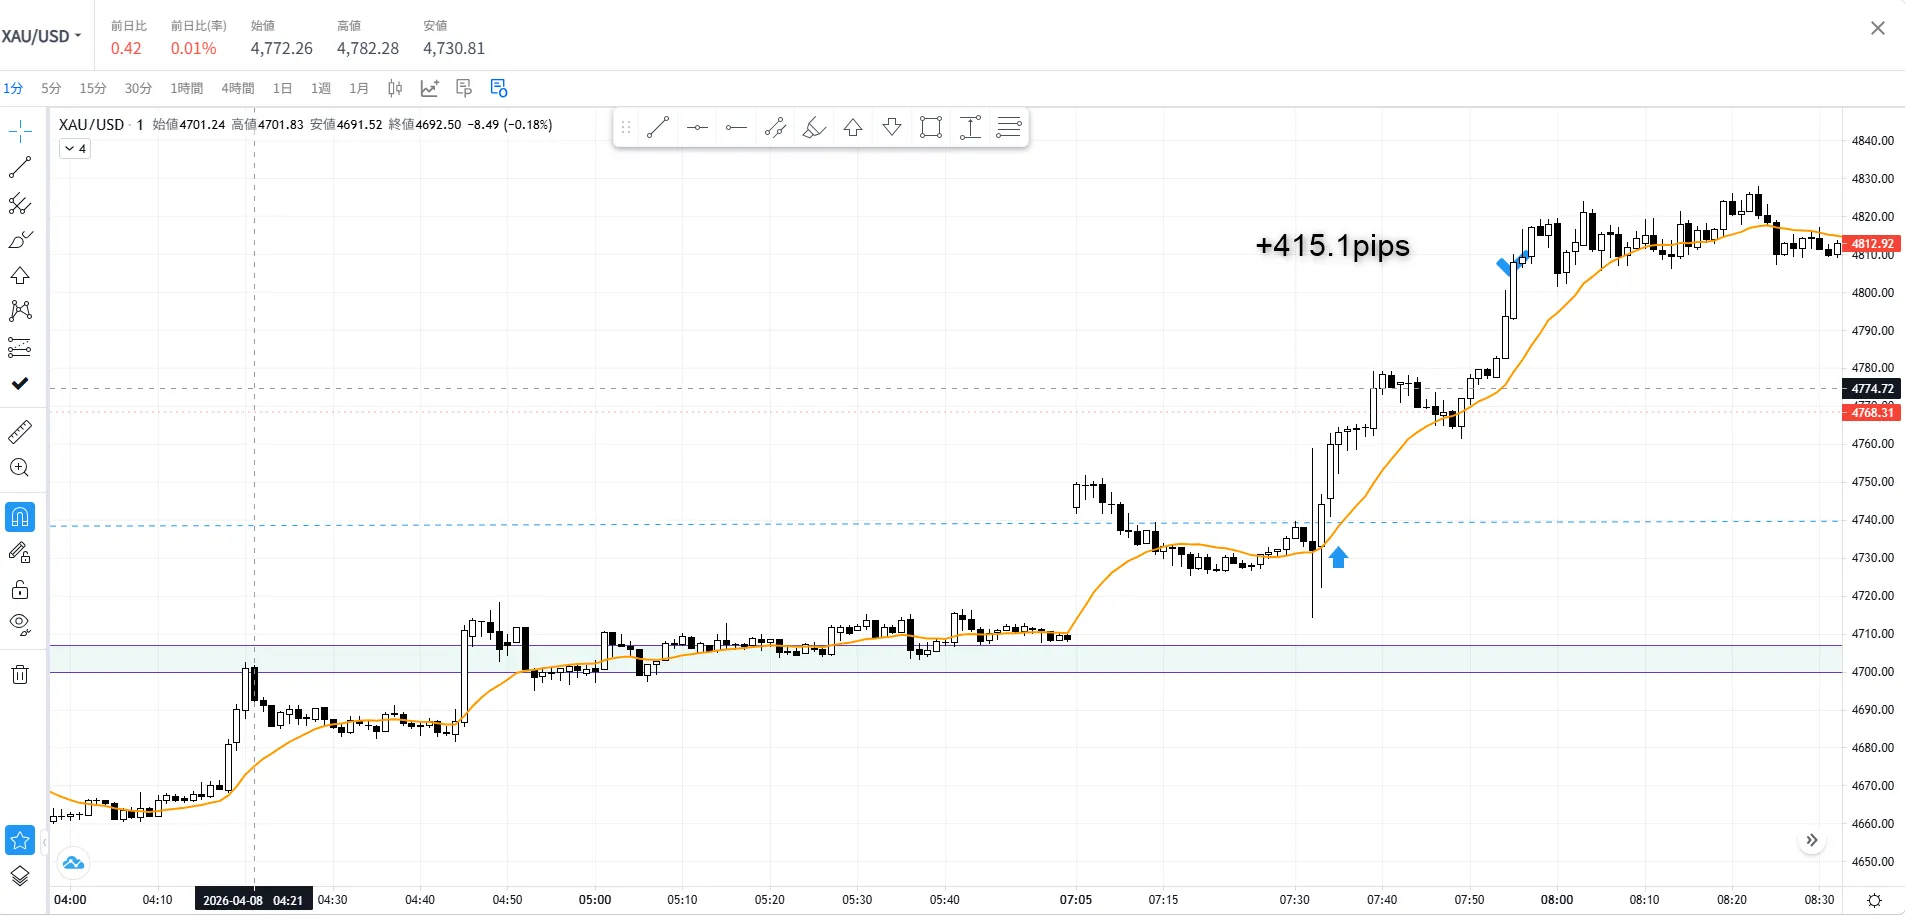
(This is a record of the initial move on the 8th, from the breakout of the range to a rapid stretch)
Letting go of greed and securing profits at the target
This time’s +202.9 pips was also closed when it reached the pre-calculated target range.
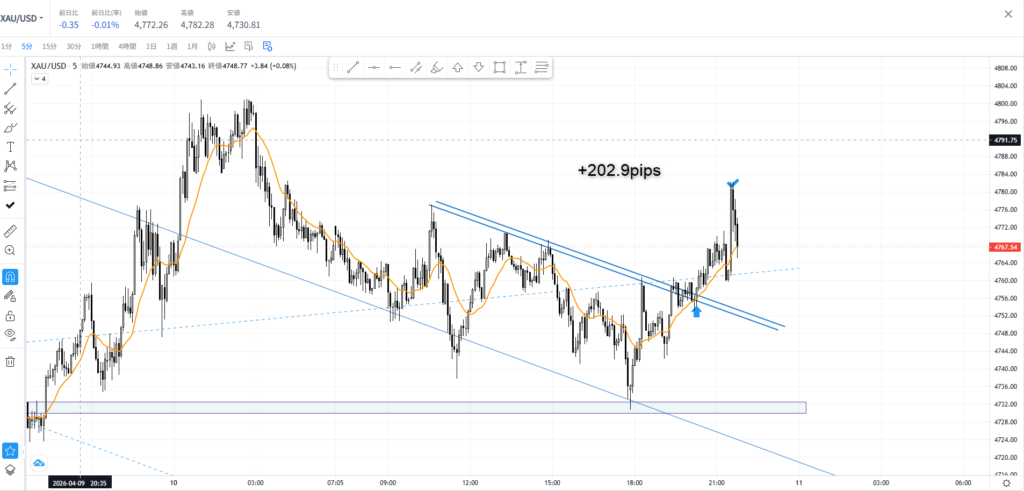
The blue checkmark on the right side of the image marks the exit point.
By eliminating the notion of “it may go further” andsettling with a calculated range,
this is the key to consistently achieving monthly profits.
Why even a working professional can win with gold
Looking back on this trade, I didn’t do anything particularly difficult.
- Confirm the big direction (channel) on the 1-hour chart
- Pull toward the key lines (support/resistance)
- When the lower-timeframe pattern forms, quickly take profit equal to the price range
That’s all. Even a busy office worker like me can set OCO orders (limit and stop) so profits lock in during work or while sleeping.
For those who want to learn FX methods
For more concrete calculations of the “price-range capture” and how to draw lines,GoGoJian has everything published. If you feel your current trading style has limitations or you want a more stable tool, please check it out!
Well then, have another great trade tomorrow!