

NK225 Futures MTF Dow Theory 4-Scenario Analysis Report 2026-06-12 (Night Session)
NK225 Futures MTF Dow Theory Analysis Report
1. Trend Table
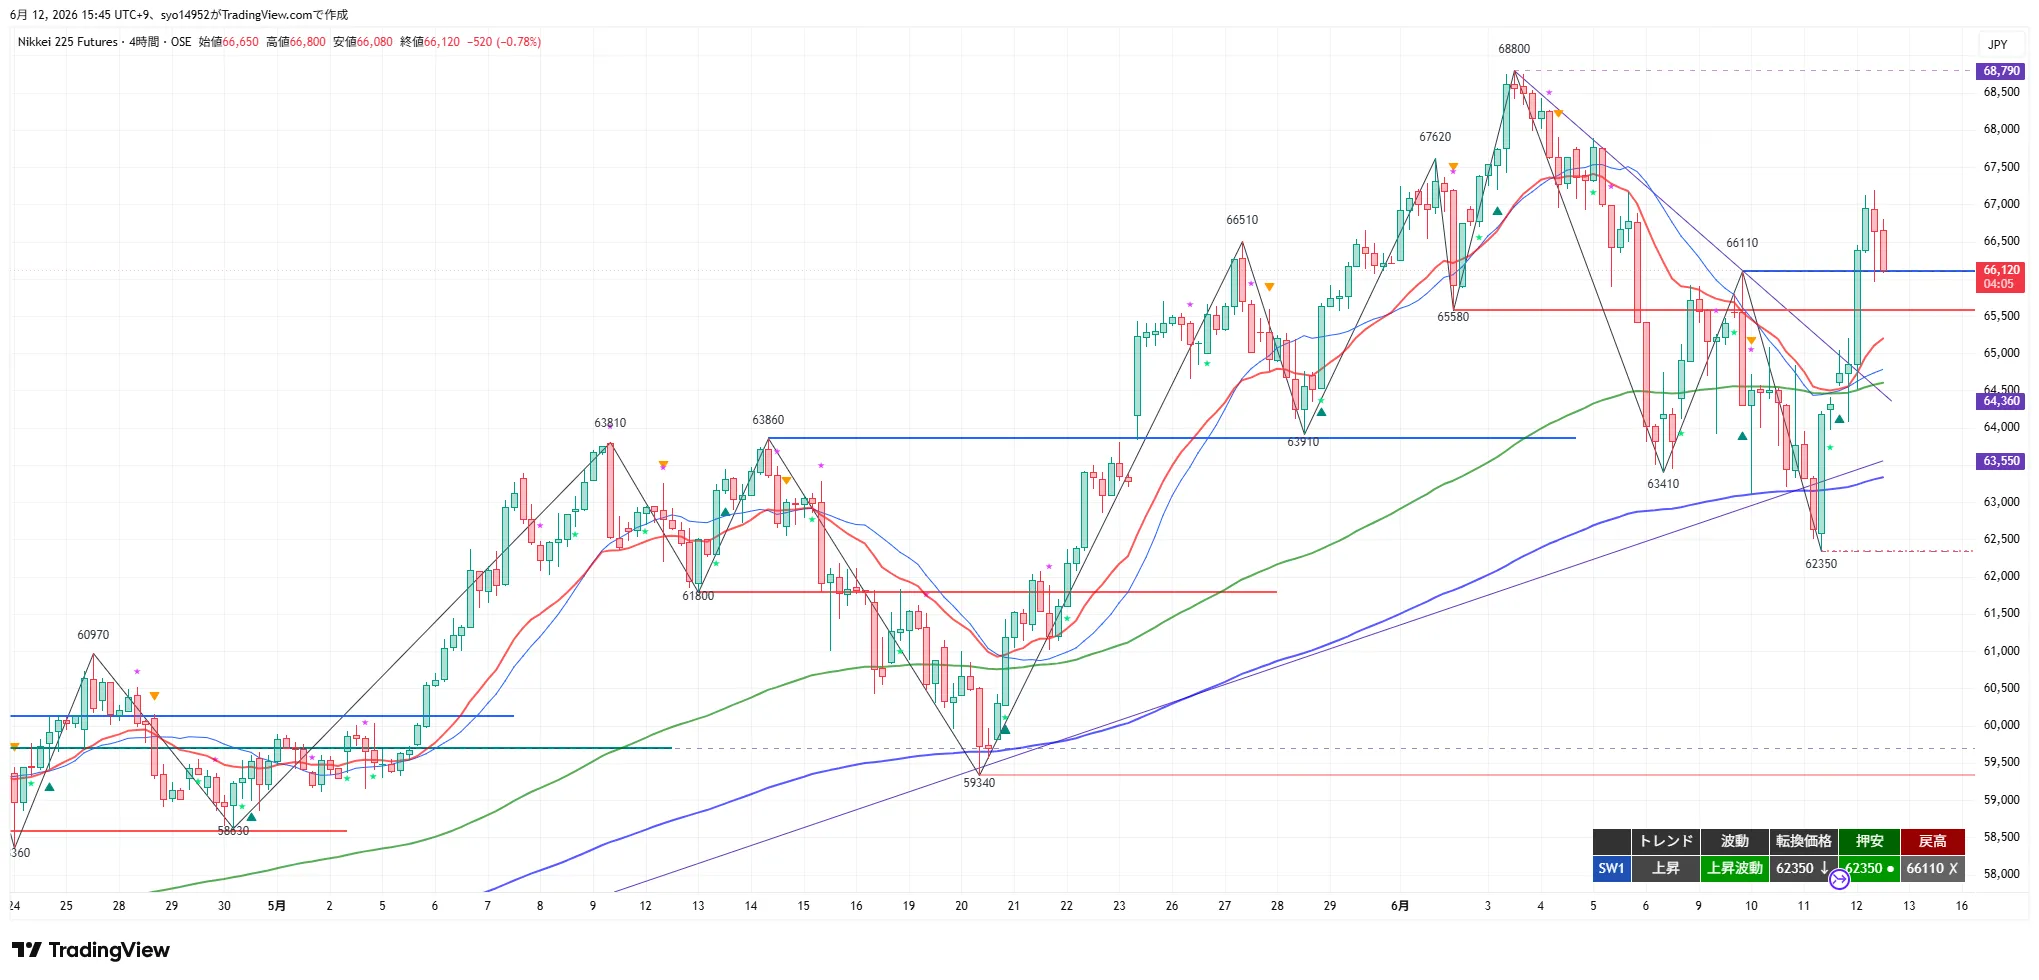
Uptrend / Upwave. Break price 62,350, pullback low 62,350, pullback high 66,110 (X = close above). The day rose to 66,800 then retraced to 66,120 and closed with a -0.78% bearish candle. It closed just above 66,110 (former resistance turned support), indicating a test of a breakout. 20EMA and 20SMA are rising; price is well above 120EMA (daily 20EMA equivalent = 64,360) and 200EMA (63,550 / psychological level).
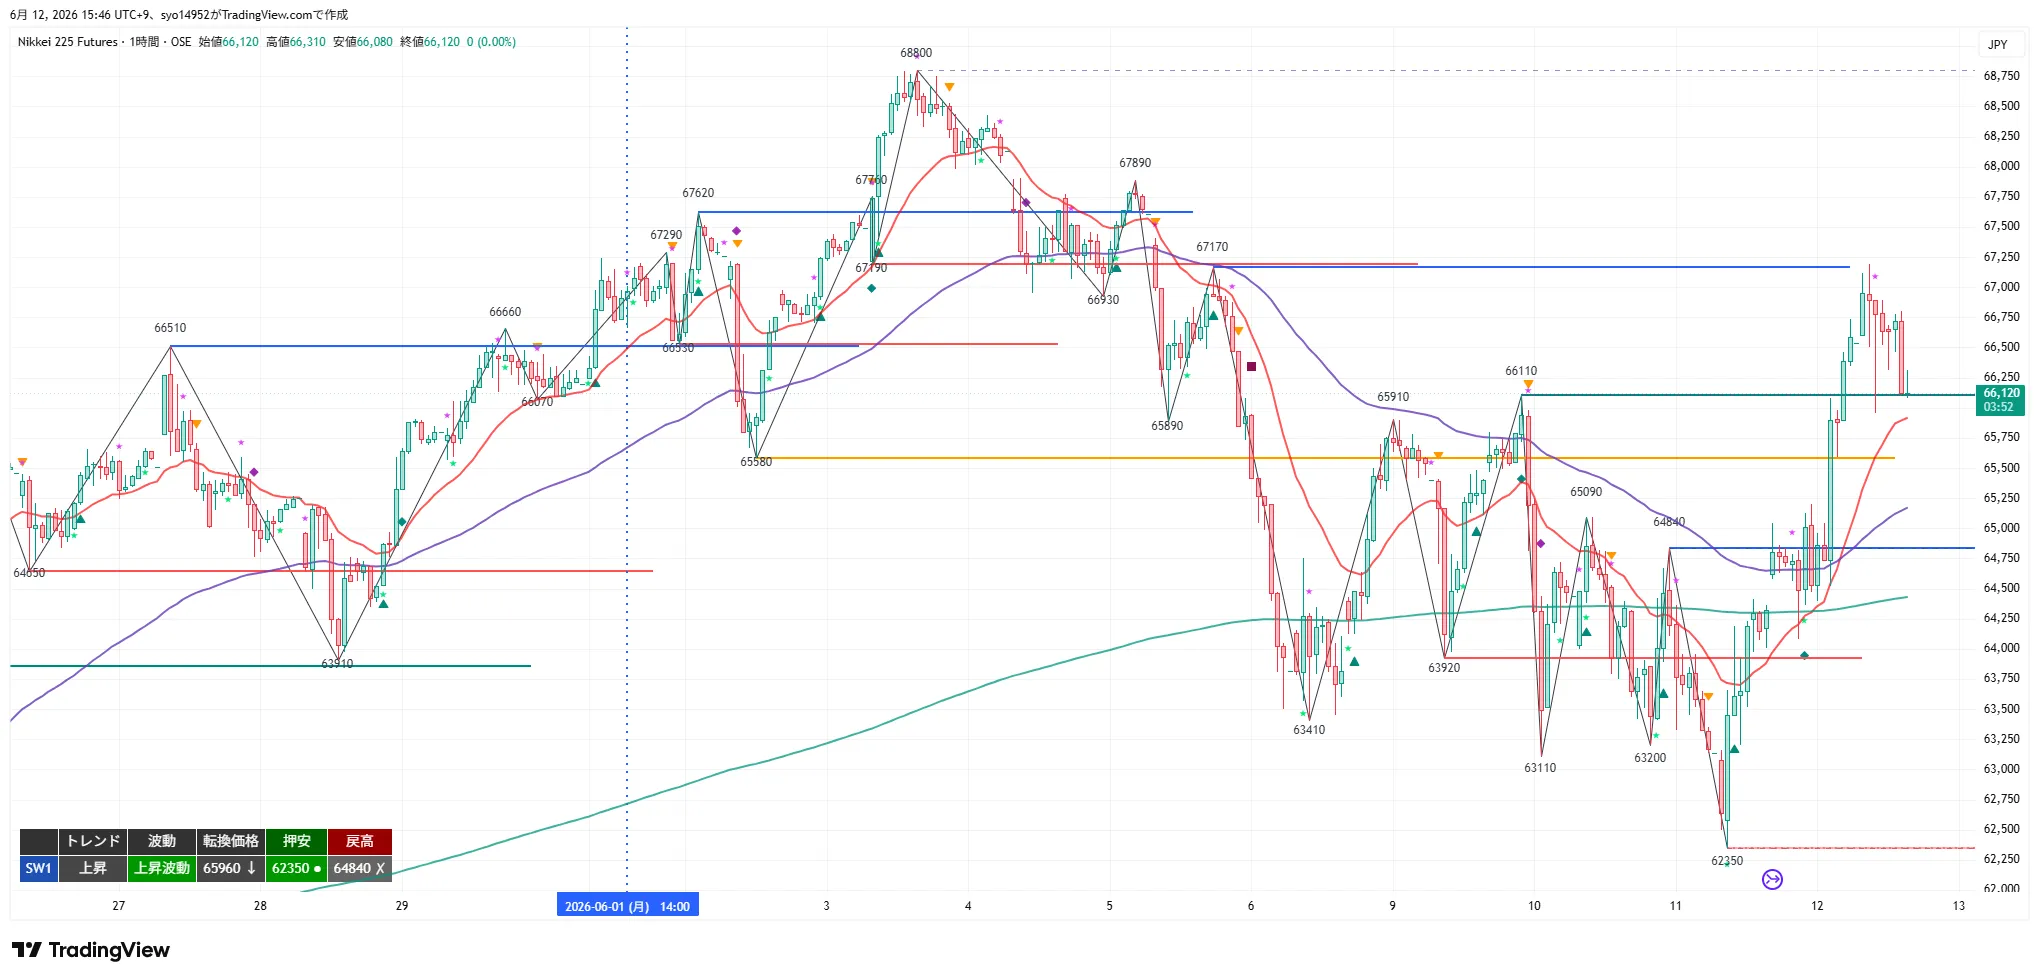
Uptrend / Upwave. Break price 65,960, pullback low 62,350, pullback high 64,840 (X = close above). The intraday low of 65,960 became a new pullback low (turning point). 20EMA, 80EMA (4H 20EMA equivalent), and 480EMA (daily 20EMA equivalent) are all rising, with price located above them.
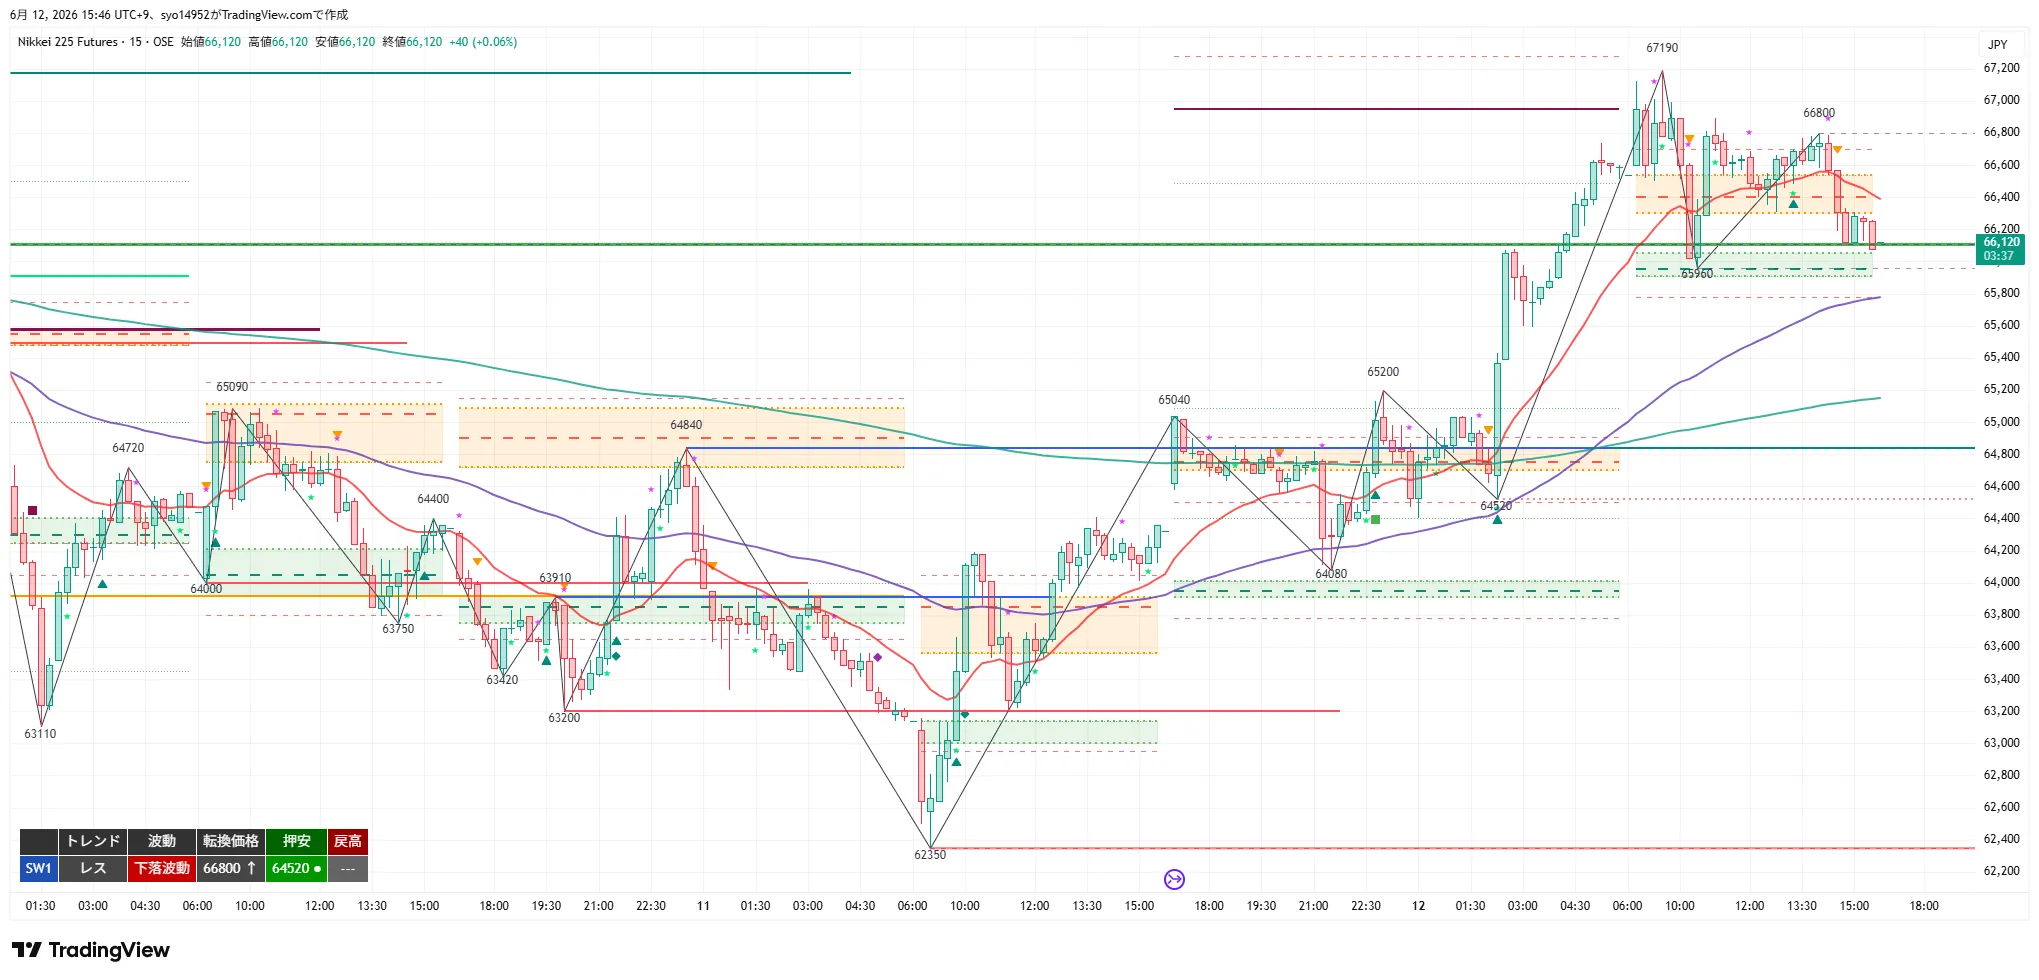
Range / Downward wave. Break price 66,800, pullback low 64,520, pullback high —. From a high of 67,190, retraced to 66,120; the most recent swing high 66,800 is treated as the turning price. 20EMA has turned downward with price below it, while 80EMA (1H 20EMA equivalent) and 320EMA (4H 20EMA equivalent) are rising and price sits above them.
2. Important Price Levels
3. Verification of Previous Trade Idea
Target: Day session
Opened at 66,600 near the night high with a bullish tilt after a gap. Entered on a breakout at 66,650. T1 (66,930) and T2 (67,170) reached. Intraday high extended to 67,190; T2 second target 67,620 not reached. MFE protection working in line with price action.
From the 67,190 high, a pullback zone to 66,050–65,910 (low 65,960); 65,950 is below the 20MA on 15m, so skip (rule: 20MA position). Entered at 66,540 when 5-minute 20MA breached higher and upmove turned. However did not reach 66,930 (T2 1st) and stalled at 66,890, triggering MFE+350 to offset or trail.
With higher time-frame 1H 20EMA rising, wait-and-see. Conditions for pullback stall not met; no trigger.
Did not close below 65,960; higher timeframes rising, so no trigger.
4. 4H Analysis
The 4H remains in an uptrend and upwave, but the day closed with a -0.78% bearish candle after rising to 66,800 then retracing to 66,120. It closed just above 66,110 (old pullback high turn support), indicating a breakout test. 20EMA and 20SMA are rising; price stays well above 120EMA (64,360) and 200EMA (63,550).
If 66,110 can be held at close, pullback buying continues; a clear break below would signal breakout failure and possible move to 65,580/65,090. Upside targets: 67,190 (intraday high), 67,620, 68,800 (old ceiling). Downside: 66,110, 65,580, 65,090, eventually 62,350 (4H pullback low).
5. 1H Analysis
The 1H maintains an uptrend and upwave. The intraday low of 65,960 becomes a new pullback low (turning point). All major averages (20EMA, 80EMA (4H 20EMA equivalent), 480EMA (daily 20EMA equivalent)) are rising and price sits above them.
If 65,960 holds as support, look for dip-buying opportunities; a close below could signal a breakdown of the upwave and a move toward 64,840.
6. 15m Analysis
The 15m is in a range / downward wave; from 67,190 to 66,120, the last swing high 66,800 is treated as turning price, with 64,520 as a pullback low. 20EMA has turned downward with price below; 80EMA (1H 20EMA equivalent) and 320EMA (4H 20EMA equivalent) are rising with price above them.
Short-term: a close above 66,800 would push back into an upwave; a break below 65,960 would deepen the downwave. Since the 20EMA is downward-sloped, wait for a 15m close above 66,110/65,960 before jumping into a dip-buying, and wait for a 15m close above 66,800 for selling on rebounds.
7. Conclusion
In summary, the day session followed the night rally, rising from 66,600 to 67,190, then retracing to 66,120 at close. The 4H and 1H remain in uptrends, but 4H closed with a -0.78% bearish candle just above 66,110 (breakout level), while the 15m has turned into a downwave with a short-term consolidation. Night-session maintains an uptrend bias with dip-buying favored, but 66,110/65,960 hold is essential.
If 66,110–65,960 closes above, look for pullback buys; a close above 66,800 (15m turning) and a close beyond 67,190 would signal breakout-following buying. If 65,960 breaks on a 1H close, the 1H upmove would be negated, turning toward pullbacks and breakout-following shorts. Given the price is near a high and the 4H candle is bearish, protect gains early using MFE. Align with higher-timeframe upside while monitoring lower-timeframe consolidation.
From a consistency perspective, 4H and 1H align with an upmove, but 15m shows a downwave; higher and lower timeframes temporarily diverge. Maintaining 66,110/65,960 supports is key for sustained pullbacks; a break favors a shift to a downside path. Prioritize higher-timeframe bias for pullback buys, and consider selling only after 65,960 break.
8. Trade Ideas
- Entry trigger: Break above 66,800 (15m turning point and recent swing high) with a 15m close (reversion to short-term upwave).
- Follow: After breakout, wait for pullback near breakout price or near inclined 20MA (dip-buy) using short-term entries as a back-entry (target around 66,800).
- Position build condition: Reclaim 67,190 (intraday high) with a 1H close (new high continuation).
- Stop/Invalidation: Initial leg fails if 66,400 is broken; core position fails if 66,110 broken.
- Targets: 67,190 (partial profit + entry cost), 67,620–68,800.
- RR: 66,800 breakout with 66,400 stop gives ~RR1.0 to T1; T2 at 67,620 gives ~RR2.1. Since T1 is around 1.0, emphasize back-entry and mainly trade the core position.
- MFE Protection: close at +200 to lock in at break-even or slight gain, or trail at +300 to secure at least +100. Protect early in high-price zone.
- Standard: 66,110–65,960 (4H old pullback high turning support; 1H turning) or 65,910–65,580 (old pivot / up 1H 20MA band) pullback and confirm rebound with 15m close.
- Follow: Confirm rebound with 15m close; minor dip near 66,030; deeper dip near 65,650. Enter above rising 20MA.
- Position build condition: Reclaim 66,310 (1H intraday high) with 1H close.
- Stop/Invalidation: Initial leg fails if 65,880 breaks (deep pullback 65,480); core position fails if 65,580 breaks. Full exit if 65,090 breaks.
- Targets: 66,540 (partial profit + cost), 66,800–67,190.
- RR: 66,030 breakout with 65,880 stop yields ~RR3.4 to T1; T2 at 66,800 yields ~RR5.1.
- MFE Protection: exit at +200 to lock in, or +300 to secure at least +100; stay in shallow pullbacks given 4H bearish candle; only enter after 15m close confirms rebound when 15m 20MA is downward. If target 1 is reached at firing foot, skip.
- Standard: Break below 65,960 (1H turning / intraday low) and then pull back to 66,300–66,540 to see a stall (only capture pullbacks).
- Follow: Wait for pullback stall confirmed by 15m close (target around 66,450).
- Position build condition: Break 65,580 with 1H close.
- Stop/Invalidation: Initial leg recovers to 66,850; core recovers to 66,800. Strong invalidation at 66,800 (15m turning recovery).
- Targets: 65,580 (partial profit + cost), 65,090–64,840.
- RR: 66,450 breakout with 66,850 stop gives ~RR2.2 to T1; T2 at 65,090 yields ~RR3.4.
- MFE Protection: exit at +200 to lock in, or +300 to secure at least +100; since higher timeframe is rising, avoid deep chasing; only target on rebound and do not overextend; if entry is confirmed and target 1 is already reached, skip.
- Trigger: Break below 65,960 (1H turning / intraday low) with a 15m close (breakdown of 1H upwave).
- Follow: After breakdown, wait for a rebound near break price or inclined 20MA near break price (watch for pullback selling) with tight timing as back-entry, target around 65,960 vicinity.
- Position build condition: Break below 65,580 with 1H close.
- Stop/Invalidation: Reclaim to 66,310 for initial leg; core recovers to 66,540; full exit if 66,800.
- Targets: 65,090 (partial profit + cost), 64,840 / 64,520.
- RR: 65,960 breakout with 66,310 stop yields ~RR2.5 to T1; T2 at 64,840 yields ~RR3.2.
- MFE Protection: exit at +200 to lock in, or +300 to secure at least +100; as higher timeframe is rising, avoid full downside until 65,960 breaks; be cautious of false breaks and sharp rebounds in high price area. If target 1 is reached on the firing foot, skip.
9. Current Action
- Most Important Line 1: 66,110–65,960 — 4H old pullback high turned support + 1H turning point / intraday low. If closed above and rebound, continue dip-buying (trend-following). A clear close below signals breakout failure and potential deeper adjustment.
- Most Important Line 2: 66,800 — 15m turning point / latest swing high. A close above 66,800 on a 15m close indicates return to an upwave toward 67,190 and beyond for new highs (breakout-following long). If 65,960 is broken on a 1H close, reassess for a 1H up wave breakdown and consider pullbacks and breakout-following shorts.
10. Cautions
- 4H and 1H are rising, but 4H ends with a break test of 66,110 on an bearish candle, while 15m turned downward; wait for confirmation of rebound at 66,110/65,960 and protect gains early via MFE.
- Return selling / Break-following shorts are contrarian to higher-timeframe uptrend; wait for confirmation below 65,960. Avoid early entries while 1H 20MA is rising (rule that worked in item ③).
- If 66,110 closes clearly below, breakout success is unlikely, prepare for adjustments toward 65,580/65,090.
- If target 1 is reached at firing confirmation, skip entering further positions.
11. About This Report
This report analyzes NK225 futures using the Dow Theory Indicator across three timeframes: 4H / 1H / 15m.
Note: This report is for information purposes and is not investment advice. Trading decisions are the reader’s responsibility.