Dig into the USD/JPY ore vein with rock-solid scalping!『Gnome USDJPY M5 V2』
Stable profits with a simple strategy
A classic scalping EA optimized for the current market
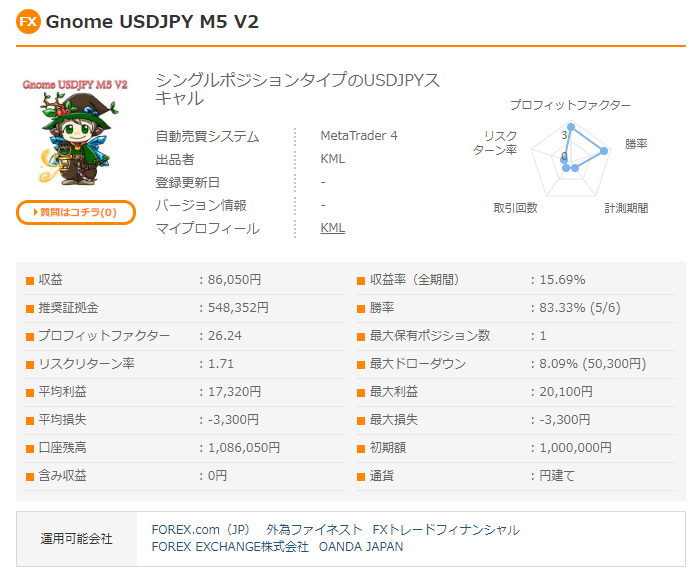
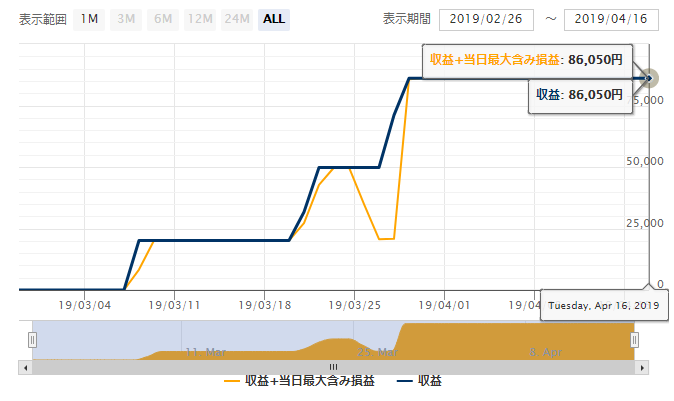
Forward performance since the start is favorable,Current win rate83.33%, PF is impressive26.24, though the number of trades is still small, but the profitability when earning profits looks quite good.
【Gnome USDJPY M5 V2Overview】
Currency pair:[USD/JPY]
Trading style:[Scalping]
Max positions: 1
Timeframe used:5‑minute chart
Max stop loss:90
Take profit:90
USD/JPY, 5‑minute chart, SL and TP widths are the same with a maximum of one open position, a simple, classic scalping EA.
If the analysis and performance look good, this could become one of the recommended choices for beginners who are deciding whether to buy.
【Backtest Analysis】
We will look at the backtest results for both simple (straight) and compounded operations.
・Simple operation
Backtests are published on the product page, but we analyzed a longer period: 15 years at 0.1 lot.
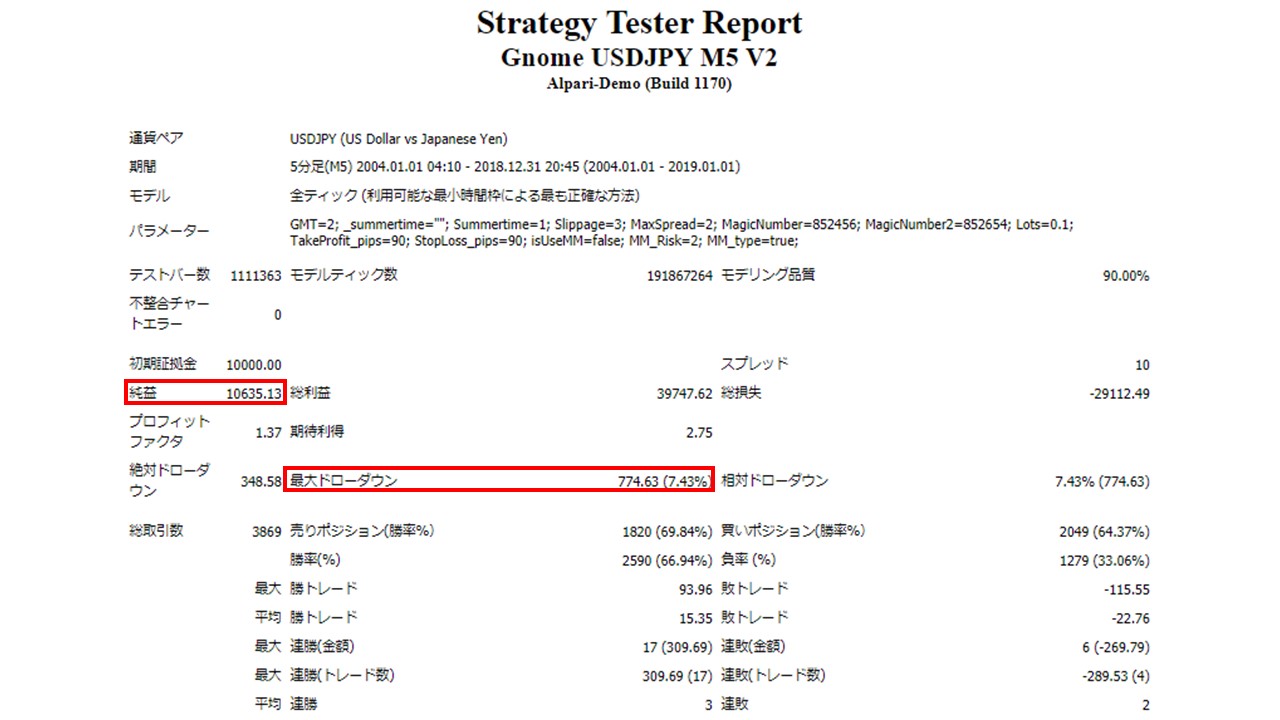
2004.01.01‑2019.01.01
Spread1.0
0.1 lot fixed
Net profit +116.9万円(annual average7.79万円)
Maximum drawdown –8.5万円
Total trades3,869 times (annual average257 times)
Win rate66.94%
PF1.37
Trading frequency is about257 times per year, roughly1 day1 trades on weekdays.
Maximum drawdown is8.5万円 and somewhat high, but since the maximum position is 1 lot, it is manageable for an EA and not a major drawback.
The margin recommended for safe operation is0.1 lot fixed.
4.5+(8.5*2)=21.5万円)
です。This yields an expected profit of36.2%.
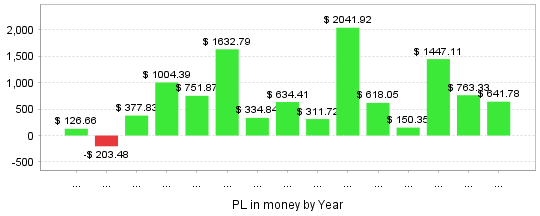
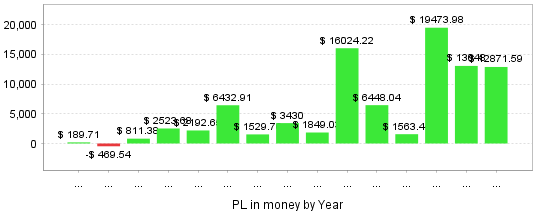
・Annual profit
Over the past15 years,14 years were profitable.
The peak occurred in 2013 during the Abenomics market, but the last three years have also shown stable profits.
Compound operation
Next, for the same period and settings as the simple operation, but with compounding.
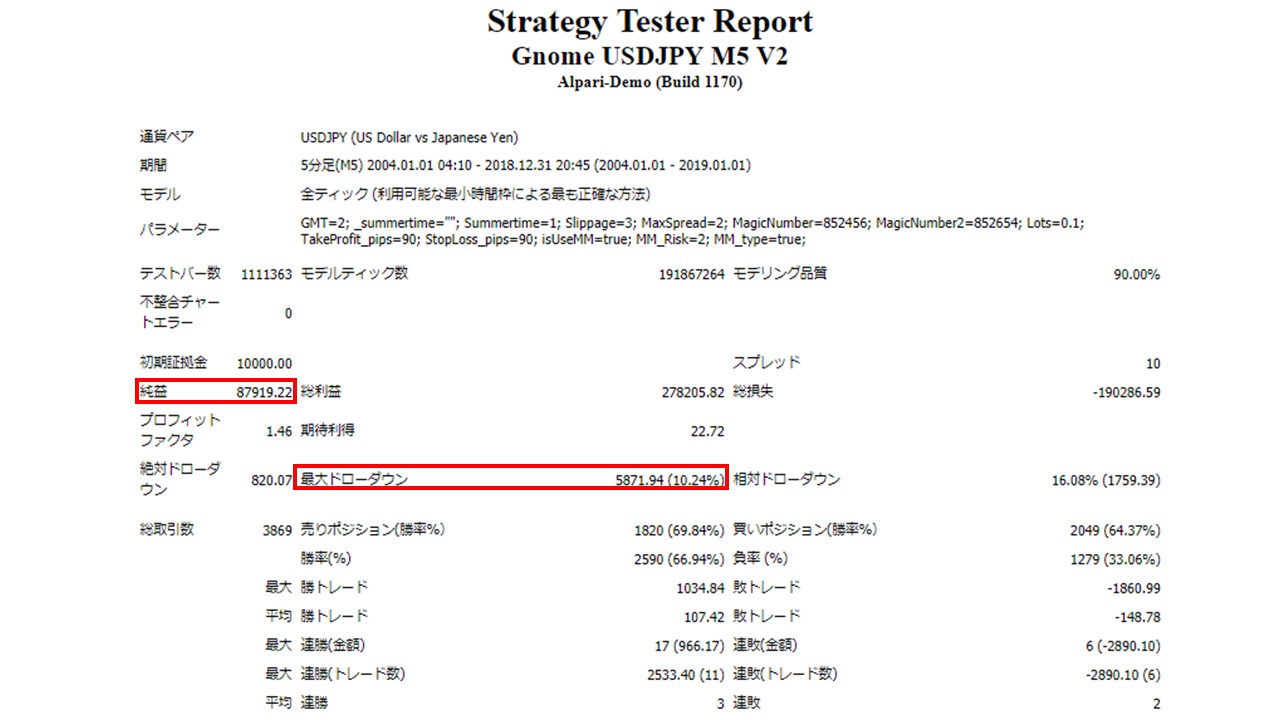
Net profit +967.1万円
Maximum drawdown –64.5万円(10.24%)
PF1.46
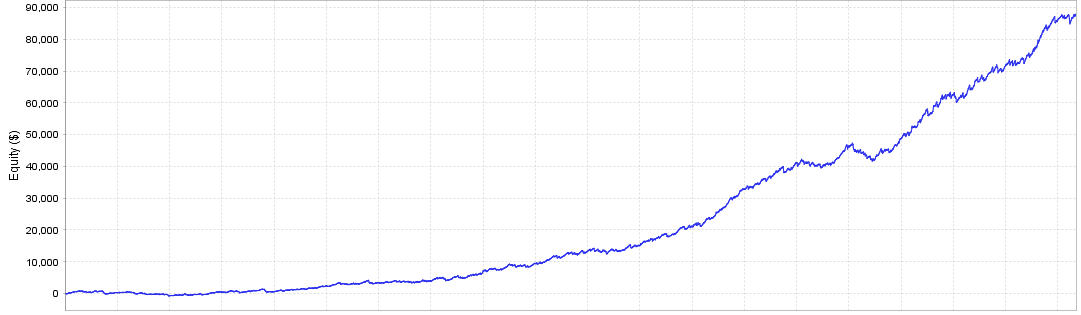
Yearly revenue follows a similar pattern to simple operation, but the recent gains are more pronounced.
With compounding, the wealth grows more rapidly the longer you run, so year-by-year results are also informative.
【Backtest comparison when compounding】
Latest3Annual comparison.
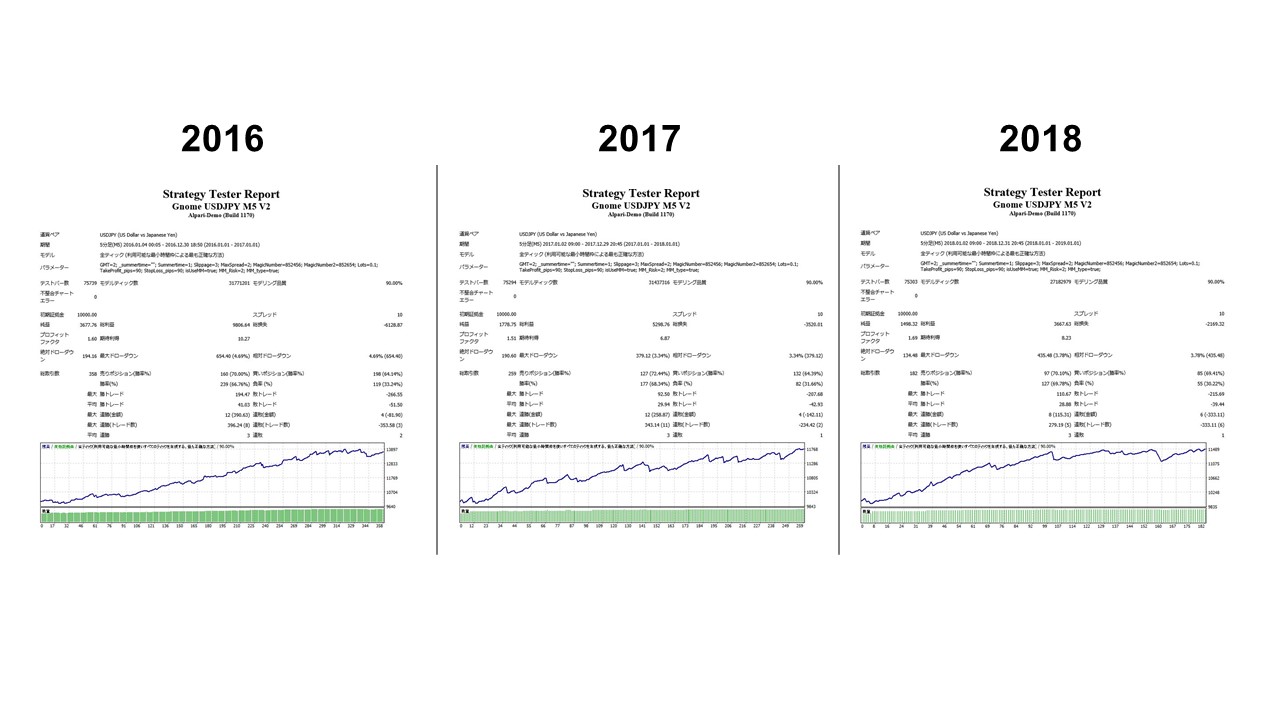
To keep it concise, the key points are:
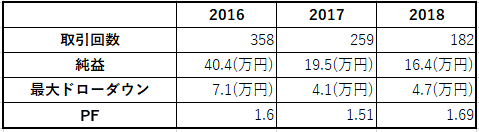
Looking at the latest3years of performance, trades and net profit are trending down,
but the drawdown has decreased, so in terms of PF it remainsAbove 1.5 and last year shows the best results.
Since no averaging-down or martingale methods are used, there is no risk of capital being wiped out in one go.
If assets continue to grow at this pace yearly, compounding would be ideal as it preserves capital and yields high profitability.
From a long-term perspective, profits are earned in most years, which is already satisfactory, but based on the last few years' analysis, this EA seems the most suited to the current market.