
Public release of the world’s number 3 FX method! Turn 120,000 yen into 10.6 billion yen and unleash its destructive power with even more explosive secrets
Hello. I'm Kojima from the Indicator Catalog.
Today, we will fully disclose the legendary breakout method that has shaken the investment world with its overwhelming track record.
A legendary breakout methodthat has been fully revealed.
That trader turned just120,000 yen starting capital into 10.6 billion yenand rose to become the world’s third-largest investor,a genuine logic.
Please stop being fooled by the crowded market’s “mysterious signal tools whose creators are unknown” and by “expensive schools without substance.”
If you read this article to the end,
you will understand a real winning method that pushes the maximization of profits while minimizing losses by exploiting crowd psychology in the market.
In addition, the latter part of the article covers concrete strategies to overcome “the sole weakness of this 10.6 billion yen method” and unleash its destructive power even more. Please take your time and read to the end.
Thorough Explanation of the “Legendary Breakout Method” That Led from 120,000 to 10.6 Billion
At its core, this method is a swing trading strategy that targets the breakout of a brief consolidation (range) after a strong trend (momentum) has formed.
■ Recommended Time Frame
4-hour chart (or higher timeframes like daily charts)
※ Since swing trading is basic,
monitoring on the “4-hour chart,” where noise is low and the trend tends to stabilize, is most recommended.
■ Indicator Settings
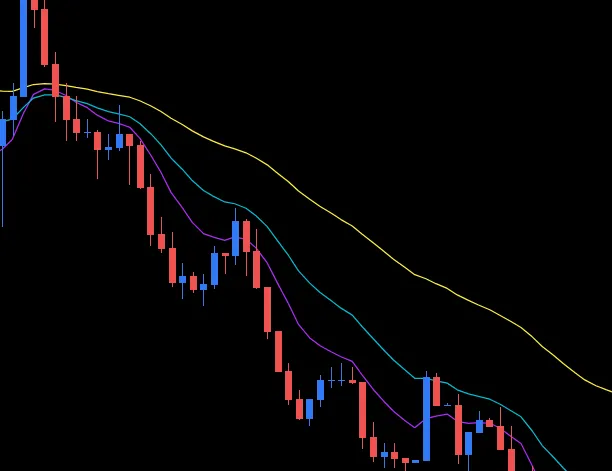
Only three exponential moving averages (EMAs) are used.
10 EMA, 20 EMA, 50 EMA
We target times when these MAs are in a perfect order.
■ 【Ironclad Trading Rules】
① Entry Timing
1. Environment Recognition (Perfect Order)
Confirm a “perfect order” where the three lines align nicely in the order of 10 EMA > 20 EMA > 50 EMA (reversed in a downtrend), and the slopes are aligned. This is a signal of a strong trend.
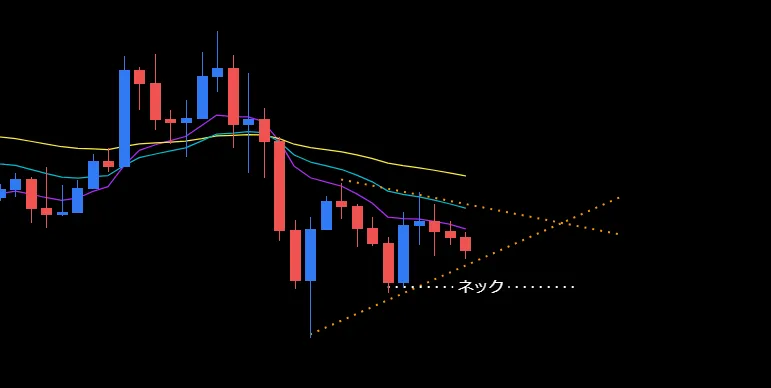
2. Wait for the formation of a range
After a trend has formed, wait for the price to move in one direction and then enter a sideways movement (energy accumulation). Visually recognize when an upper resistance line can be drawn where the price is repeatedly capped, ideally forming shapes like an ascending triangle or a descending triangle.