

NK225 Futures MTF Dow Theory Analysis Report 2026-06-11 (For the Day/Night Session)
NK225 Futures MTF Dow Theory Analysis Report
1. Trend Table
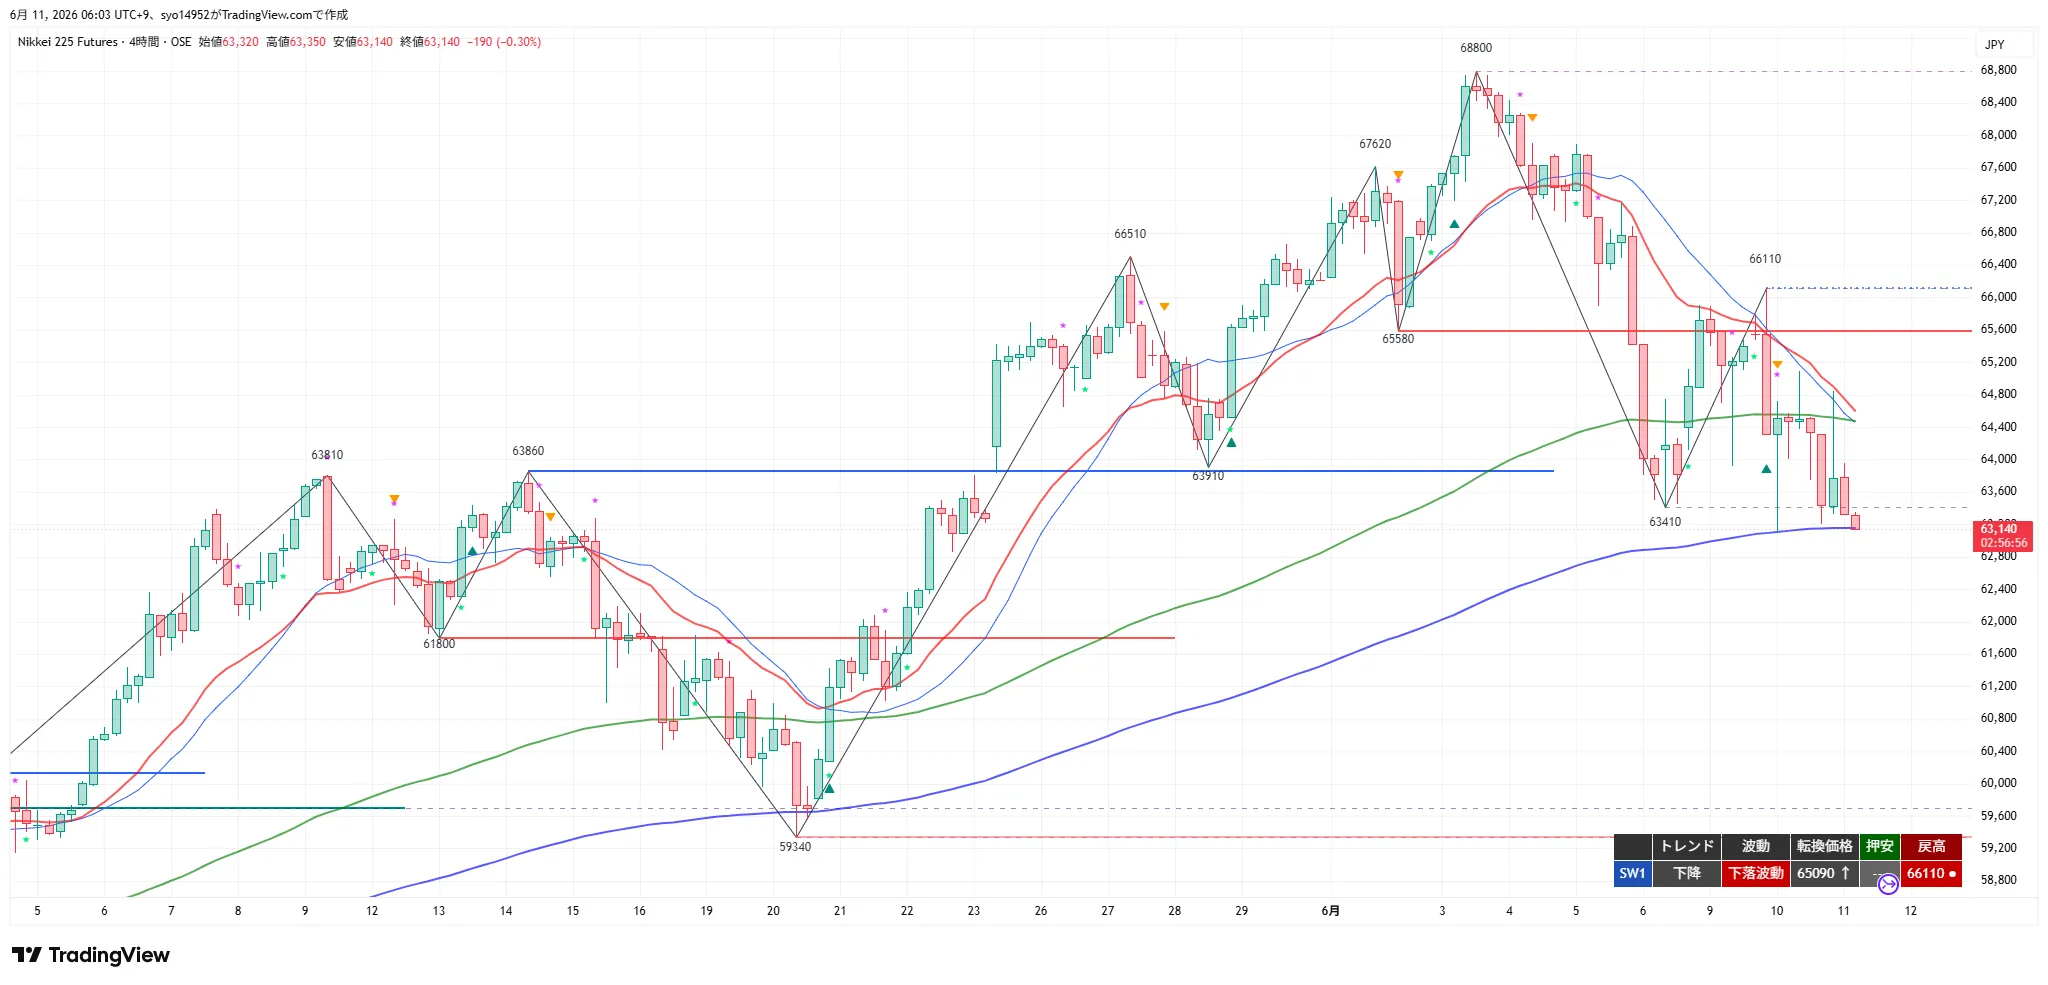
Downtrend / Downward price movement. Reversal price 65,090, support new lows being updated (recent low 63,140), rally high 66,110. From 66,110, the price continued to fall, the Night session recovered to 64,840 then declined to 63,140 to close. Downtrend continues and accelerates. Current price sits below the 4H 20EMA and 20SMA (roughly 64,800–65,300), below the 120EMA (approx. 64,500, daily equivalent of 20EMA) and below the 200EMA (psychological level around 63,300). The slope is downward.
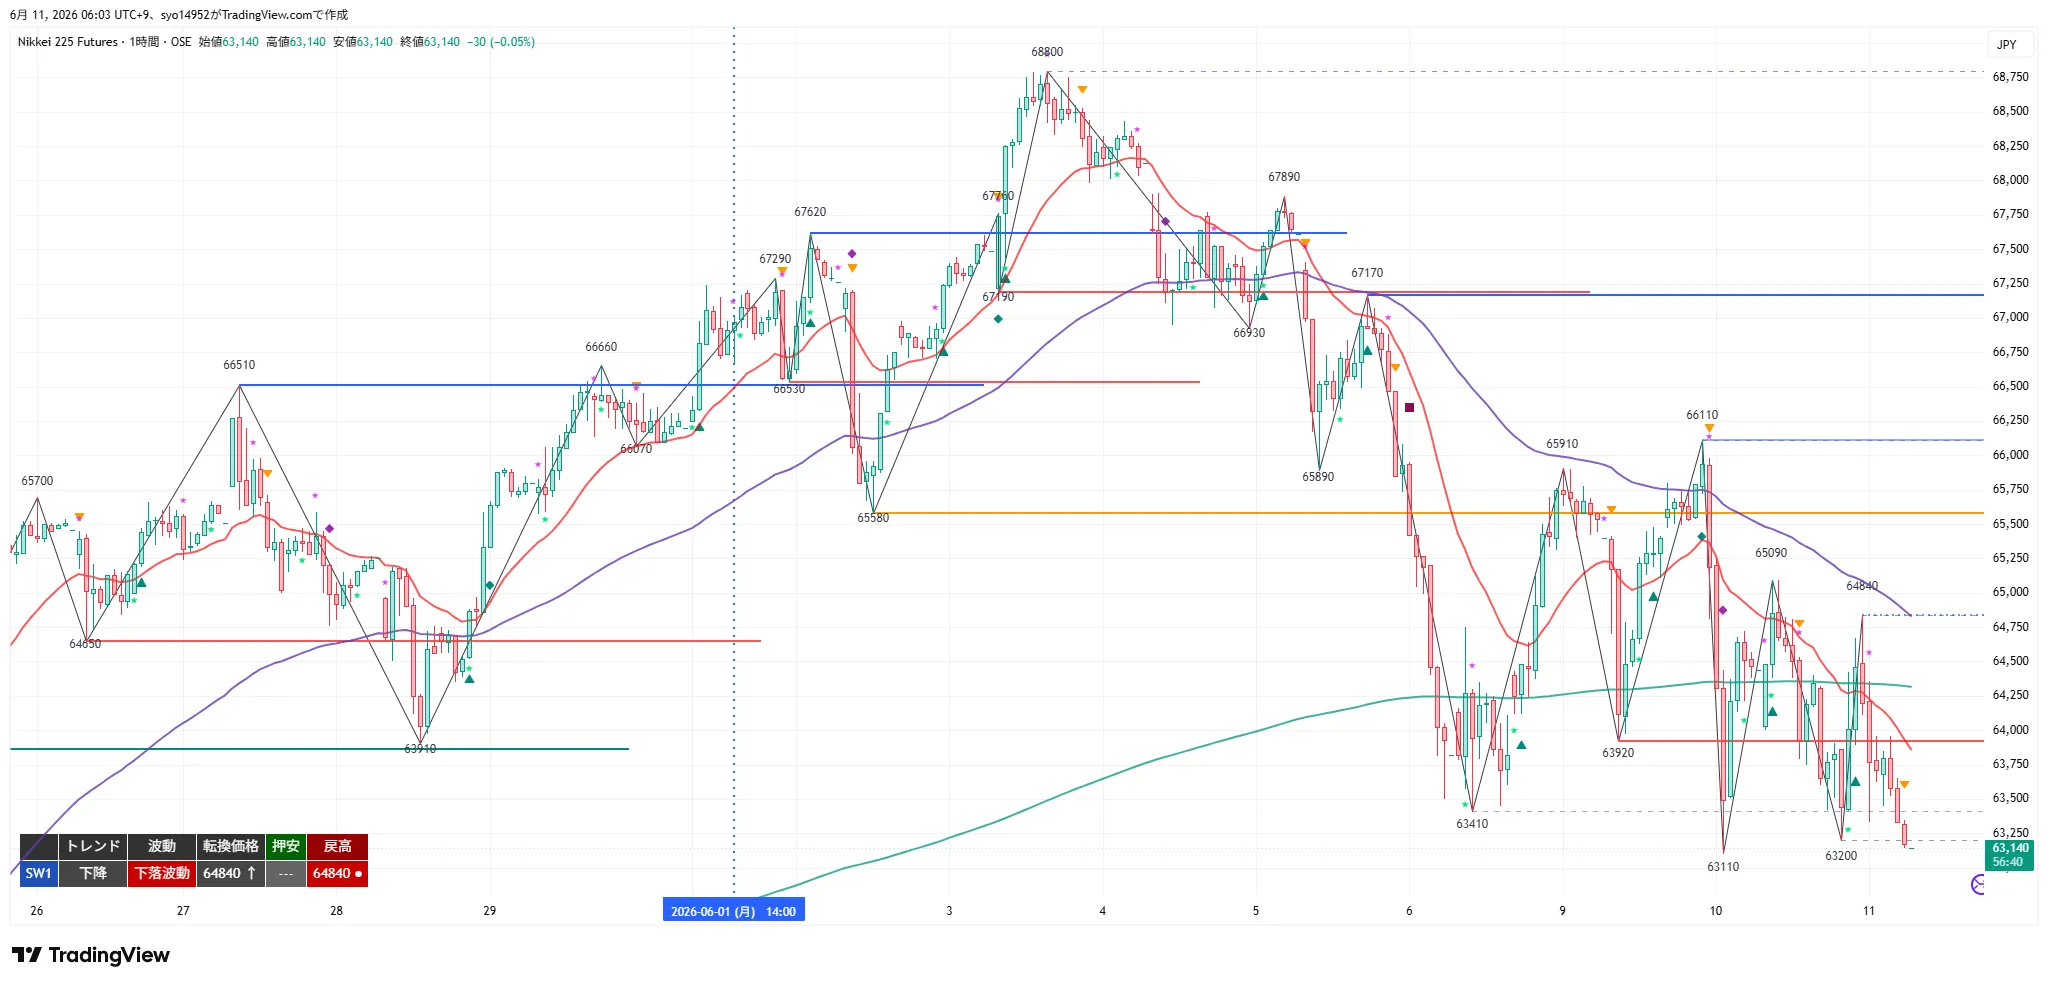
Downward / Downward price movement. Reversal price 64,840, support not yet confirmed, rally high 66,110. Recovered to 64,840 and then declined to 63,140 to close. Below the 20EMA (roughly 63,900) and below the 480EMA (daily equivalent of 20EMA, around 64,300); the 20EMA slope is downward.
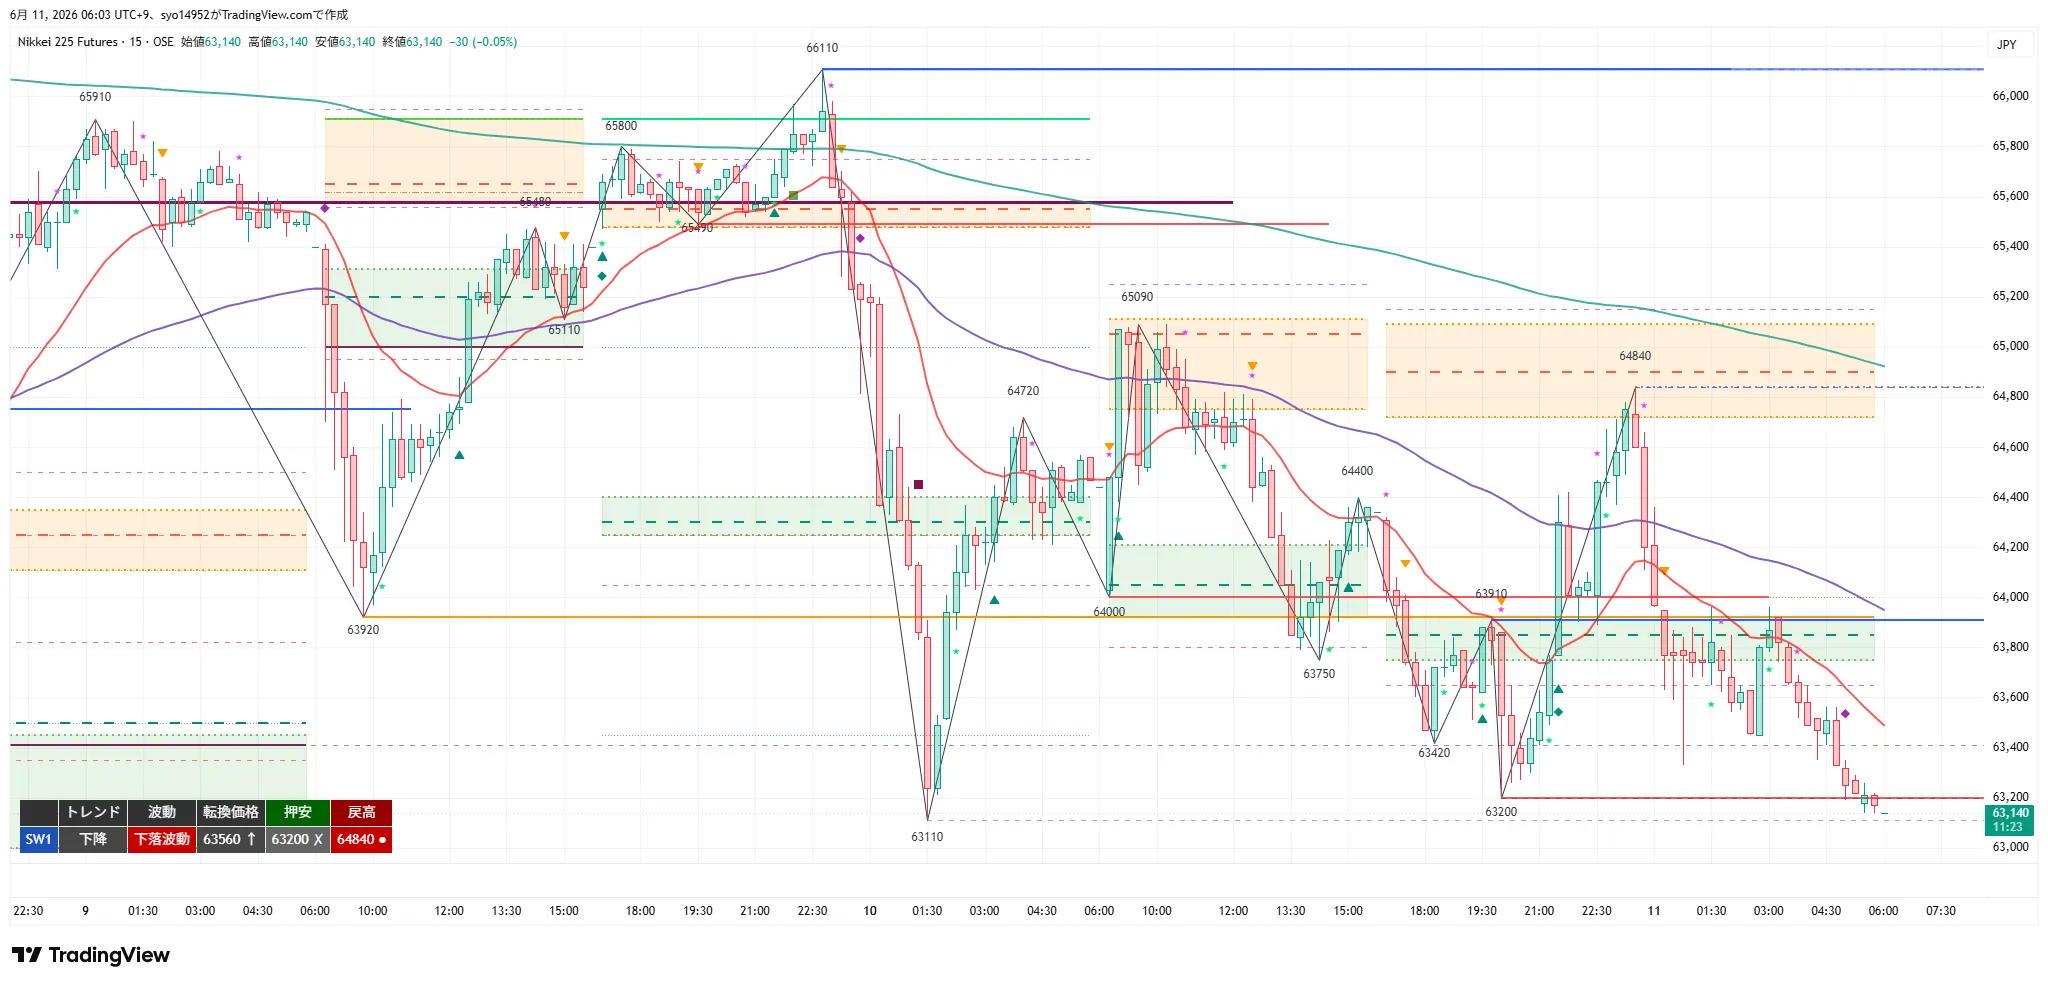
Downward / Downward price movement. Reversal price 63,560, support 63,200 (broke), rally high 64,840. From 64,840 to 63,140, closed lower. Price sits below the 20EMA (around 63,500); current price below the 20EMA. Slope downward.
2. Key Price Levels
3. Verification of Previous Trade Ideas
Target: Night Session
Rebounded from 63,200, after breaking 63,910; confirmed above 64,300 then back entry at 64,040. Reached Target1 (64,720). Entry occurred upon observing a rebound after a decline.
Sell from 64,840, confirmed below 20MA at 63,970. Target1 (64,000) reached, then Target2 (63,450) targeted and achieved. The break below the downward-curving 20MA worked.
Entry at 63,740. Target1 (63,450) achieved. Target2 (63,110–63,000) not reached, night close settled near 63,140. Downward-break-following aligned with the downtrend.
No close above 15m close of 65,090, thus not executed.
4. 4H Analysis
4H shows downtrend / downward price movement. Reversal price 65,090, rally high 66,110, support down to 63,140 being updated. From 66,110, price fell and Night closed at 63,140 after a brief recovery to 64,840. Downtrend continues and accelerates; retrace highs stepped down from 68,800 to 66,110 to 64,840. Current price below 4H 20EMA/20SMA (roughly 64,800–65,300), below 120EMA (daily 20EMA equivalent around 64,500) and below 200EMA (psychological around 63,300). Slope downwards.
The key question is whether the current level, having broken the 200EMA (around 63,300–63,000), will push further lower or recover the 200MA band to halt the decline. On the upside, the down-move continues until a 4H close above 65,090; retracements are likely to be resisted around 64,000–64,300–64,500 (daily 20EMA equivalent) and 64,840 (former support turned resistance). Until 65,090 is reclaimed, treat as a downtrend.
5. 1H Analysis
1H shows downtrend / downward price movement. Reversal price 64,840, rally high 66,110, support not yet confirmed. Recovered to 64,840 and declined to 63,140 to close. Below the 20EMA (approx. 63,900) and below the 480EMA (daily equivalent of 20EMA around 64,300); 20EMA slope downward.
If the 1H 20EMA (approx. 63,900) to 64,000 retrace stalls, it becomes a pullback selling opportunity. If 64,840 is recovered on a 1H close, assess as a genuine upside reversal. Conversely, a 1H close below 63,140 suggests a stronger decline with tests of 62,800 and 62,000. Retracement zone tends to face resistance at 63,910, 64,000, and 64,300–64,500 (daily 20EMA equivalent).
6. 15m Analysis
15m shows downtrend / downward movement. Reversal price 63,560, support 63,200 (broken), rally high 64,840. From 64,840 to 63,140, closed lower. Price below the 20EMA (around 63,500); current price below the 20EMA. Slope downward.
In the short term, if 63,560 closes above on a 15m close, it becomes an upturn candidate for 63,910–64,000. If 63,560 cannot be surpassed, retrace remains weak and breaking 63,140 on a 15m close leads to a full decline toward 62,800. With 15m 20EMA downward and entries below the 20MA, trend-following pullbacks and downward break-following have the edge; dip-buying only on confirmed strong rebound.
7. Conclusion
In the day session, the NK225 futures are in a continuation and acceleration of a 4H downtrend (lower highs: 68,800 → 66,110 → 64,840; 200MA breached). Night session declined from 64,840 to 63,140 and closed lower, indicating a downside-dominated scenario. All timeframes show downward movement; pullback selling and downward break-following align with the trend. Current price 63,140 has fallen below the 200MA band (63,300–63,000). Sustainment of 63,140 or a break below will define direction; whether retracement to 63,560–63,910 is possible will determine direction. With 15m 20EMA also downward, only attempt dip-buying as a contrarian if a strong rebound is confirmed. Always verify the position and slope of the 20MA for entry.
If retracement stalls within 63,910–64,000 or 64,300–64,500, a pullback selling opportunity (trend-following; confirm with 20MA). If 63,140 closes below, downside targets are 62,800 → 62,000. If 63,560 closes above on a 15m close, it could trigger a short-term rebound toward 63,910–64,000 and 64,840 after recovering to a 1H close; until then, the downtrend persists. Short-term dip-buying limited to a confirmed bounce near the 200MA band (63,300–63,000). Use protective measures for MFE.
8. Trade Ideas
- Entry conditions: After a 15m close above 63,560, price returns near the breakout level or climbs near a slope around the 20MA (watch for pullback buying after breakout). The 20MA touch is only a guide; price may run without returning to breakout price. A 15m breakout is an indication of a 15m upturn and short-term rebound.
- Guideline for pre-entry: around 63,560 (near breakout price).
- Actual entry condition: 1H close recovers 63,910.
- Stop/Invalidation: first tranche breached below 63,140; full position below 63,000.
- Targets: T1 = 63,910–64,000 (partial take + position move), T2 = 64,300–64,500, 64,840.
- RR: Based on pre-entry 63,560 and LC 63,140 (risk 420). T1 +350 = RR 0.8, T2 +740 = RR 1.8. If T1 RR < 1, raise activation threshold and focus on the main lot after a 1H close recovery at 63,910.
- MFE Protection: exit partial or at +200 with small profit, secure at least +100 with +300 or trail. Protect early in 4H downtrends due to reversal rebounds.
- Standard conditions: 63,140–63,000 (Night low / 200MA band), or 62,800 showing a constructive rebound, confirm rebound with a 15m close and enter on a pre-entry. Since all timeframes show a downtrend, it is a strong contrarian play and should be limited to clear rebound confirmations at strong supports like the 200MA band. Enter above the rising 20MA.
- Pre-entry guideline: around 63,200 (rebound from 63,140–63,000 zone).
- Actual entry condition: 63,560 recovered on 1H close.
- Stop/Invalidation: first tranche falls below 62,950; full position below 62,800. If 62,800 is breached, exit completely.
- Targets: T1 = 63,560 (partial take + move), T2 = 63,910, 64,000.
- RR: Based on pre-entry 63,200 and LC 62,950 (risk 250). T1 +360 = RR 1.4, T2 +710 = RR 2.8.
- MFE Protection: exit partial or small profit at +200, secure at least +100 with +300 or trailing. Be cautious of false signals in ongoing downtrends; protect early.
- Standard conditions: 63,560–63,910 (15m reversal / recent rally high), or 64,000–64,500 (downward 1H 20EMA band / daily 20EMA equivalent) to cap upside and confirm slowdown on a 15m close for pre-entry (back-entry). With 15m and 1H 20EMA downward, this is a trend-following short. Ensure entry below the 20MA.
- Pre-entry guideline: 63,850 (rebound stall in the 63,560–63,910 zone).
- Actual entry condition: 63,140 breached on 1H close.
- Stop/Invalidation: first tranche recovers to 64,050; main position recovers to 64,300. Recovery to 64,840 (1H reversal) will invalidate strongly.
- Targets: T1 = 63,140 (partial take + move), T2 = 62,800, 62,000.
- RR: Based on pre-entry 63,850 and LC 64,050 (risk 200). T1 +710 = RR 3.6, T2 +1,050 = RR 5.3. If T1 RR is below 1, raise activation threshold and focus on main lot after 1H close under 63,140.
- Note: If a target is reached at confirmation of entry, skip. In downtrends, if retracements are shallow, raise activation threshold to 64,000–64,300.
- MFE Protection: exit partial or small profit at +200, secure at least +100 with +300 or trailing. Be cautious of false moves in a downtrending market.
- Activation conditions: After 63,140 is broken on a 15m close, price returns near the breakout level or near a sloped 20MA (watch for pullback selling after breakout) with timing on short timeframes for pre-entry (back-entry). 20MA touch is only an aid; it may not return to breakout price. Night low breach = strong downside acceleration.
- Pre-entry guideline: around 63,140 (near breakout price).
- Actual entry condition: 62,800 breached on 1H close.
- Stop/Invalidation: first tranche recovers to 63,560, main recovers to 63,910. Full exit if 64,000 recovers.
- Targets: T1 = 62,800 (partial take + move), T2 = 62,000, 61,800.
- RR: Based on pre-entry 63,140 and LC 63,560 (risk 420). T1 +340 = RR 0.8, T2 +1,140 = RR 2.7. If T1 RR is under 1, raise activation threshold and focus on main lot after 1H close under 62,800 confirmation.
- Note: If target is reached at confirmation of entry, skip. In low-price zones, beware of false moves and rapid rebounds; enter after clear close breach.
- MFE Protection: exit partial or small profit at +200, secure at least +100 with +300 or trailing. Protect early in break-following after 4H downtrend.
9. Current Actions
- Most important line 1: 63,140 JPY. If maintained and retracement stalls, consider pullback selling (trend-following); a close below signals downside acceleration to 62,800 → 62,000.
- Most important line 2: 63,560–63,910. A close above 15m closes triggers a short-term rebound toward 63,910 and 64,000. If stalled beforehand, consider pullback selling (check position and slope of 20MA). Trend remains down until 64,840 is recovered on a 1H close.
10. Cautions
- 4H shows ongoing downtrend with accelerated retracements; retracement highs 68,800 → 66,110 → 64,840; 200MA (~63,300–63,000) also breached. Pullback selling and downward break-following align with the trend; limit reverse-buying to confirms at strong supports like the 200MA band.
- When entering, always verify the position and slope of the 20MA (especially the 15m and 1H 20EMA).Currently, both 15m and 1H 20EMA slopes are downward, so trend-following pullbacks and downward break-following have the edge. Contrarian buy-the-dip should be limited to when the 20MA turns upward. Item ③ in today’s section functioned after 15m 20MA break.
- For break-type entries (① and ④), target near breakout price or the near-sloped 20MA, timing on short timeframes. 20MA touch is only a guideline. RR based on breakout price. In low-price zones, long entries and short entries have closer T1s with smaller RR; raise activation threshold and focus on main lot.
- Prices are highly volatile. Validate each trigger with close price; wicks reaching targets without a close are treated as false signals. In the low-price zone, consider early MFE protection.
- If structure changes over time (higher-low rising/ lower-high falling), unless higher-timeframe structure changes, focus on lower-timeframe (15m) reversal price to determine entry position.
- If the regular market opens beyond price conditions, treat as a gap pass-through, not a standard entry. If target 1 already achieved at the time of activation, skip entry.
11. About This Report
This report analyzes NK225 futures using Dow Theory Indicator across three timeframes: 4H / 1H / 15m. Each timeframe’s own trend table on the chart is read individually and organized as 4H / 1H / 15m.
Note: This report is for information purposes and is not investment advice. Investment decisions are the reader’s responsibility.