

Daily Nikkei 225: 2026/6/11
Link to analysis tool details
We have steadily received high praise.
■ Newly Developed Profit+Indicator DAVID
https://www.gogojungle.co.jp/tools/indicators/73936?via=users_products
■ Skilled Trendline Drawing Indicator “Unmatched Sword”
https://www.gogojungle.co.jp/tools/indicators/54499?via=users_products
■ Indicator Pack MT4/5 Version, Monthly
“Tenka Musou” Sync System
https://www.gogojungle.co.jp/tools/indicators/50319
“David” Sync System
https://www.gogojungle.co.jp/tools/indicators/73939?via=users_products
TradeView edition • Ultimate Sync System Monthly
https://www.gogojungle.co.jp/tools/ebooks/50353
Below: Current analysis article
One-word comment: another decline
Daily chart:MAX Oscillator: Sync Band“Strong decline”
4-hour chart“Strong decline” signalgift
Weekly chart “Neutral” signalgift
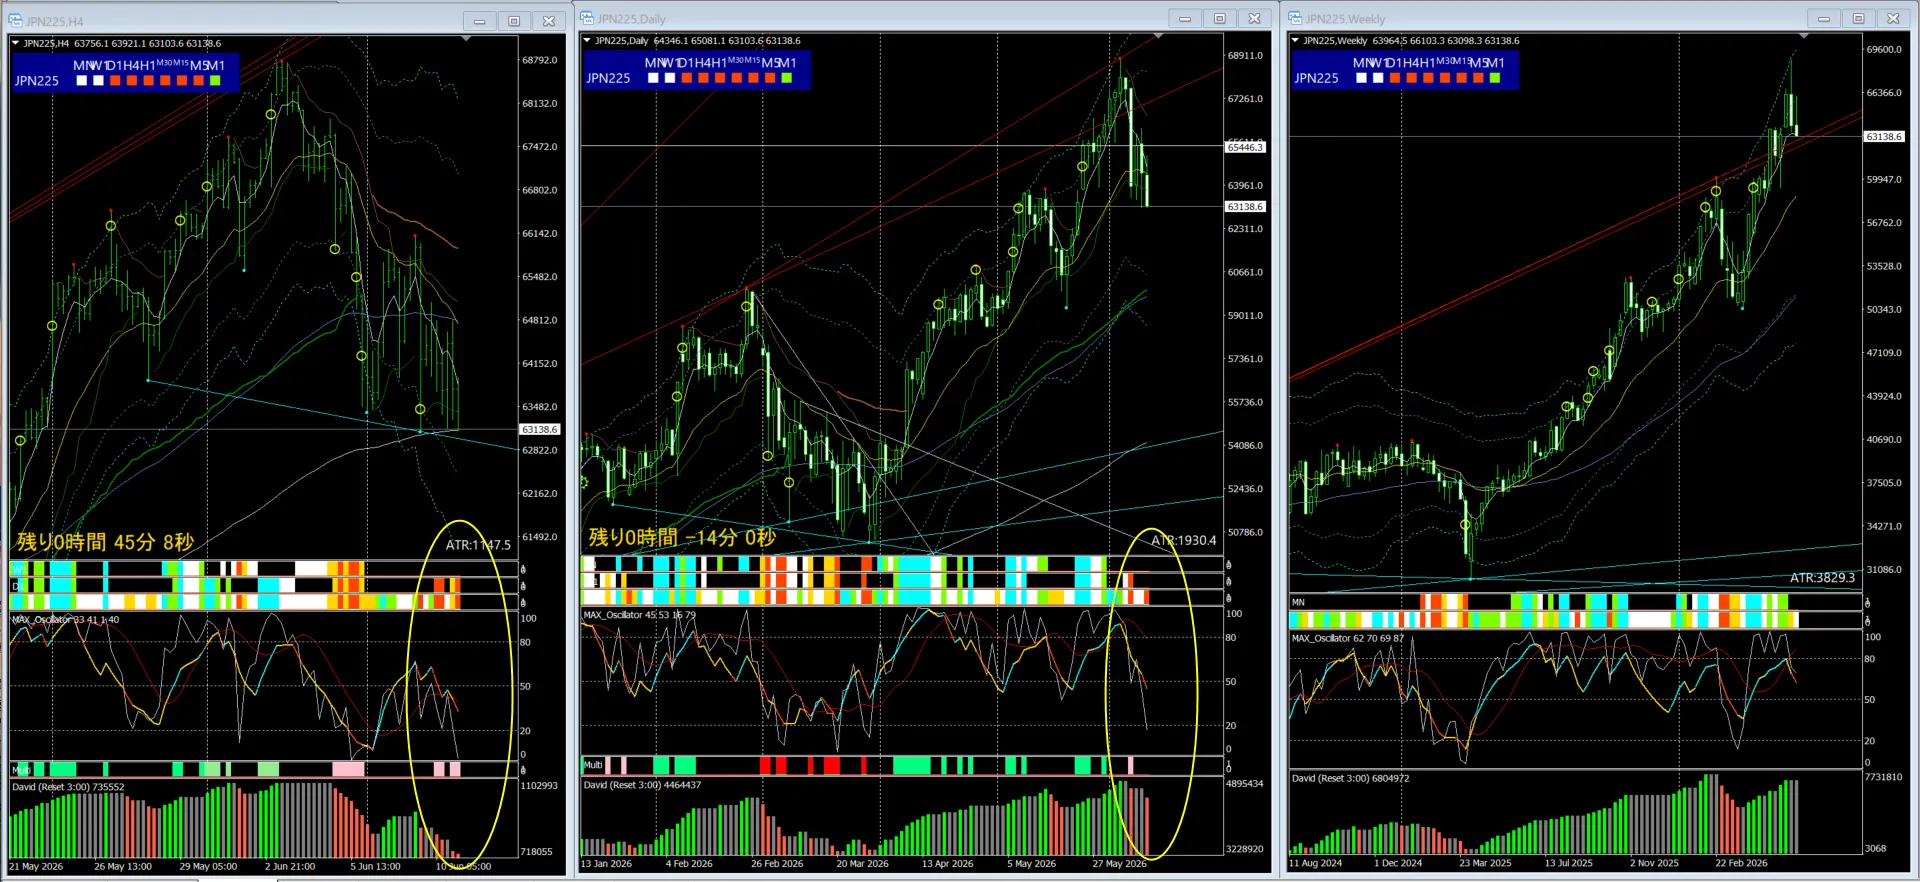
※ Decline Again
At the 4-hour chart level, the Dow highs and lows are downward.
From the daily MAX Oscillator, selling pressure seems to have intensified
A rebound is not impossible, but the overall bias remains bearish
Should we focus on selling on rallies?
Price movement can become extremely volatile depending on the time of day
If it feels dangerous, it may be best to exit immediately and manage risk
Careful risk management remains essential.
Do not ignore near-term conditions; stay flexible to short-term waves
Be especially cautious of sudden drastic changes!
※ Notes
Volatility is quite high, so take care with capital Management.
Original indicators providecurrent analysis commentaryand do not
recommend buying/selling or guarantee future movements.