

What to look at when MFZ Auto SR is viewing USDJPY M5 and there is only a weekly line nearby?
This chart is USDJPY on the 5-minute timeframe.
In the image, the MFZ Auto SR lines displayed near the current price are not many. The most noticeable are the weekly resistance candidate lines on the upper side.
In such a scene, instead of thinking “there are few lines, so nothing to do,”it’s important to observe how the price reacts when it approaches the higher-timeframe lines that existnearby.
MFZ Auto SR is an MT4 indicator that visually displays price zones on lower-timeframe charts that are commonly watched on higher timeframes such as H1, H4, daily, and weekly.
Even if you’re not good at manually drawing horizontal lines from scratch, you can base your scenarios for rebounds, breakouts, pullbacks, and reversals on the lines shown on the chart.
If you want to understand in advance how MFZ Auto SR displays higher-timeframe lines, please refer to this overview page as well.
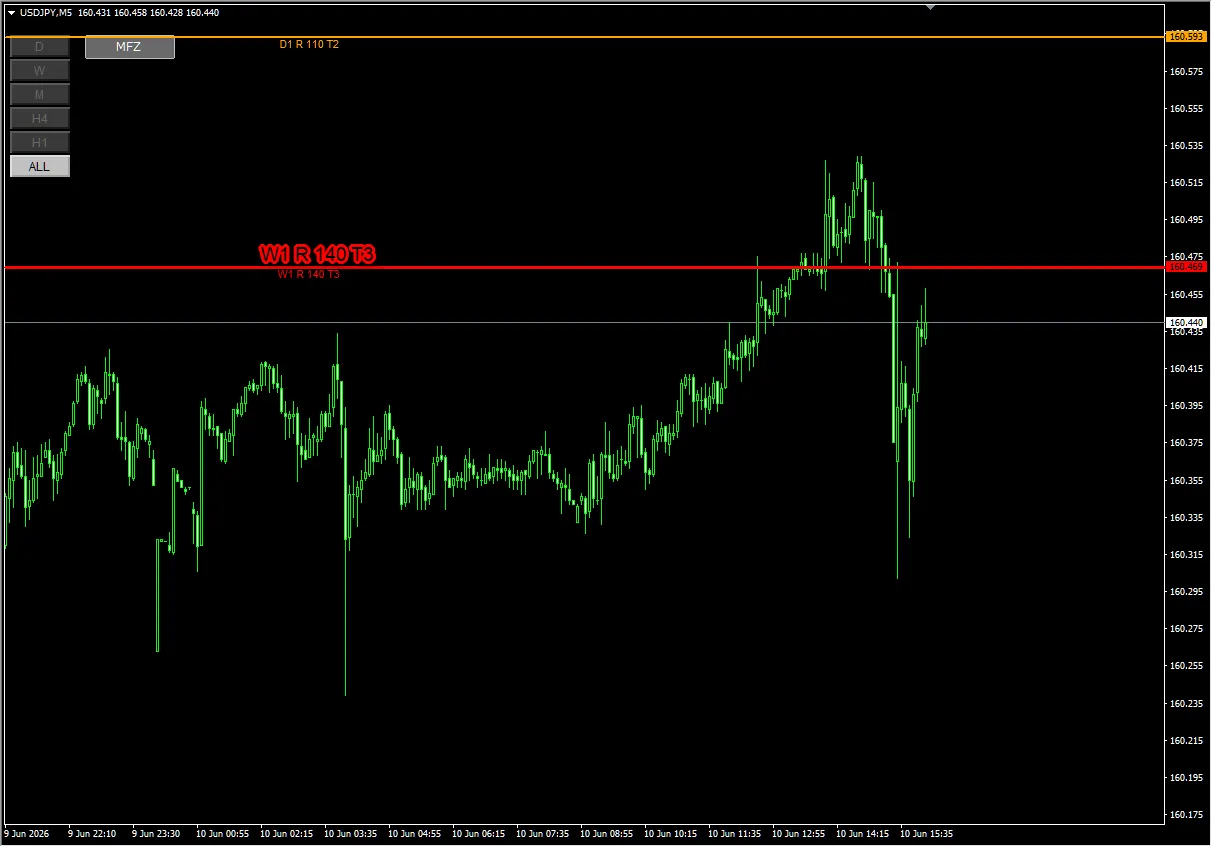
Image: USDJPY M5 chart displaying only MFZ Auto SR
Key points seen in this image
In the first image, a yellow line on the top shows“D1 R 10 T2”which appears as a daily resistance candidate. The price range is roughly around 160.59.
However, the current price is around 160.44 on the right side of the image, so there is a bit of distance to that daily line. The area where the price has recently approached is the red horizontal line“W1 R 140 T3”.
This weekly line is approximately around 160.46–160.47 in the image. Since it is a resistance (R), it is seen as a potential upper-side resistance price zone.
In cases like MFZ Auto SR lines being few nearby, it’s important not to think “there are few lines, so it’s unusable.” Instead, carefully observe the reaction when the price reaches nearby higher-timeframe lines.
Main lines list
| Line | Approximate Price Range | How beginners should view it |
|---|---|---|
| W1 R 140 T3 | Around 160.46–160.47 | Weekly resistance candidate. In the image, there are moments where the price approaches and appears to be capped on the upside. |
| D1 R 10 T2 | Around 160.59 | Daily resistance candidate. It sits slightly above the current price and can become a checkpoint if the price moves higher. |
| Daily Pivot R1 | Around 160.51 | Displayed in the second image. Confluence near recent highs; can be used as a reference for upside reaction. |
| D-Pivot | Around 160.28 | Lower Daily Pivot. If the price falls, this serves as a lower-side reference. |
Focus Line 1: Weekly Resistance Candidate “W1 R 140 T3”
What we want to watch most here is the red horizontal lineW1 R 140 T3.
W1 indicates weekly, R indicates resistance candidate. T3 is a rough gauge of contact or reaction frequency based on the label in the image.
In the image, after the price rises and nears this weekly line, it briefly seems to move above it. Subsequently, it makes a higher high on the top side, but on the right side, it drops back down significantly.
What’s important here is not to assume “a weekly line will always stop the price.”
From the visible range,price reacts near the weekly resistance candidate, and the subsequent price action becomes more volatilenear higher-timeframe lines. Near such lines, confirming rebounds, breakouts, or false breakouts is crucial.
With MFZ Auto SR, the position of the label indicates the timing when that line was created/drawn. In this case, the weekly line’s label is to the left of the chart center, while price later approaches near the line on the right. This means the line wasn’t drawn to fit the current price; the price may have reacted to a pre-displayed line.
Focus Line 2: The Perspective Changes When Overlaying Daily Pivot R1
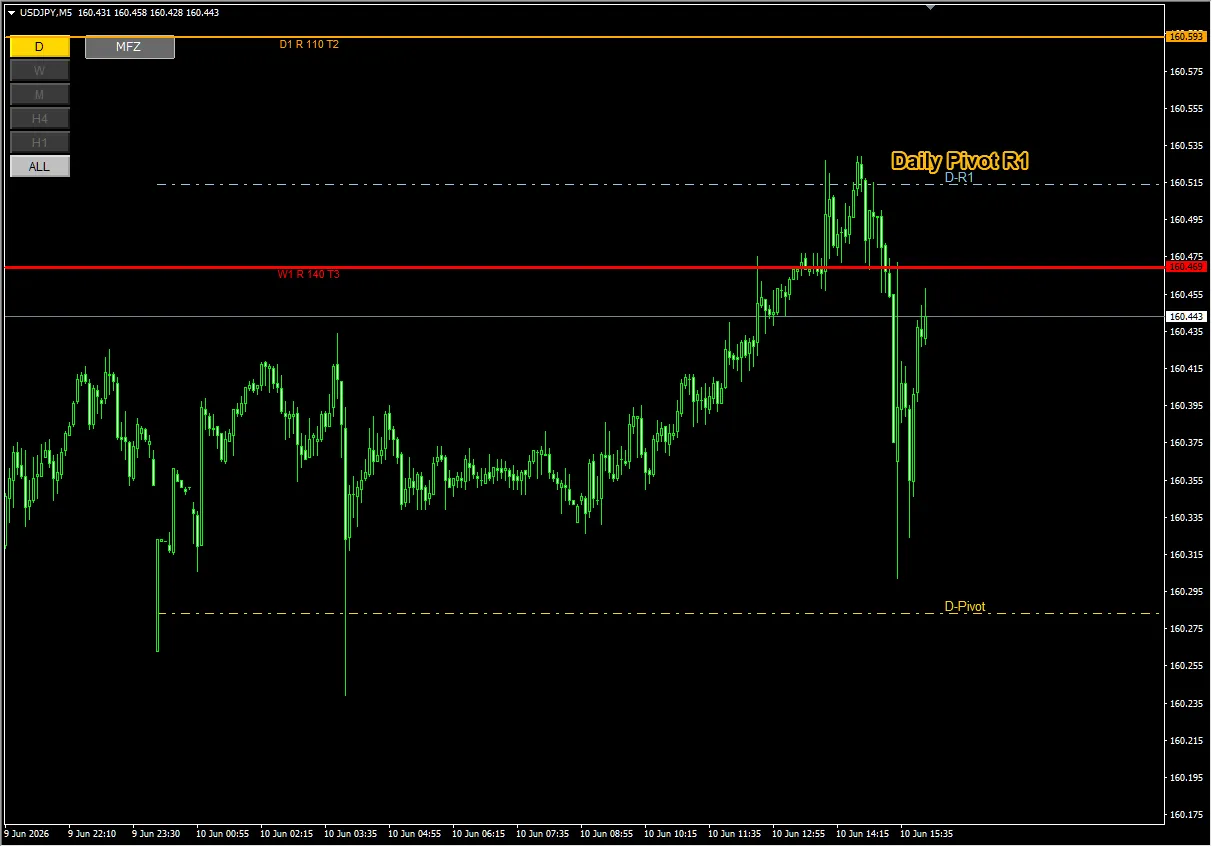
Image: USDJPY M5 chart with MFZ Auto SR overlaid with Daily Pivot
In the second image, in addition to MFZ Auto SR lines, Daily Pivot is displayed.
Recently, after the price broke above the weekly line, it extended further toward the upperDaily Pivot R1area. In the image, the price near Daily Pivot R1 appears to struggle at the upside, followed by a sharp pullback.
This suggests that by looking not only at MFZ Auto SR weekly lines but also at pivot zones, you can further categorize upside reaction scenarios.You can organize scenarios one more step by combining pivot zoneswith MFZ Auto SR lines.
Even when MFZ Auto SR lines nearby are few, using higher-timeframe lines as the axis of environmental awareness, and integrating Pivot or other auxiliary price zones, makes it easier to separate scenarios.
This time’s interpretation
- MFZ Auto SR shows near weekly resistance candidate lines
- Price tests near that weekly line and then moves higher
- Near Daily Pivot R1, upside momentum appears to fade
- Subsequently, price drops, making reaction confirmation near higher-timeframe lines important
Trading plans possible in this scene
Here we are not giving trading directives but organizing scenarios based on lines.
| Scenario | Points to watch | Cautions |
|---|---|---|
| Upside becomes heavy at weekly R | Look for wicks, stalls, and reversals near W1 R 140 T3 | Don’t judge only by touching the line; check candlestick patterns and momentum |
| Break above weekly R | See if the body closes above and upside momentum continues | False breaks can occur right after the breakout; confirm with higher timeframe or pullback checks |
| Upside capped near Daily Pivot R1 | See if highs stop rising near Pivot R1, or if upper wicks/rollovers appear | Don’t rely on Pivot alone; also consider the prior rise and the relation to weekly lines |
| Look for a pullback after a sharp drop | See if price returns near W1 R again, or if it falters there | After a sharp drop, price can be volatile; avoid forcing trades |
What beginners can learn from this chart
In cases like this, what’s important is not “how many lines are shown,” butwhat happens when the price approaches nearby higher-timeframe lines.
MFZ Auto SR helps by displaying higher-timeframe price zones on the chart, making it easier to notice areas you might otherwise overlook when focusing only on lower timeframes.
Especially when the 5-minute chart shows what appears to be a normal up move, if you know there is weekly resistance up above, you can
- understand where this rise is most likely to stall
- know what to check next if prices break higher
- decide how to judge pullbacks for selling opportunities
- organize scenarios when pivot or other references overlap
Such a mindset becomes easier.
Manually drawing weekly, daily, and 4-hour horizontal lines every time is quite time-consuming. MFZ Auto SR helps you check higher timeframe lines while viewing the lower timeframe chart, reducing manual decision-making time and allowing you to focus on scenario creation.
Summary
In this USDJPY M5 chart, the most noticeable MFZ Auto SR lines were weekly resistance candidates.
The price approached near that weekly line, moved briefly higher, but then showed resistance near Daily Pivot R1 and subsequently fell sharply. This scene suggested a possible emphasis on the upper price zone in the chart.
MFZ Auto SR lines do not provide buy/sell answers.
However, by displaying higher-timeframe price zones on the chart, you can more easily see “where to observe reactions,” “what to consider if price breaks through,” and “how to organize judgment when price returns.”
It is not an automated trading EA.
It does not guarantee profits.
The displayed lines are materials for forming trading plans.
Ultimately, trading decisions should be made according to the user’s own rules and risk management.
FOREX involves risk of capital loss, and depending on market conditions, the shown lines or zones may be difficult to function.
Past chart examples do not guarantee future profits.
If you spend time every time searching for higher-timeframe lines, MFZ Auto SR is a very powerful supplementary tool.
If you want to reduce manual decision-making time and focus on scenario creation such as rebounds, breakouts, pullbacks, and reversals, please check the product details page.
This line is not to be missed. Those who tend to decide using only the lower timeframe will likely appreciate the benefit of seeing higher-timeframe price zones on the chart.
Split the scenarios.
Make judgments according to your own rules.