

NK225 Futures MTF Dow Theory Analysis Report 2026-06-10 (For Night Session)
NK225 Futures MTF Dow Theory Analysis Report
1. Trend Table
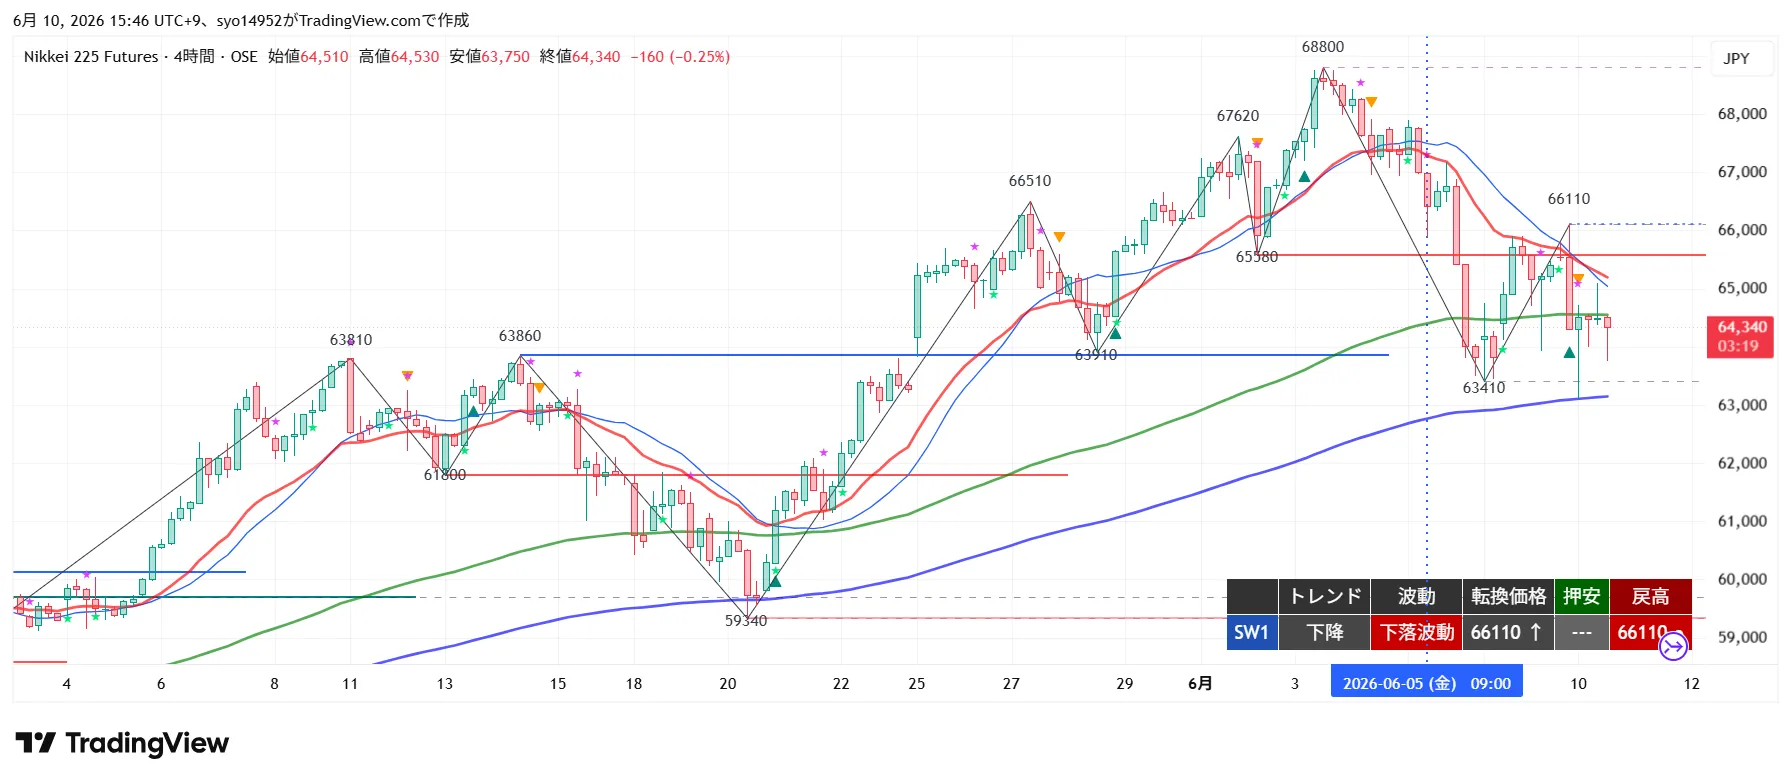
Downtrend / Downward movement. Reversal price 66,110, pullback lows are being updated (most recent low 63,110), return highs 66,110. Rebounded from the previous night's low of 63,110 but the high was pushed down at 66,110, and during the day retraced to 65,090, then fell to 63,750 and closed at 64,340. The downward trend continues. The current price is below the 4H 20EMA/20SMA (around 65,000–65,200) and near the 120EMA (daily 20EMA equivalent, around 64,400), above the 200EMA (psychological, around 63,300). Slope is downward.
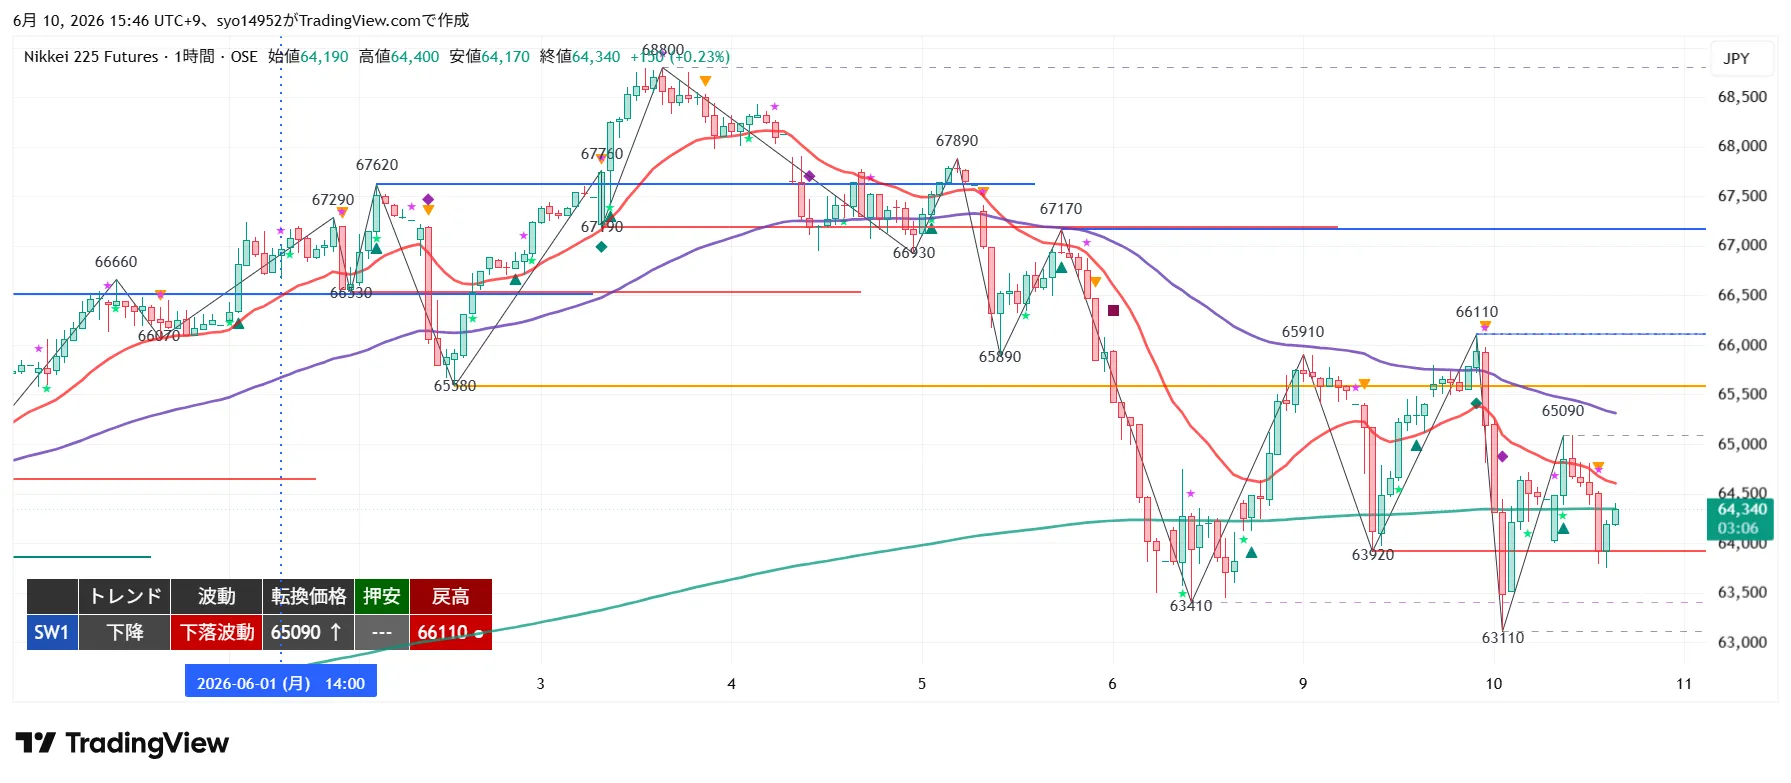
Down / Downward movement. Reversal price 65,090, pullback lows not confirmed, return high 66,110. After returning to 65,090, it fell to 63,750 and closed at 64,340. Below the 20EMA (around 64,600), near the 480EMA (daily 20EMA equivalent around 64,300), and the 20EMA slope is downward.
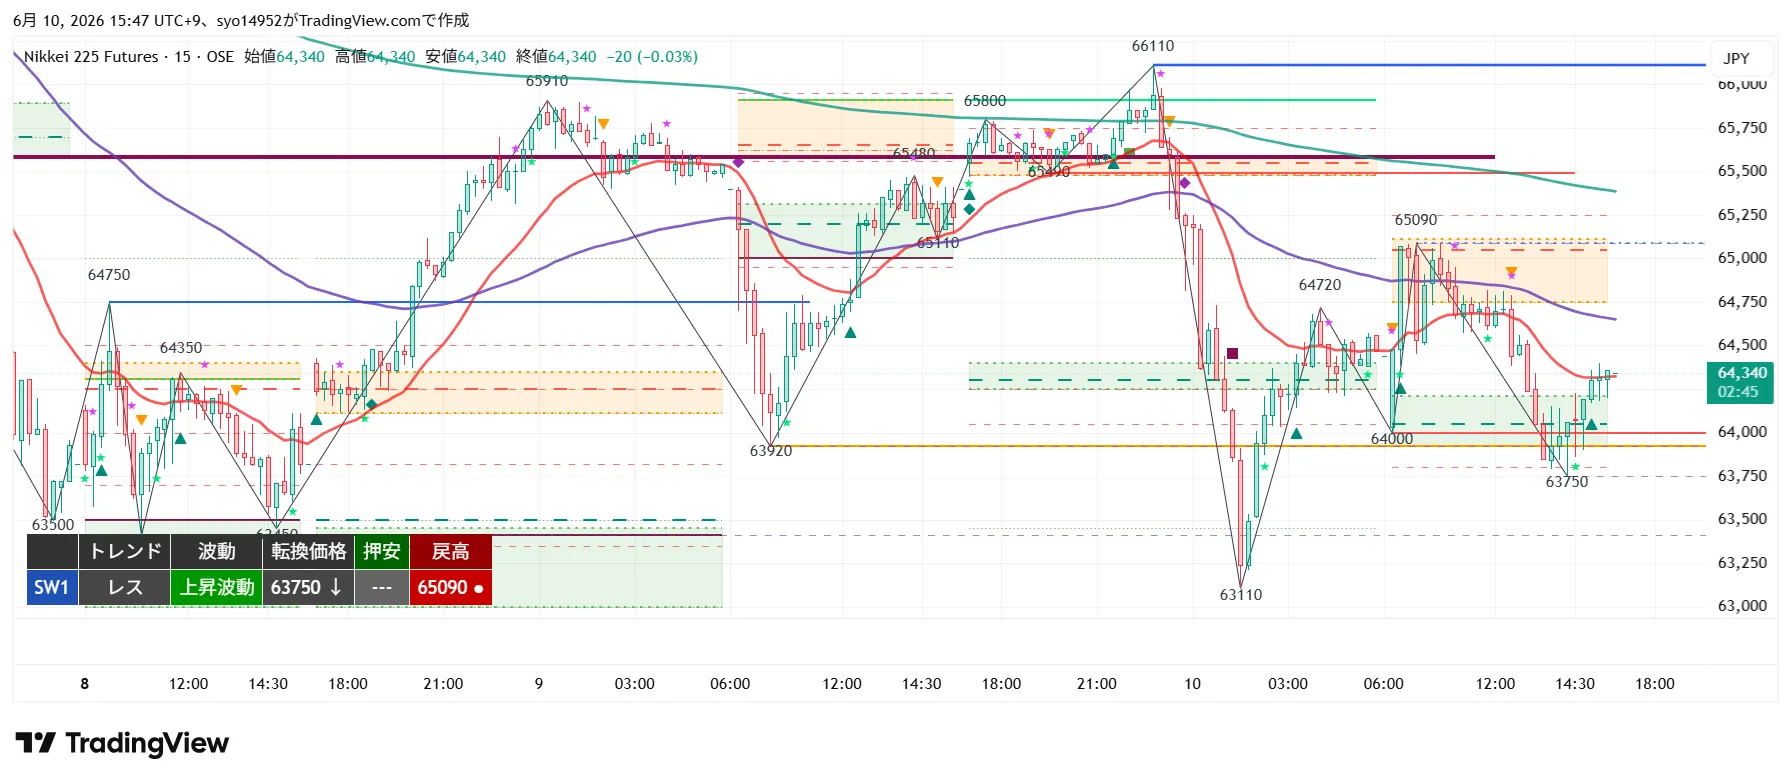
Resist / Upward movement. Reversal price 63,750, pullback lows not confirmed, return high 65,090. Rebounded from 63,750 to 64,340 and closed. 20EMA (about 64,150) turned upward, and the current price is above the 20EMA.
2. Important Price Zones
3. Verification of Previous Trade Ideas
Subject: Intraday session
Opened at 64,000, confirmed rebound from the dip zone at 64,480, and established. Rallied to 65,090 and achieved Target1 (64,750). Target2 (65,110–65,490) remained unachieved, capped at 65,090. The opening level was near the dip candidate band (around 64,210–63,920), and the rebound shape was confirmed by the 15m close.
After the rebound zone stalled, confirmed a break below the 15m 20MA at 64,620, establishing. Target1 (63,920) achieved. Target2 (63,450–63,110) not reached. The move below the down-sloping 20MA proved effective.
Bid broke 64,210, confirmed at 64,050, and moved down without a pullback. Entered on the momentum. Broke 63,920 on the 1H close, establishing the entry. Fell to 63,750 but did not reach Target1 (63,450); exit at close. This case moved with the breakout and did not retrace, allowing a follow-through entry on 1H.
No breakout above 65,110 on 15m close, thus not established.
4. 4H Analysis
4H: Down / Downward movement. Reversal price 66,110, return high 66,110, pullback low updated to 63,110. Rebounded from prior night’s 63,110 but the return high was cut by 66,110, intraday push to 65,090, then down to 63,750 and closed at 64,340. Downtrend continues; the descending structure from 68,800 to 66,110 is maintained. Current price below 4H 20EMA/20SMA (around 65,000–65,200) and near the 120EMA (around 64,400), above the 200EMA (around 63,300). Slope downward.
What matters is whether the current level near the 120EMA (daily 20EMA equivalent) can hold and attempt a bounce, or whether it deepens toward the 200EMA band (around 63,300–63,000, including prior day’s low 63,110). Upside remains until the 66,110 is cleared on a 4H close; returns tend to be resisted by the old supports turned into resistance at 65,090–65,580–65,910. Until 66,110 is recovered, the downtrend is to be treated as continuing.
5. 1H Analysis
1H: Down / Downward movement. Reversal price 65,090, return high 66,110, pullback low not confirmed. After returning to 65,090, fell to 63,750 and closed at 64,340. Below the 20EMA (around 64,600) near the 480EMA (daily 20EMA equivalent around 64,300), and the 20EMA slope is downward.
If the 1H 20EMA (around 64,600) to 65,090 return zone stalls, it becomes a sell-on-rallies scenario. If 65,090 is reclaimed by the 1H close, the rally can gain momentum as a reversal. Conversely, if 63,750 is broken on the 1H close, the downtrend resumes with tests of 63,450–63,110, and resistance at the 200MA band (63,300–63,000).
6. 15m Analysis
15m: Reset / Upward movement. Reversal price 63,750, pullback low not confirmed, return high 65,090. Rebounded from 63,750 to 64,340 and closed. The 20EMA (about 64,150) has turned upward, and the current price is above the 20EMA.
In the short term, as long as 63,750 is held with a 15m close, rebounds should continue toward 64,720–65,000–65,090. If 65,090 is breached on a 15m close, the rebound becomes more established toward 65,490–65,580. Conversely, if 63,750 is broken on a 15m close, a 15m downward reversal resumes toward 63,450–63,110. While the 15m 20EMA is rising, do not enter on a rebound unless the 20MA slope flattens or turns downward and the entry price is below the 20MA.
7. Conclusion
In conclusion, the night session continues the 4H downtrend (rebound high from 68,800 down to 66,110). Intraday also fell from 65,090 to 63,750 and closed at 64,340, maintaining the 63,110–66,110 down-range. Breakdowns and pullbacks follow the 4H/1H downward movement; however, 15m has turned upward from 63,750 and the 20EMA is rising, causing a clash between short-term rebound and higher-timeframe decline. The current price 64,340 sits around the 120MA (daily 20EMA equivalent) and the 1H 480EMA band. The direction will be determined by whether 63,750 (15m reversal) holds or breaks, and whether a rebound toward 65,090 is possible. When entering, always confirm the position and slope of the 20MA, and avoid reverse-entry shorts above the 20MA or longs below it.
If the price stalls in the return zones of 64,720–65,090 or 65,490–65,580, expect a return sell (with 20MA confirmation). If 63,750 breaks on a 15m close, expect further downside toward 63,450 → 63,110 and the 200MA band (63,300–63,000). If 65,090 breaks on a 15m/1H close, a genuine rebound toward 65,490–65,580; if 66,110 recovers on a 4H close, the downtrend remains. Short-term buy-the-dounce (limited) if 63,750–63,450 or the 200MA band (63,300–63,000) show a rebound.
8. Trade Ideas
- Trigger: After closing above 65,090 on 15m, price returns near the breakout price or near the sloped 20MA (watch as a pullback buy after breakout) with timing on shorter timeframes. Note that touching the 20MA is only a guide and price may run beyond breakout without returning. Intraday rebound high / 1H reversal breakout equals momentum for a genuine rebound.
- Guideline for front-running: Near 65,090 (based on breakout price).
- Consolidation condition: 65,090 recaptured by 1H close.
- Stop loss / invalidation: Front-run at 64,720 break; actual exit at 64,340 break.
- Targets: T1 = 65,490–65,580 (partial profit + cost movement); T2 = 65,910, 66,110.
- RR: Front-run 65,090 with LC 64,720 risk 370; T1 +400 RR 1.1; T2 +820 RR 2.2. Since T1 RR is relatively small, trigger after clear upside breakout and focus on main position.
- MFE protection: close at +200 or small profit, secure +300 for at least +100 or trail. Since this is a 4H down-move rebound, protect near 65,490–65,580.
- Standard conditions: 63,920–63,750 (previous 1H reversal / 15m reversal / intraday low), or 63,450–63,110 (old pullback low zone / prior day low / 200MA band) show rebound shape, confirm rebound with 15m close and enter ahead. Since the 4H/1H are in a down-move, this is a counter-trend entry limited to strong support with clear rebound confirmation. Enter above the rising 20MA.
- Guideline for front-running: Around 63,850 (rebound in 63,920–63,750 zone).
- Consolidation condition: 64,720 recaptured by 1H close.
- Stop loss / invalidation: Front-run 63,650 break; actual entry 63,450 break. Break below 63,110 means full exit.
- Targets: T1 = 64,720 (partial profit + cost move), T2 = 65,090, 65,490.
- RR: Front-run 63,850 with LC 63,650 risk 200; T1 +870 RR 4.4; T2 +1,240 RR 6.2.
- MFE protection: close at +200 or small profit, secure +300 for at least +100 or trail. Be cautious of false moves in a downtrend; protect early.
- Standard conditions: 64,720–65,090 (intraday rebound zone / down 1H 20EMA band), or 65,490–65,580 (old 4H pullback low / rebound resistance band) cap the upside and stall; confirm stall with 15m close and enter ahead (back-entry).Do not take reverse-entry shorts when 15m/1H 20MA is rising. Ensure the 20MA slope is flat to downward and that your entry is below the 20MA (currently 15m 20EMA is rising, so be cautious).
- Guideline for front-running: 64,900 (stall in 64,720–65,090 rebound zone).
- Consolidation condition: 63,750 break on 1H close.
- Stop loss / invalidation: Front-run 65,150 recovery; actual entry 65,090 recovery. Recovery of 65,090 (1H reversal) invalidates strongly.
- Targets: T1 = 64,000 (partial profit + cost move), T2 = 63,450, 63,110.
- RR: Front-run 64,900 with LC 65,150 risk 250; T1 +900 RR 3.6; T2 +1,450 RR 5.8.
- Note: If a triggering candle has already reached Target 1, skip. Align with 4H/1H down-movement but, since 15m is an up-move, wait for clear stall + 20MA condition. Today’s position ③ did trigger after 15m 20MA break.
- MFE protection: close at +200 or small profit, secure +300 for at least +100 or trail.
- Trigger: After breaking 63,750 on 15m close, price returns near breakout price or near a slope 20MA (watch as pullback after breakout) and time on shorter timeframes to enter ahead (back-entry). 20MA touch is only a guide; may not return to breakout price and run. 15m reversal break = 15m downtrend resumes.
- Guideline for front-running: Around 63,750 (breakout price).
- Consolidation condition: 63,450 break on 1H close.
- Stop loss / invalidation: Front-run recovers to 64,000; actual entry recovers to 64,340. If 64,720 recovers, exit completely.
- Targets: T1 = 63,450 (partial profit + cost move), T2 = 63,110, 62,800.
- RR: Front-run 63,750 with LC 64,000 risk 250; T1 +300 RR 1.2; T2 +640 RR 2.6.
- Note: If a triggering candle has already reached Target 1, skip. Follows 200MA band (63,300–63,000) and near prior day low 63,110; be cautious of fall-through. Prior to Target 1, focus on main position.
- MFE protection: close at +200 or small profit, secure +300 for at least +100 or trail.
9. Current Action
- Most important line 1: 63,750. Hold to sustain short-term rebound (toward 64,720–65,090); a close below 15m breaks to the downside toward 63,450 → 63,110 and the 200MA band.
- Most important line 2: 65,090. A close above on 15m/1H would cement a rebound toward 65,490–65,580. If stalls earlier (64,720–65,090), sell on the rebound (confirm 20MA position and slope). Until a 4H close above 66,110, the downtrend remains.
10. Cautions
- 4H shows a continued downtrend with a decreasing rebound high from 68,800 to 66,110. Sell-the-rally and follow-down breaks align with the trend, and dip buys should be limited to strong support zones (63,450–63,110 / 200MA band) with rejection confirmations. Do not chase beyond strong support.
- When entering, always confirm the position and slope of the 20MA (especially the 15m and 1H 20EMA).Currently, the 15m 20EMA is rising, so avoid shorting above the rising 20MA; wait for the 20MA to flatten or turn downward, and ensure entries are below the 20MA. The 1H 20EMA is downward, so sell-offs in the rebound zone (64,600–65,090) align with selling. Today’s item ③ worked after confirming the 15m 20MA break.
- For Break-type entries (① and ④), time entries near the breakout price or near the inclined 20MA as pullbacks/rollbacks are watched. The 20MA touch is only a guide. RR is based on the breakout price. Today’s item ④ ran after breakout without returning, allowing a 1H confirmed entry.
- The 63,110–66,110 wide range creates choppy price action. Confirm all triggers on close; wicks or breaks alone are false signals. Activate MFE protection early.
- As time passes, if the structure changes (higher highs/lows in pullbacks and rallies) occurs, unless the higher-timeframe structure changes, emphasize the 15m reversal price to determine front-entry position.
- If the night session starts with prices far above condition prices, treat as a gap-through rather than a regular fill. If a triggering candle has already reached Target 1, skip entry.
11. About This Report
This report analyzes NK225 futures using Dow Theory Indicator across three timeframes: 4H / 1H / 15m. Read each chart’s own trend table separately to organize 4H / 1H / 15m trends.
Note: This report is for information purposes and not investment advice. Please make investment decisions at your own discretion.