

NK225 Futures MTF Dow Theory Analysis Report 2026-06-10 (For the Asia-Pacific session)
NK225 Futures MTF Dow Theory Analysis Report
1. Trend Table
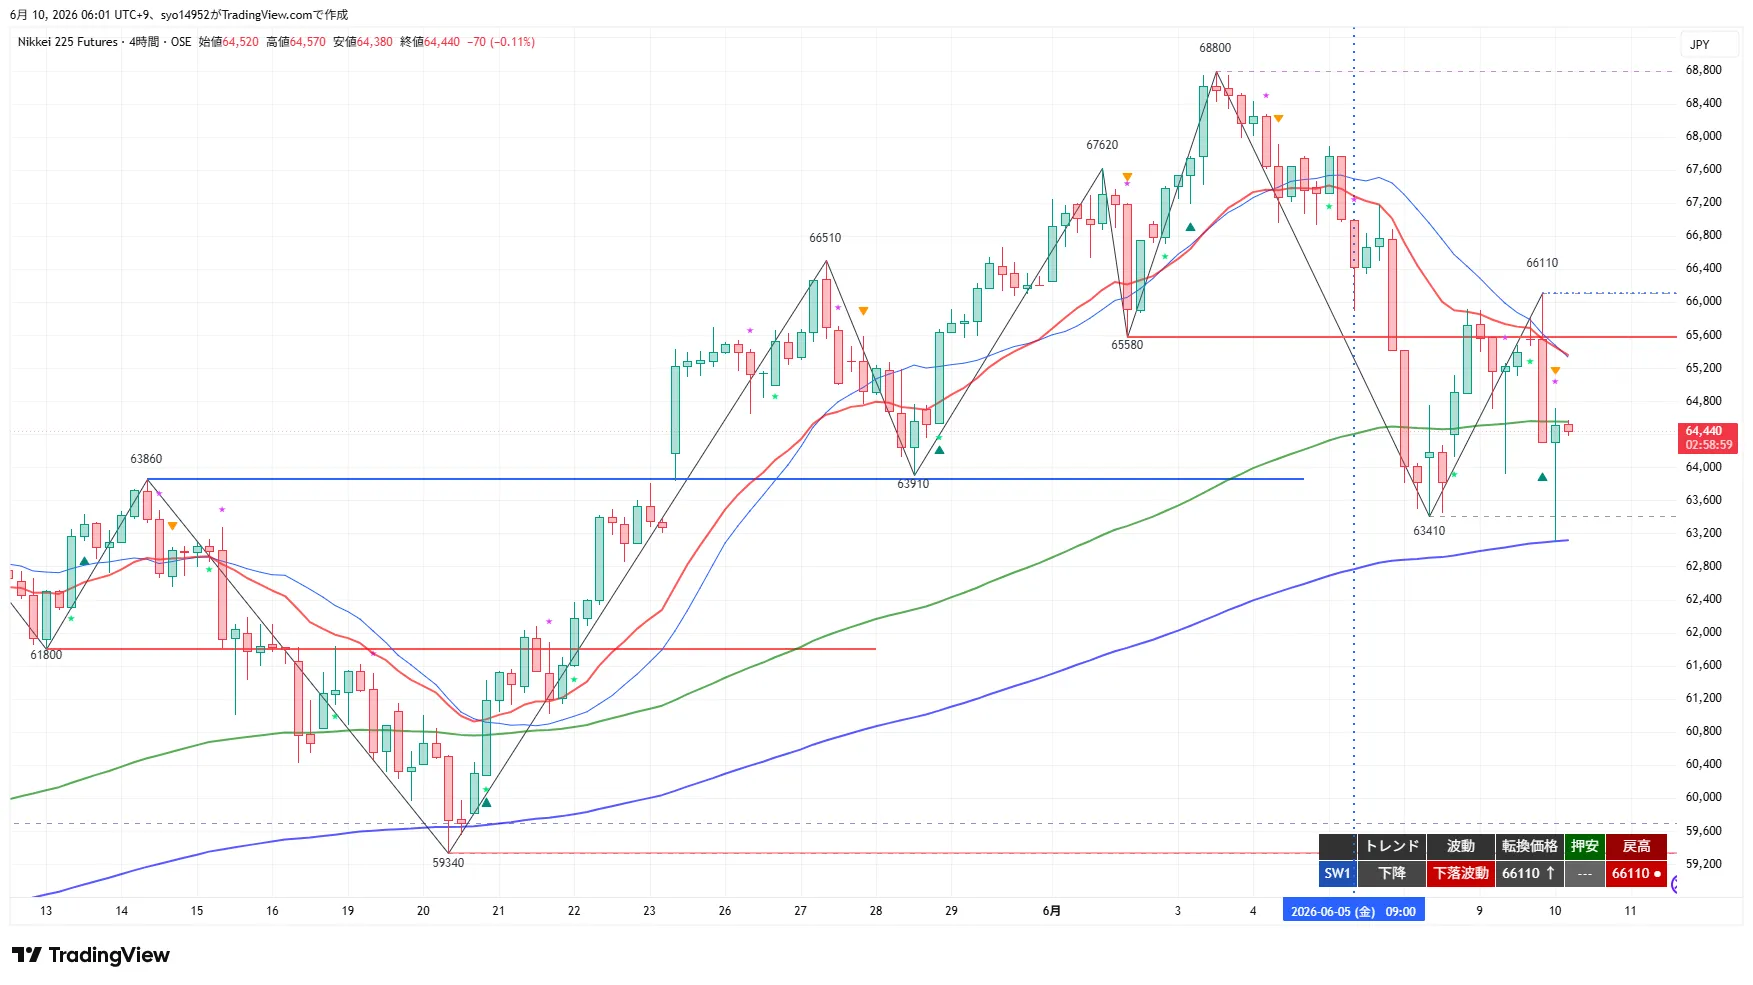
Downtrend / Downward wave. Reversal price 66,110, pullback low being updated (below 63,410; nearest low 63,110), rebound high 66,110. Night session retraced to 66,110 and then plunged to 63,110, closing at 64,440. Downward trend continues. Current value is below 4H 20EMA/20SMA (roughly 65,200–65,400) and near the 120EMA (daily 20EMA equivalent; about 64,450), with the 200EMA (psychological; about 63,200) above. Slope is downward.
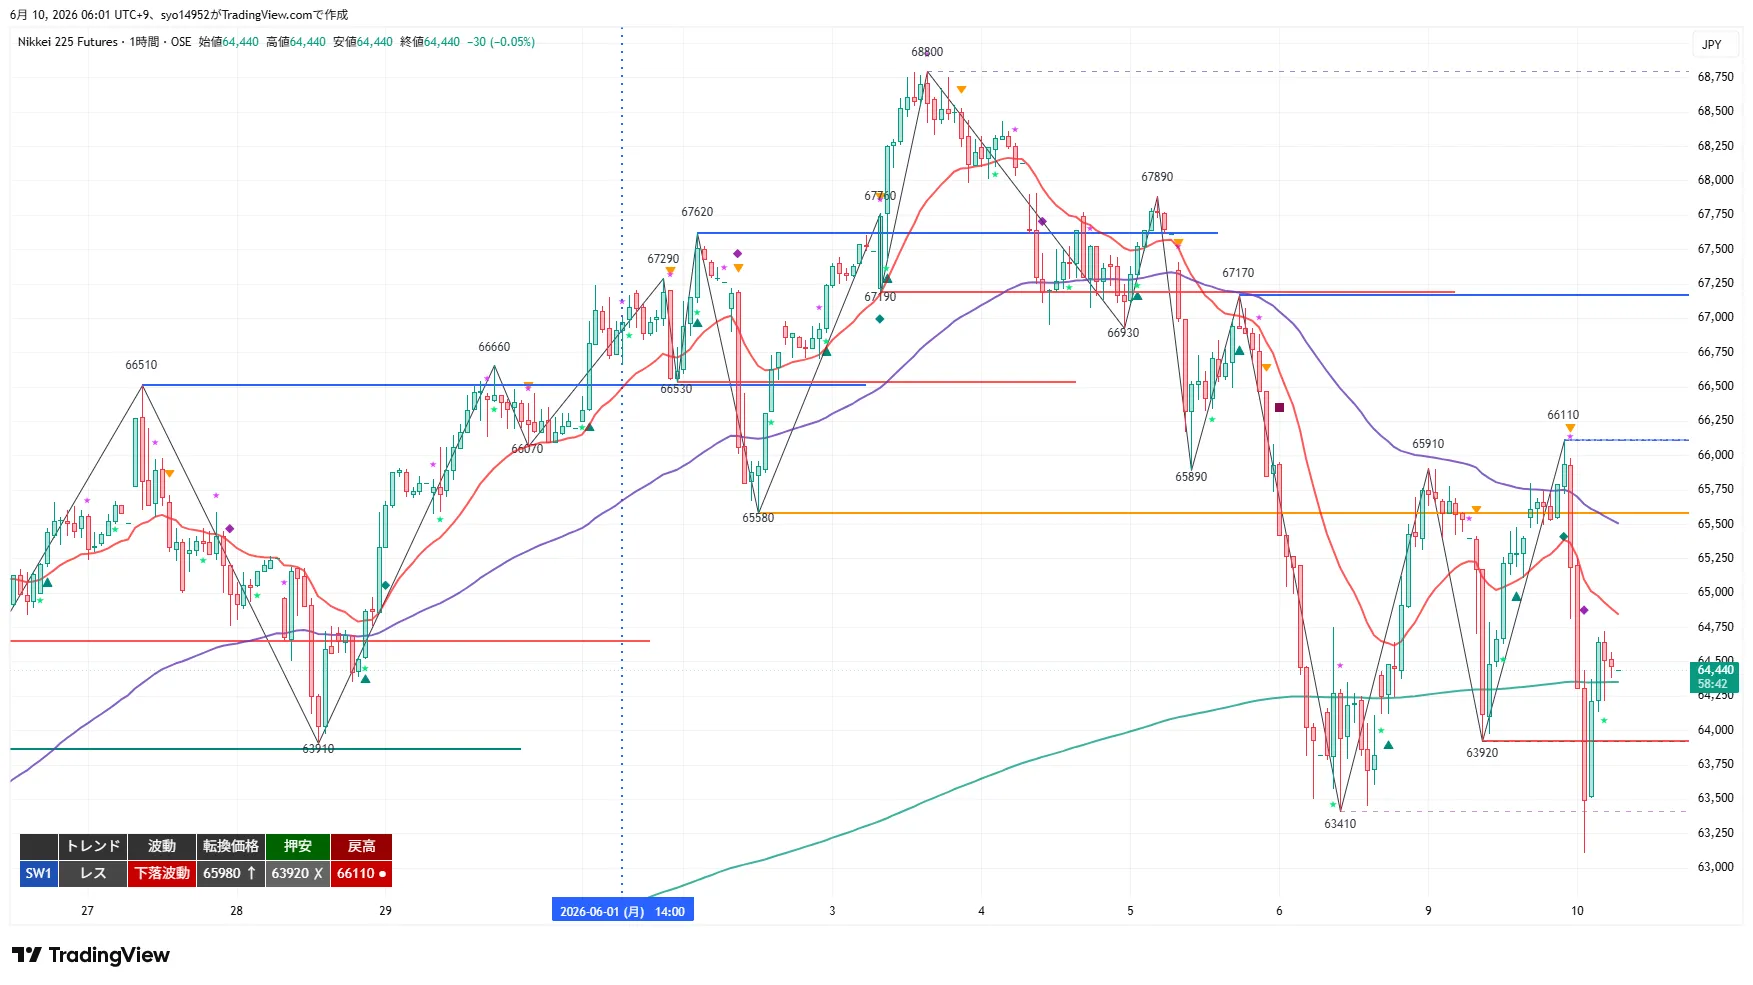
Retrace / Downward wave. Reversal price 65,980, pullback low 63,920 (broke), rebound high 66,110. Fell from 66,110 to 63,110, then rebounded to 64,440 at close. Below 20EMA (about 64,900) near 480EMA (daily 20EMA equivalent; about 64,400), with the slope of the 20EMA downward.
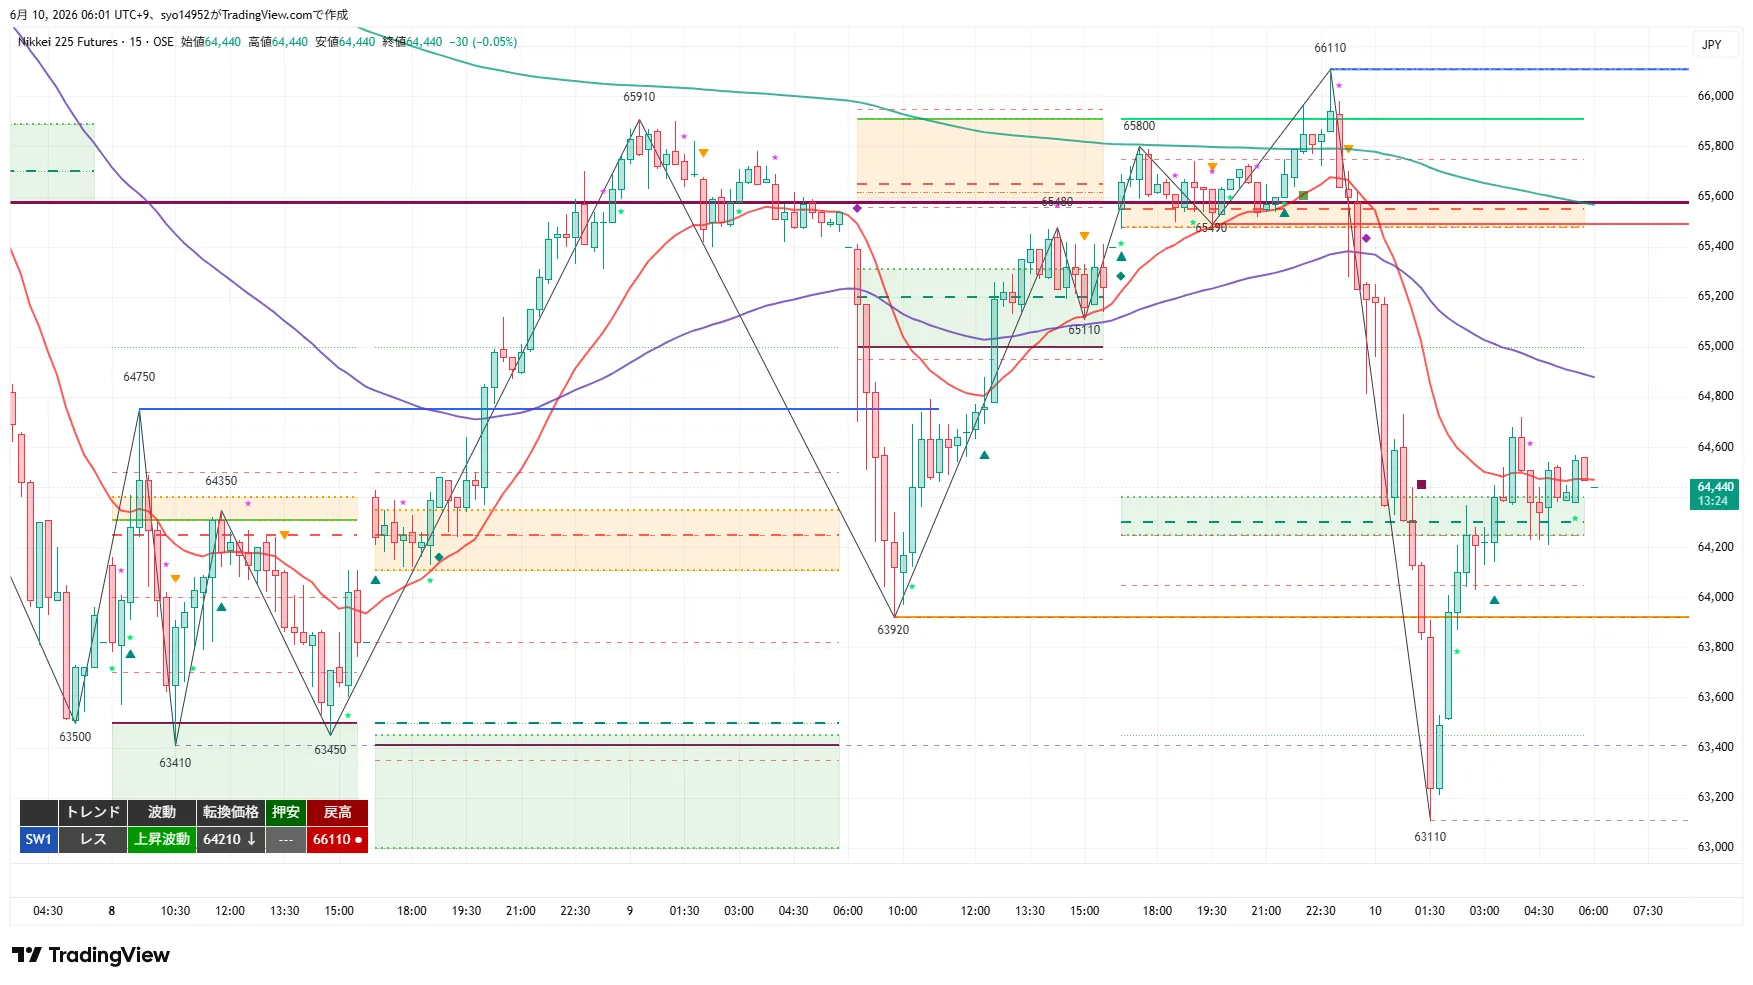
Retrace / Upward wave. Reversal price 64,210, pullback low not yet confirmed (latest low 63,110), rebound high 66,110. Rebounded from 63,110 to 64,440 and closed there. 20EMA (about 64,300) turning upward, current price above the 20EMA.
2. Key Price Levels
3. Verification of Previous Trade Ideas
Target: Night Session
After breaking 65,910, after confirming 65,940, entered on a pullback around 65,920 on a lower timeframe (back-entry established). Reached 66,110, and with +200 from 65,910, settled at entry price due to MFE protection. Then 66,110 plunged, so protection rules saved the trade from losses.
No rebound pattern from pullback candidate zone; simply moved lower. No entry; avoided as designed.
From around 65,910 near the retrace candidate 2, broke below 65,550 entry price, entered at 65,230. Target1 (65,000) and Target2 (64,400) both achieved. Downward retrace selling functioned strongly along the downtrend.
Broke 63,920 to 63,860, back-entry established at 63,900. Target1 63,450 achieved. Target2 63,000 not reached, as night low was 63,110. A new method for backing near the break price worked.
4. 4H Analysis
4H shows a downward/downward wave. Reversal price 66,110, rebound high 66,110, pullback low broke 63,410 and updated to 63,110. Night retraced to 66,110 then plunged to 63,110, rebounded to 64,440 to close. Downtrend continues; retracement high moved from 68,800 to 66,110. Current value is below 4H 20EMA/20SMA (about 65,200–65,400) and near 120EMA (around 64,450), with 200EMA above (around 63,200). Slope downward.
Crucial is whether the current level near 120EMA (daily 20EMA) holds on the downside or further consolidates toward the 200EMA band (around 63,200–63,000). Upside remains pressured until a 4H close above 66,110, with rallies capped near prior supports turned resistances at 65,000, 65,490–65,580, and 65,910. Until 66,110 is reclaimed with a 4H close, treat as a downtrend.
5. 1H Analysis
1H is a retrace / downtrend. Reversal price 65,980, retrace high 66,110, pullback low 63,920 was breached. Fell from 66,110 to 63,110, then rebounded to 64,440. Trend is reset but wave remains downward, with 20EMA (about 64,900) below, and 480EMA (daily 20EMA equivalent; about 64,400) nearby. 20EMA slope downward.
In the downward 1H 20EMA (around 64,900) to 65,110 retrace zone, if it stalls, consider shorting on retrace. If 65,980 is recovered by the 1H close, then consider upside reversal. Conversely, breaking 64,210 with a 1H close suggests resumption of the downtrend toward 63,920–63,450, and potential adjustment toward the 200MA band (63,200–63,000) on a 63,110 close.
6. 15m Analysis
15m is a retrace / Upward wave. Reversal price 64,210, pullback low not yet confirmed (latest low 63,110), rebound high 66,110. From 63,110 to 64,440, closed up. 20EMA (about 64,300) has turned upward, current price above 20EMA.
Short term, as long as 64,210 holds on the 15m close, rebounds may continue toward 64,750, 65,000–65,110. If 65,110 is exceeded on a 15m close, expect stronger retracement toward 65,490–65,580. If 64,210 breaks on a 15m close, anticipate 15m downtrend continuation toward 63,920–63,450. As long as 15m 20EMA is rising, wait for price to stay above 20MA or for 20MA to flatten or turn downward before entering counter-trend trades.
7. Conclusion
In summary, the daytime session remains in a “4H downtrend with lower highs” environment, where night session saw a sharp drop from 66,110 to 63,110 and a rebound to 64,440, constituting a high-volatility adjustment phase. In the 4H downtrend and 1H down wave, retracement selling is dominant, but 15m shows a shift from 63,110 to an upward wave while the 20EMA is turning up, creating a tug-of-war between short-term rebound and higher-timeframe downtrend. The current 64,440 sits at the 120MA (daily 20EMA equivalent) and 1H 480EMA band; determine whether 64,210 (15m reversal) holds or breaks, and whether there is a return to 65,110. Always confirm entry with the position and slope of the 20MA, and avoid counter-trend shorts above the 20MA or longs below the downward 20MA.
If retracement zones around 64,750–65,110 or 65,490–65,580 stall, consider selling the rally (with 20MA confirmation). If 64,210 is breached on a 15m close, expect further downside toward 63,920 → 63,450, and a break below 63,110 signals movement toward the 200MA band (63,200–63,000). If 65,110 closes above on a 15m close, a stronger retracement toward 65,490–65,580 may occur; continue the downtrend until 66,110 is reclaimed on a 4H close. If a rebound is observed near 64,210–63,920 or 63,450–63,110 and confirmed, consider a short-term pullback buy (limited).
8. Trade Ideas
- Trigger: After 15m close above 65,110, observe a pullback near the break price or near a sloped 20MA as a potential entry (early entry/back-entry). The 20MA touch is only a guide and not required to return to break price. Night retracement breakout signals a genuine retracement.
- Early-entry guide: around 65,110 (break price).
- Entry condition: 65,110 regain on 1H close.
- Stop/Invalidation: If early leg falls below 64,750 or main leg below 64,440, exit.
- Targets: T1 = 65,490–65,580 (partial take + move to break-even), T2 = 65,910, 66,110.
- RR: Based on early 65,110 and LC 64,750 (risk ~360). T1 +420 = RR1.2, T2 +800 = RR2.2. Since T1's RR is lower, trigger after clear breakout confirmation and focus on main position.
- MFE protection: exit at +200 for break-even or small gain, or trail with +300 to secure at least +100. Since this is a counter-trend buy within a downward move on 4H, protect early around 65,490–65,580 (previous night’s +200 break-even worked).
- Standard condition: A pullback forming a rebound in 64,210–63,920 (15m reversal) or 63,450–63,110 (older pullback low zone / night low / above 200MA band) and confirm rebound with a 15m close before entering. This is a counter-trend buy in a 4H downtrend and 1H down wave, limited to clear rebound confirmations on strong support. Entry above the rising 20MA.
- Early-entry guide: around 64,050 (rebound from 64,210–63,920 zone).
- Hero entry condition: 64,750 regain on 1H close.
- Stop/Invalidation: If early leg falls below 63,800, main leg below 63,920. If 63,110 breaks, exit fully.
- Targets: T1 = 64,750 (partial take + move to break-even), T2 = 65,110, 65,490.
- RR: Based on early 64,050 and LC 63,800 (risk 250). T1 +700 = RR2.8, T2 +1,060 = RR4.2.
- MFE protection: exit at +200 for break-even or small gain, or trail with +300 to secure at least +100. Be wary of false signals during a downtrend; protect early.
- Standard condition: 64,750–65,110 (former 1H reversal / Night retrace zone / down 1H 20EMA band), or 65,490–65,580 (former 4H pullback low / retracement resistance zone) to cap upside and stall, confirm stall with 15m close before entering (back-entry).Avoid shorting when 15m and 1H 20MA are rising. Ensure the 20MA slope is flat to downward and entry price is below 20MA (currently 15m 20EMA is rising, so be cautious).
- Early-entry guide: around 65,050 (stall from 64,750–65,110 retrace zone).
- Entry condition: 64,210 break on 1H close.
- Stop/Invalidation: Early leg recovers to 65,250, main leg to 65,580. A recovery to 65,980 (1H reversal) provides strong invalidation.
- Targets: T1 = 63,920 (partial take + move to break-even), T2 = 63,450, 63,110.
- RR: Based on early 65,050 and LC 65,250 (risk 200). T1 +1,130 = RR5.7, T2 +1,600 = RR8.0.
- Note: If the trigger is confirmed and Target 1 is already reached, skip. Follow the downward 4H / 1H wave, but wait for a clear stall + 20MA condition since 15m is rising.
- MFE protection: exit at +200 for break-even or small gain, or trail with +300 to secure at least +100.
- Trigger: After 15m close below 64,210, watch for pullback near break price or near a sloped 20MA (as a back-entry for retracement selling). 20MA touch is a guide; may not return to break price and instead run. 15m reversal below indicates 15m downtrend resumes.
- Early-entry guide: around 64,210 (break price basis).
- Entry condition: 63,920 regain on 1H close.
- Stop/Invalidation: Early leg recovers to 64,440, main leg recovers to 64,750. Recovery to 65,110 forces full exit.
- Targets: T1 = 63,450 (partial take + move to break-even), T2 = 63,110, 63,000.
- RR: Based on early 64,210 and LC 64,440 (risk 230). T1 +760 = RR3.3, T2 +1,100 = RR4.8.
- Note: If at the trigger moment Target 1 has already been reached, skip. Night session last night saw 63,920 break and 63,900 back, functioning as expected. Be wary of false moves near the low and approaching 200MA.
- MFE protection: exit at +200 for break-even or small gain, or trail with +300 to secure at least +100.
9. Current Actions
- Most important line 1: 64,210. If held, expect short-term rebound (toward 64,750–65,110). If 15m close breaks below, downside resumes toward 63,920→63,450, and break of 63,110 toward the 200MA band (63,200–63,000).
- Most important line 2: 65,110. If 15m close above, retracement intensifies toward 65,490–65,580. If stalled near 64,750–65,110, consider retracement selling (check position and slope of 20MA). Trend remains down until 66,110 is recovered on a 4H close.
10. Cautions
- 4H remains in a downtrend, with retracement highs moving from 68,800 to 66,110. Retracement selling and downward break-following align with the trend; use pullback buying only when there is strong support and a clear rebound confirmation (63,450–63,110; 200MA zone) to avoid over-committing.
- When entering, always verify the position and slope of the 20MA (especially the 15m and 1H 20EMA).Currently, the 15m 20EMA is rising, so avoid counter-trend shorts above the rising 20MA; wait for 20MA to flatten or turn downward before selling. 1H 20EMA is downward, so a stall in the retracement range (64,900–65,110) aligns with selling.
- For break-type entries (① and ④), seek pullbacks near the break price or near the sloped 20MA as a timing reference for a short-entry (or reverse-entry after break). 20MA touch is only a guide; RR based on break price. Last night, ① achieved +200 break-even (MFE protection) and ④ hit T1 with a back-entry, showing the plan worked as designed.
- Night session saw a sharp plunge from 66,110 to 63,110 with a V-shaped rebound, making price moves very volatile. Verify triggers with close-based confirmations; wicks or intraday touches are not reliable signals. Use quicker MFE protections than usual.
- If structure changes over time (ascending/descending of pullback highs or pullback lows) occur but there is no higher-timeframe structural change, rely on the lower-timeframe (15m) reversal price to judge entry positions.
- If the market gaps at the open, treat as a gap pass-through rather than a new formation. If a trigger reaches Target 1 at the confirmation foot, skip re-entry.
11. About This Report
This report analyzes NK225 futures using Dow Theory Indicator across three timeframes: 4H, 1H, and 15m. Each timeframe contains its own trend table; the 4H / 1H / 15m views are organized accordingly.
Note: This report is for information purposes and not investment advice; investment decisions are the reader’s responsibility.