

Daily chart level lines may jump over and then make a large retracement
This chart shows theGBPAUD 5-minute chartwith the line displayed by “Higher Timeframe Zone Horizontal MFZ Auto SR” superimposed.
In the image, near the daily-level resistance candidate line, price initially breaks above, then is pulled back significantly.
As users may intuitively sense,the daily-level line does not just stop there; it can jump over it and then return sharply.Therefore, it is important not to judge solely at the moment the line is touched, but to consider multiple scenarios by watching candle confirmation, wicks, retracements, and another breakout.
MFZ Auto SR is an MT4 auxiliary indicator that displays price ranges on lower-timeframe charts that tend to be respected on higher timeframes (H1, H4, daily, weekly, etc.).
Even if you are not good at manually drawing horizontal lines from scratch, you can easily confirm higher-timeframe price ranges on the chart, making it easier to organize trading plans for rebounds, breakouts, pullbacks, and retracements.
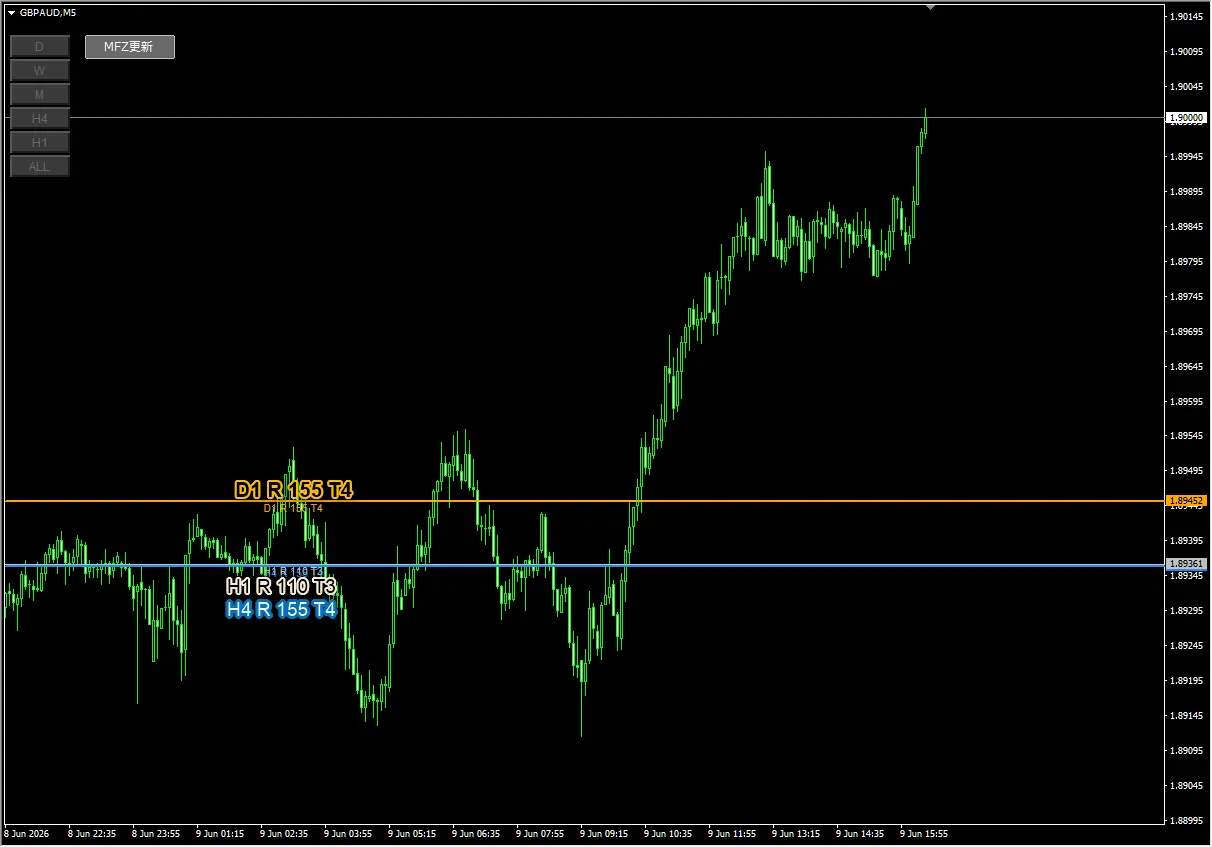
Image: Chart showing MFZ Auto SR horizontal lines on GBPAUD M5
Key points seen in this image
The main point visible on the image isthe current price is moving upward, while there are multiple higher-timeframe resistance candidates located belowremaining
Near the labels on the left of the chart, you can see orange linesD1 R 155 T4and light blue linesH4 R 155 T4as well as white labelsH1 R 110 T3visible.
In MFZ Auto SR, the area near which the label is displayed serves as a rough reference for when the line was created/drawn. In this image, price moves above the line to the right of the label, or retraces, which can be interpreted as price reacting to an already-displayed line, not a line drawn later for convenience.
Main lines list
| Line | Visible price-range hint | Beginner-friendly interpretation |
|---|---|---|
| D1 R 155 T4 | Around 1.8945 | Daily-level resistance candidate. In the image, you can see price briefly break above and then retrace significantly. |
| H4 R 155 T4 | Around 1.8936 | 4-hour-level resistance candidate. Slightly below the D1 line, useful for consolidations or resumption decisions. |
| H1 R 110 T3 | Near the H4 line | 1-hour-level resistance candidate. Close to the H4 line, allowing a grouped price-range view. |
Focus on movement around the D1 R line
What I want to highlight in this image is the orange displayD1 R 155 T4area.
In the image, price rises near this daily-line R level and then slightly breaks above the line, but soon reverses and moves downward significantly.
This is a crucial way to view daily-level lines. Higher-timeframe lines can be perceived as a price range rather than a single point on lower timeframes.
In other words, instead of only looking at the moment the line is touched,check whether it retraces after a slight overshoot, whether the body remains above, and whether it returns toward the line again for support.
Daily price ranges may be observed by many timeframes, yet on lower timeframes like M5 there can be temporary overshoots. As shown in the image, price may appear to break out and then retrace significantly, so it’s important to view lines as zones.
Possible trading plans
What’s important here is not to decide “sell at this line” or “buy because it broke out.”
Lines are not the answer to trading; they are criteria for separating scenarios. Near a D1 R line like this, you can consider plans such as the following.
| Scenario | What to watch | Cautions |
|---|---|---|
| Look for continued breakout | Watch if the D1 R line is broken with a real body and price remains above the line | Right after the breakout, price may retrace, so confirm momentum and a confirming candle |
| Pullback after breakout | When price pulls back toward the broken D1 R line, see if it finds support | Not buy just because it returns; look for stop-hold or reversal patterns |
| Watch for upper wicks and retracement | After overshoot, see whether upper prices get pressured and price retraces significantly | Don’t judge on a temporary drop; also confirm next retrace or new highs |
| Return toward H4/H1 lines | After being pulled back from the D1 line, see if it’s supported near lower H4 R and H1 R | With multiple higher-timeframe lines nearby, viewing them as a price band rather than a single line helps organize scenarios |
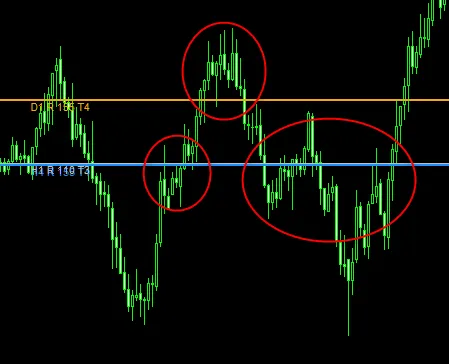
Image: Chart emphasizing the D1 R line with a red circle
Points beginners tend to miss
1. View higher-timeframe lines as ranges, not strict lines
On an M5 chart, a daily-line may appear as a single horizontal line, but in reality daily price ranges do not stop to the exact pip, and can overshoot slightly.
As in this example, price may overshoot and then retrace significantly. Therefore, considering the line as a zone above or below can be helpful.
2. Check the movement to the right of the label
The label position in MFZ Auto SR is a guideline for when the line appeared on the chart.
In the image, price exceeds the D1 R line to the right of the label and then retraces. This trains you to observe how price moves relative to already-displayed lines.
3. When multiple lines are close, treat them as a price zone
Here, D1 R, H4 R, and H1 R appear relatively close to each other.
In such cases, instead of splitting them one by one,view them as an area where higher-timeframe resistance candidates overlapto better organize scenarios.
Manually checking H1/H4/daily highs and lows and drawing lines to sort nearby price ranges takes effort. MFZ Auto SR makes it easier to see higher-timeframe ranges on the lower-timeframe chart, reducing line-drawing time and letting you focus on scenario creation.
Summary: Don’t judge daily lines by mere “break or not break”
In this GBPAUD M5 chart, price first breaks above near the D1 R line, then returns significantly.
From this, you learn that when using higher-timeframe lines, do not simply decide based on whether a line was touched or broken.
Especially for daily-level lines, on lower timeframes there can be temporary overshoots. Therefore, view lines as zones and prepare multiple scenarios such as continued breakout, pullbacks, reversals, and pullback-selling.
MFZ Auto SR is a tool to help you establish those higher-timeframe line-based scenarios on the chart.
It is not an automated trading EA.
It does not guarantee profits.
The displayed lines are material for forming trading plans.
The final trading decision should be made according to your own rules and risk management.
FX carries the risk of capital loss, and depending on market conditions, the displayed lines or zones may be difficult to function.
Past chart examples do not guarantee future profits.
If you spend time every time looking for higher-timeframe lines, MFZ Auto SR is a very reassuring tool.
Even those who tend to judge only from the lower timeframe can easily confirm H1, H4, daily, and weekly price ranges on the chart, making it easier to organize scenarios such as rebounds, breakouts, pullbacks, and retracements.
This line should not be missed. If you want to reduce manual pondering time and focus on scenario creation, please check the detail page.
Divide the scenarios.
Make judgments based on your own rules.