

NK225 Futures MTF Dow Theory Analysis Report 2026-06-09 (For Night Session)
NK225 Futures MTF Dow Theory Analysis Report
1. Trend Table
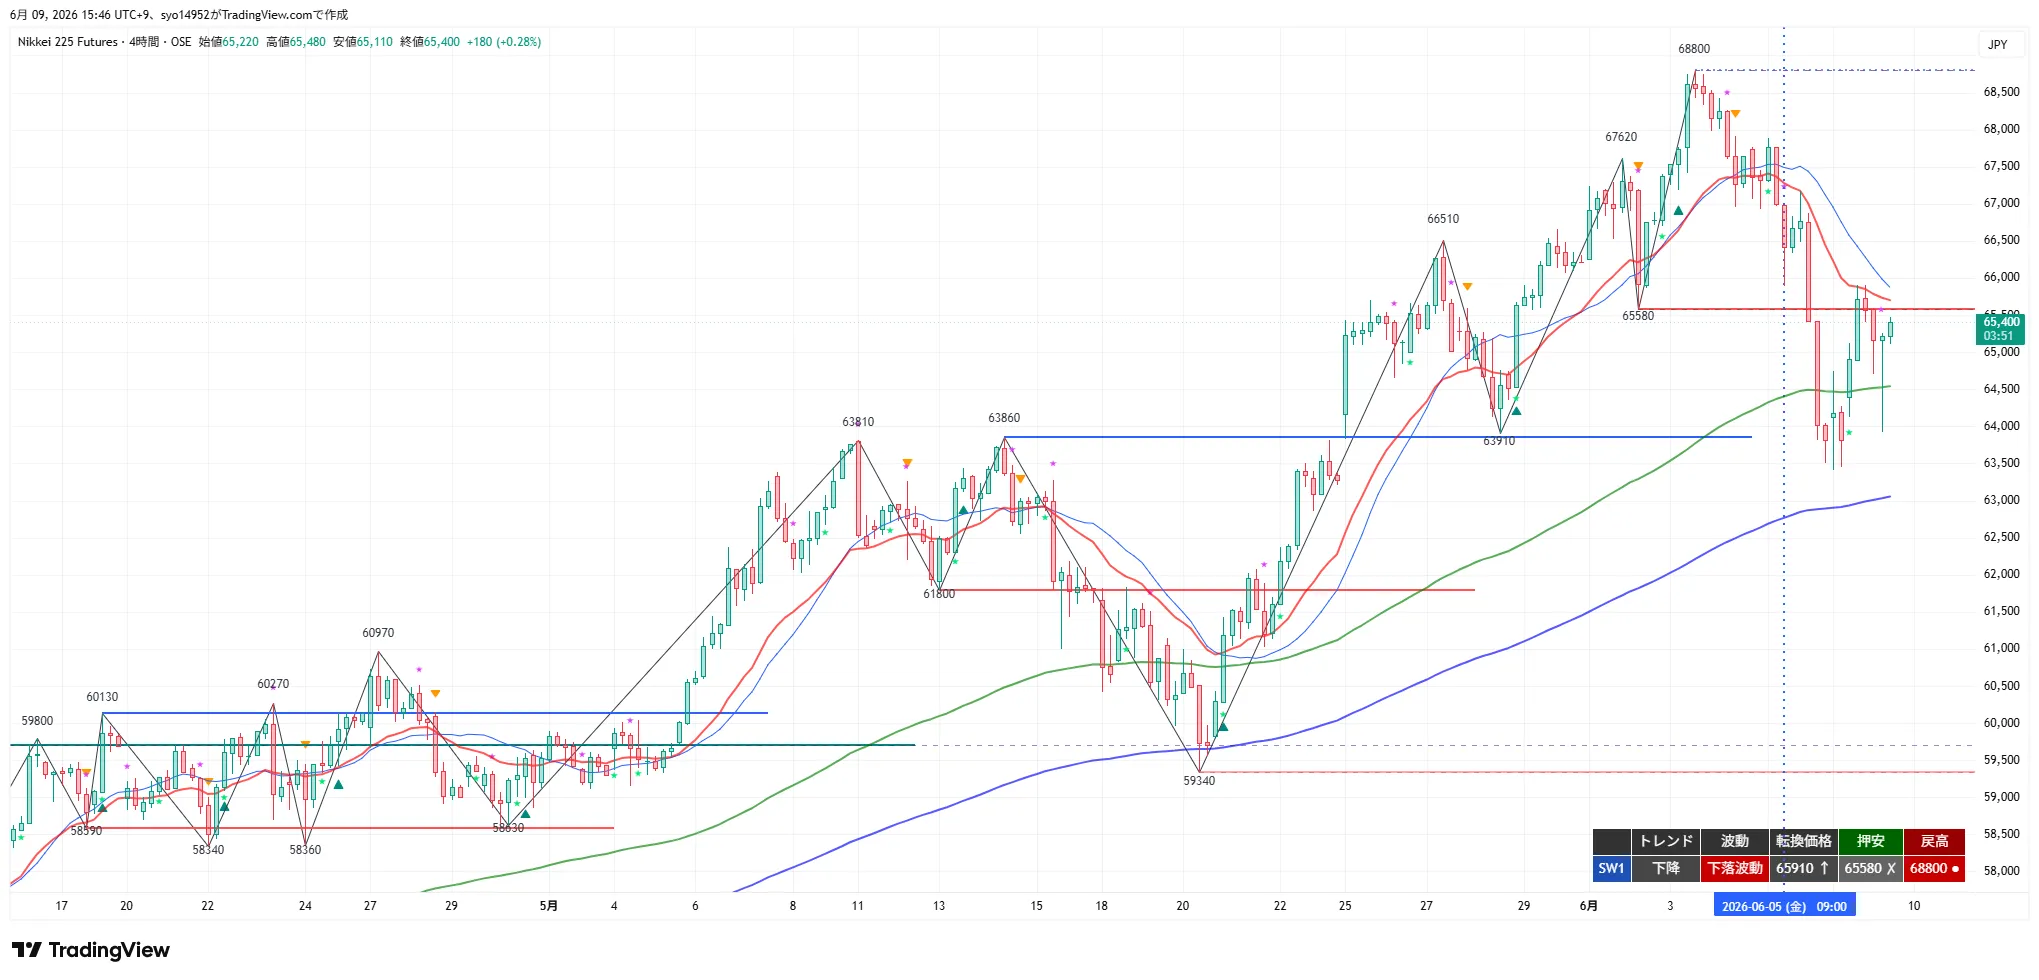
Downtrend / decline wave. Reversal price 65,910, support at 65,580 (breached), retracement high 68,800. Fell from night high of 65,910 to daily low 63,920, then recovered to 65,400 and closed. Downward trend continues. Current price is near the 4H 20EMA (about 65,500) just above the old 4H minor support 65,580, and above the 120EMA (daily 20EMA equivalent, about 64,500) and above the 200EMA (psychological, about 63,000). The slope of the 20EMA is flat to down.
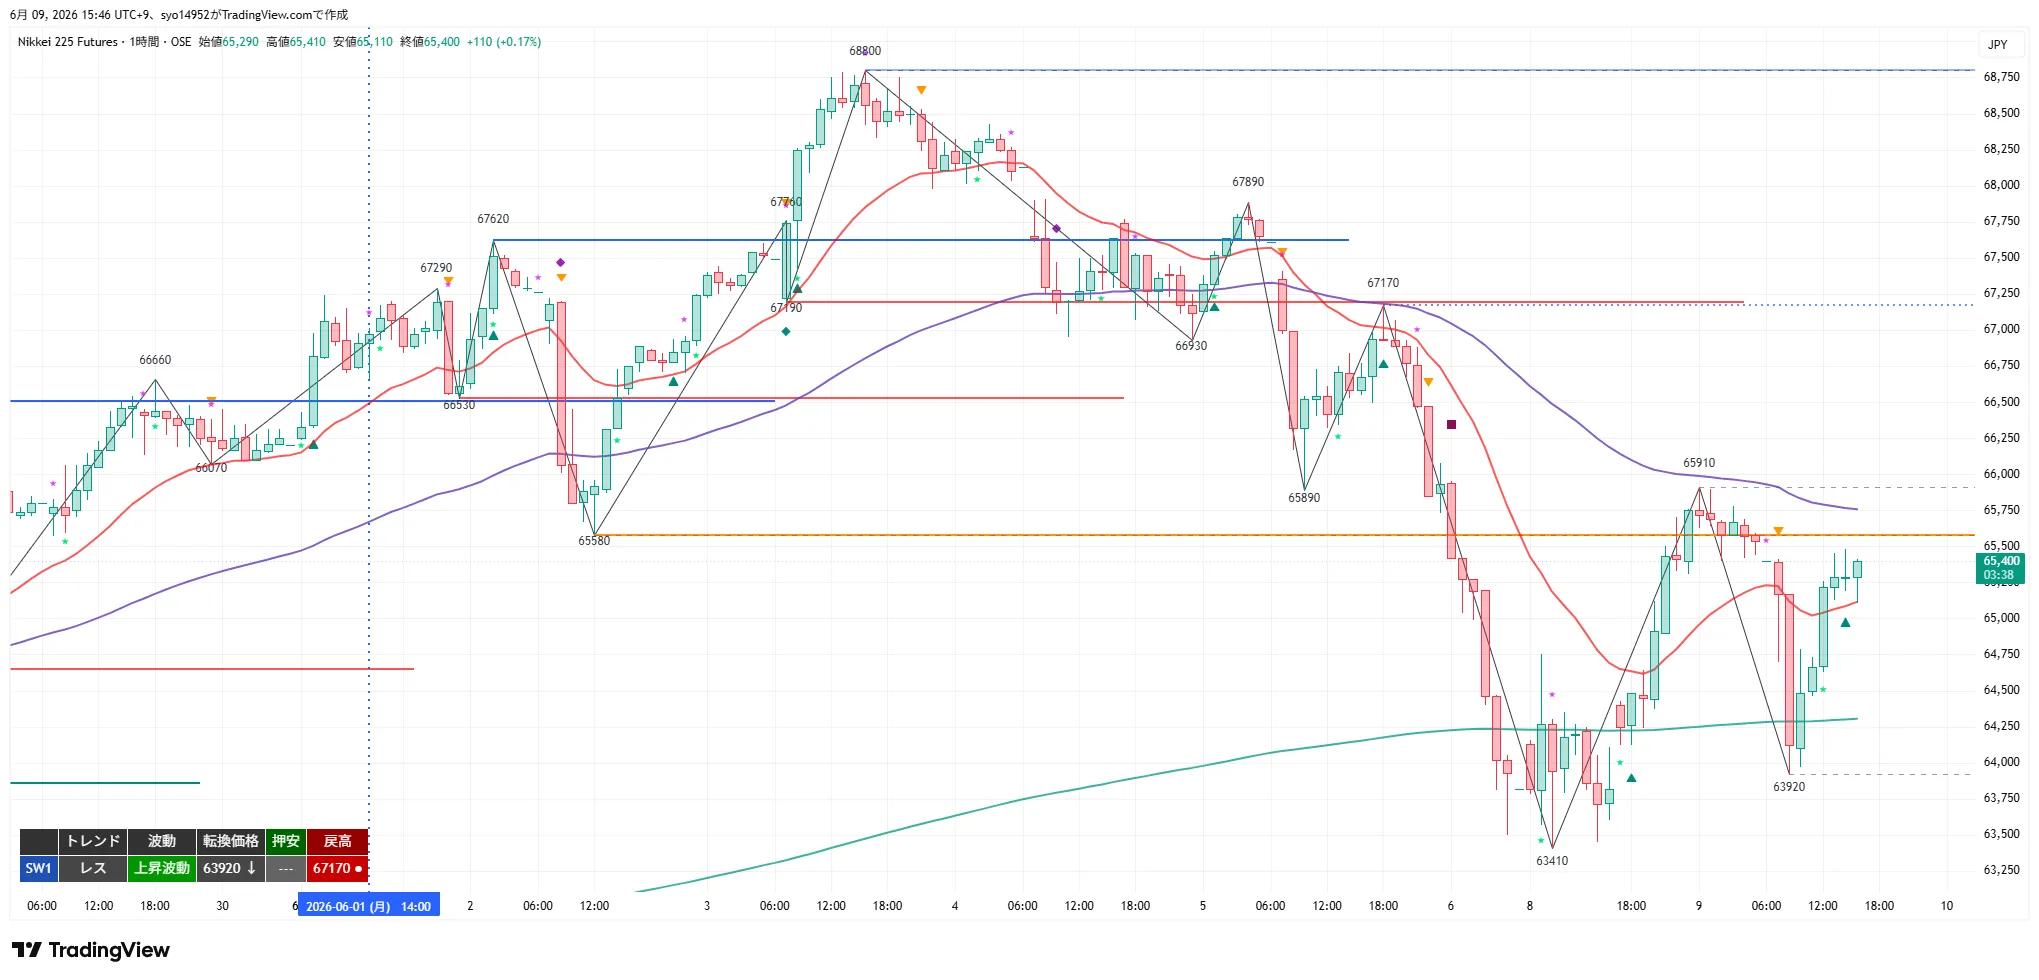
Flat / rising wave. Reversal price 63,920, support yet to be confirmed, retracement high 67,170. From daily low 63,920, rebound to 65,400, trend turning to recovering, wave rising. The 20EMA (about 65,000) is rising, above the 480EMA (daily 20EMA equivalent, about 64,250); current price is above the 20EMA.
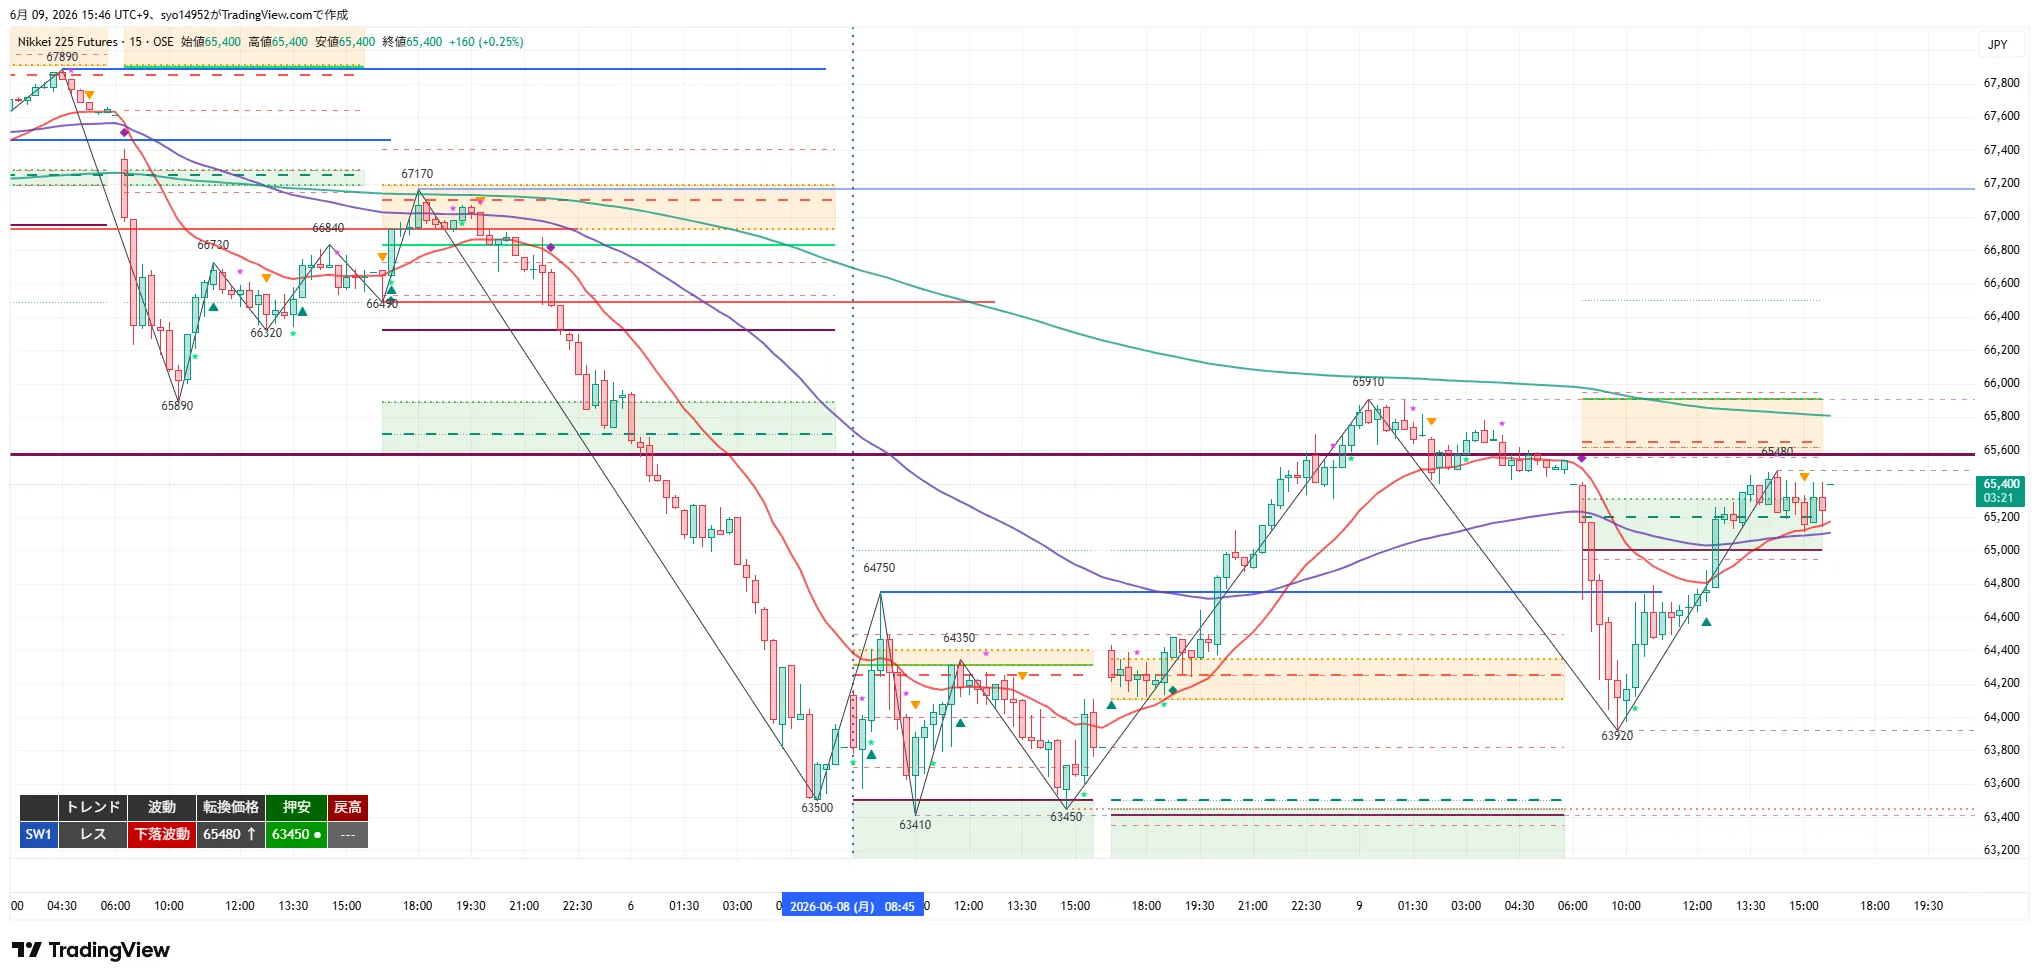
Flat / downward wave. Reversal price 65,480, support 63,450, retracement high --- (latest high 65,480 / intraday high). Rises from 63,920 to 65,480, then closes at 65,400. Within range, the 20EMA (about 65,250) is rising, current price around the 20EMA.
2. Key Price Levels
3. Verification of Previous Trade Idea
Subject of verification: Day session
Broke below 65,310 on a 15m close, but there was no retracement to around 65,310, so the early entry was skipped. However, on 1H it confirmed at 65,170 and fell below the 20MA, so it was valid (core position formed). It fell to the daily low 63,920 and reached Target 2 64,400. The early backup entry did not trigger, but a 1H confirmation + break of the 20MA allowed a trend-following gain.
There was no close above 65,910 on a 15m, so not formed.
Dip-buy zone around 64,400 fell far below to 63,920, breaking the support (core loss-cut at 64,400). Thus, the dip-buy zone was invalid. Not formed.
No retracement to the pullback zone (65,580–65,910) after the open, so did not reach the pullback selling zone. Not formed.