

How to view the price area where the higher-timeframe line and Pivot overlap on the M5 chart of XAUUSD
This time, while looking at the line of the “Higher-Timeframe Zone Horizontal Line MFZ Auto SR” displayed on the XAUUSD M5 chart, we will organize in a way that is easy for beginners to understand what price ranges to look at and how to read them.
In the image, after a sharp downward move,H4 S 80 T3the price repeatedly bounces near the blue line, then turns upward again. In another product’s Pivot display,the vicinity of Monthly Pivot S1 appears to be a resistance candidate at the upper pricelevel.
MFZ Auto SR is an MT4 utility that displays price ranges commonly watched on higher timeframes such as H1, H4, daily, weekly, etc., on lower-timeframe charts as contextual awareness tools.
If you find it bothersome to search for higher-timeframe horizontal lines manually each time, or if you tend to overlook important higher-timeframe price levels by only looking at lower timeframes, this tool helps you organize your decision-making material for trading plans.
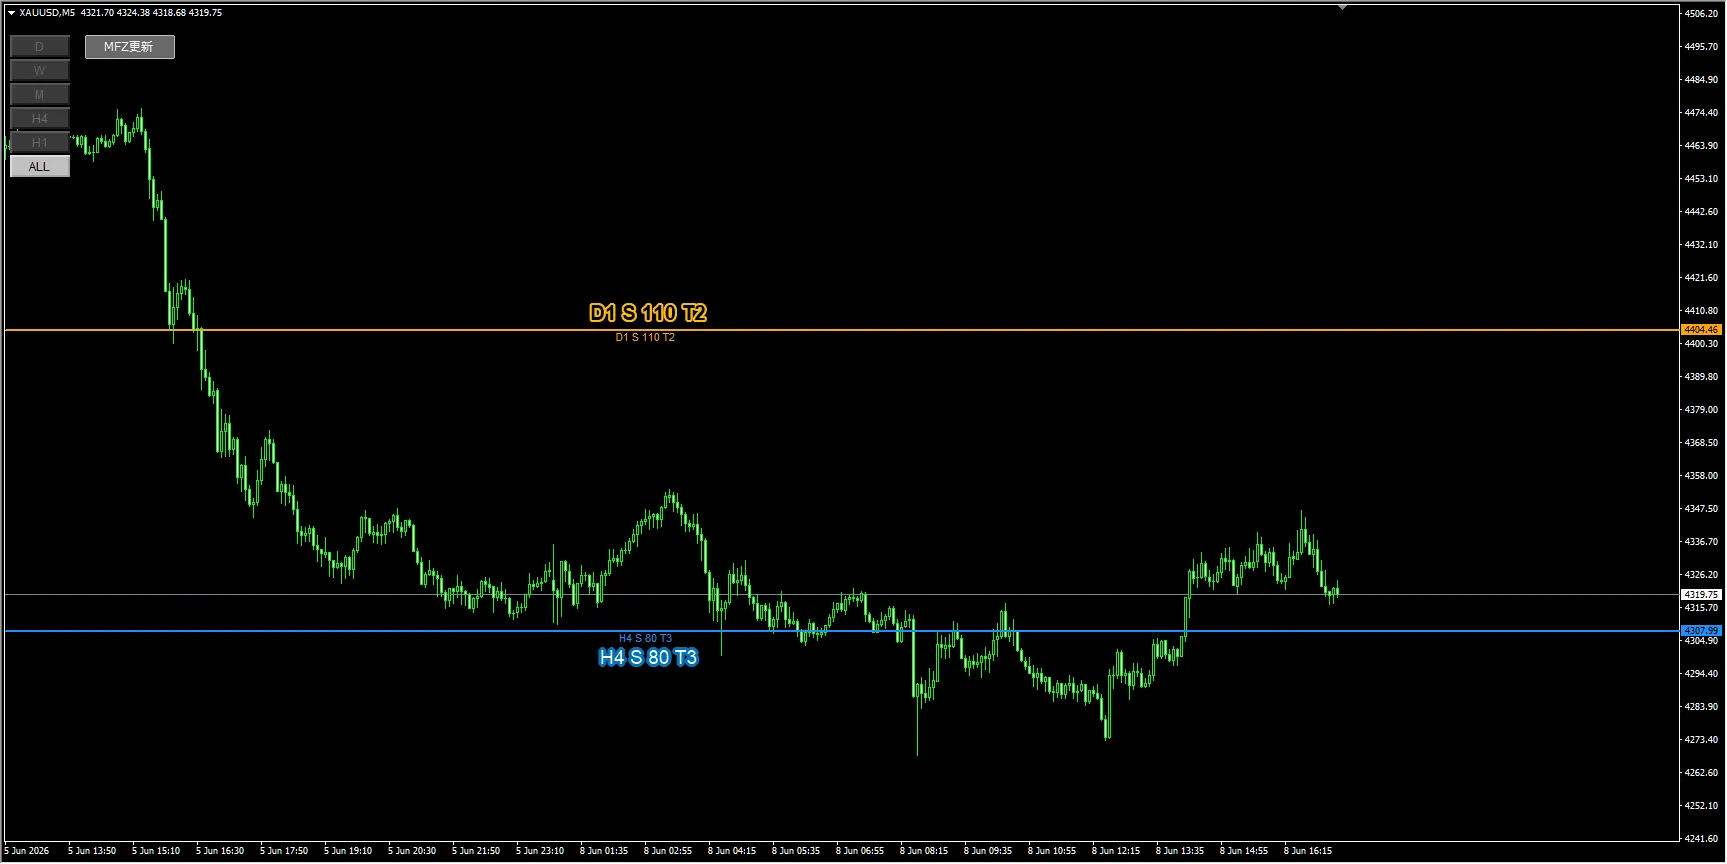
Image: Chart with MFZ Auto SR displayed on XAUUSD M5
What to look at first in this image
What stands out on the image is the blue horizontal lineH4 S 80 T3.
From the label, H4 is the 4-hour timeframe, S is a support candidate, 80 is a score estimate, and T3 is an estimate of the number of touches or reactions. In other words, this line is a candidate for a lower-price support on a 4-hour basis.as a price range that is likely to be watched as support on the 4-hour timeframe.
In the image, after price falls to near this H4 S line, it fluctuates around the line several times, briefly breaks below the line, but ultimately appears to move upward again.
The H4 S line is not a “buy here” signal. Observe whether the price holds, breaks below, or returns after breaking, and use this as a basis to consider multiple scenarios.
Main lines visible in the image
| Line | Approximate price range seen | Beginner-friendly interpretation |
|---|---|---|
| D1 S 110 T2 | Around 4404 | Displayed as a daily-timeframe support candidate, but currently well above the price, so in this image it’s viewed as a target for potential upside retracement or a price area that stands out on the upside. |
| H4 S 80 T3 | Around 4308 | 4-hour timeframe support candidate. In the image, there are multiple reactions and consolidations near this line, making it a common basis for trading plans. |
| Monthly Pivot S1 | Around 4347 | Another product’s Pivot display. In the image, after an ascent, this area seems to slow the upside, making it a resistance candidate to watch. |
| H4 Pivot / Halfline | Multiple small price ranges | In the fourth image, MFZ Auto SR’s Pivot line and half-line show subtle reactions; this is treated as supplementary confirmation material. |
Noticeable Line 1: H4 S 80 T3 is easy to read as a downside reference
In the first image, the blueH4 S 80 T3line is displayed near the current price. In the visible range, price repeatedly moves around this line, pausing slightly above the line, briefly dipping below it, and then moving back up.
What’s especially important is theposition where the label is displayed. In MFZ Auto SR, the area around the label indicates the timing when that line was created/drawn.
In other words, the candles to the right of the label are movements formed after the line was displayed. In this image, even to the right of the H4 S 80 T3 label, the price is reacting near the line, so we can conclude that the line reacted to price after it was displayed, not just drawn for convenience.This is MFZ Auto SR’s highlight.
When manually searching for horizontal lines, it’s crucial to know whether you could have found the line first. MFZ Auto SR displays higher-timeframe price zones on the chart, making it easier to review price action after a line is shown and to organize scenarios such as rebound, break, pullback, and return.
Noticeable Line 2: Monthly Pivot S1 looks like upside resistance
In the third image, another product’s Pivot indicator is overlaid. Briefly, the redMonthly Pivot S1appears to be consciously acting as a resistance candidate at the top.
In the image, after price rises near the H4 S line, it encounters resistance around Monthly Pivot S1 and is then pushed downward.
What’s important here is not to rely solely on MFZ Auto SR, but to combine it with other contextual tools and your own analysis todetermine where price might face resistance and where you want to confirm downside.
What you can see by combining with Pivot
- Check downside reactions near MFZ Auto SR’s H4 S line
- Check upside strength near Monthly Pivot S1
- Observe fine reactions near H4 Pivot or Halfline
- Don’t rely on a single line; organize scenarios across multiple price zones
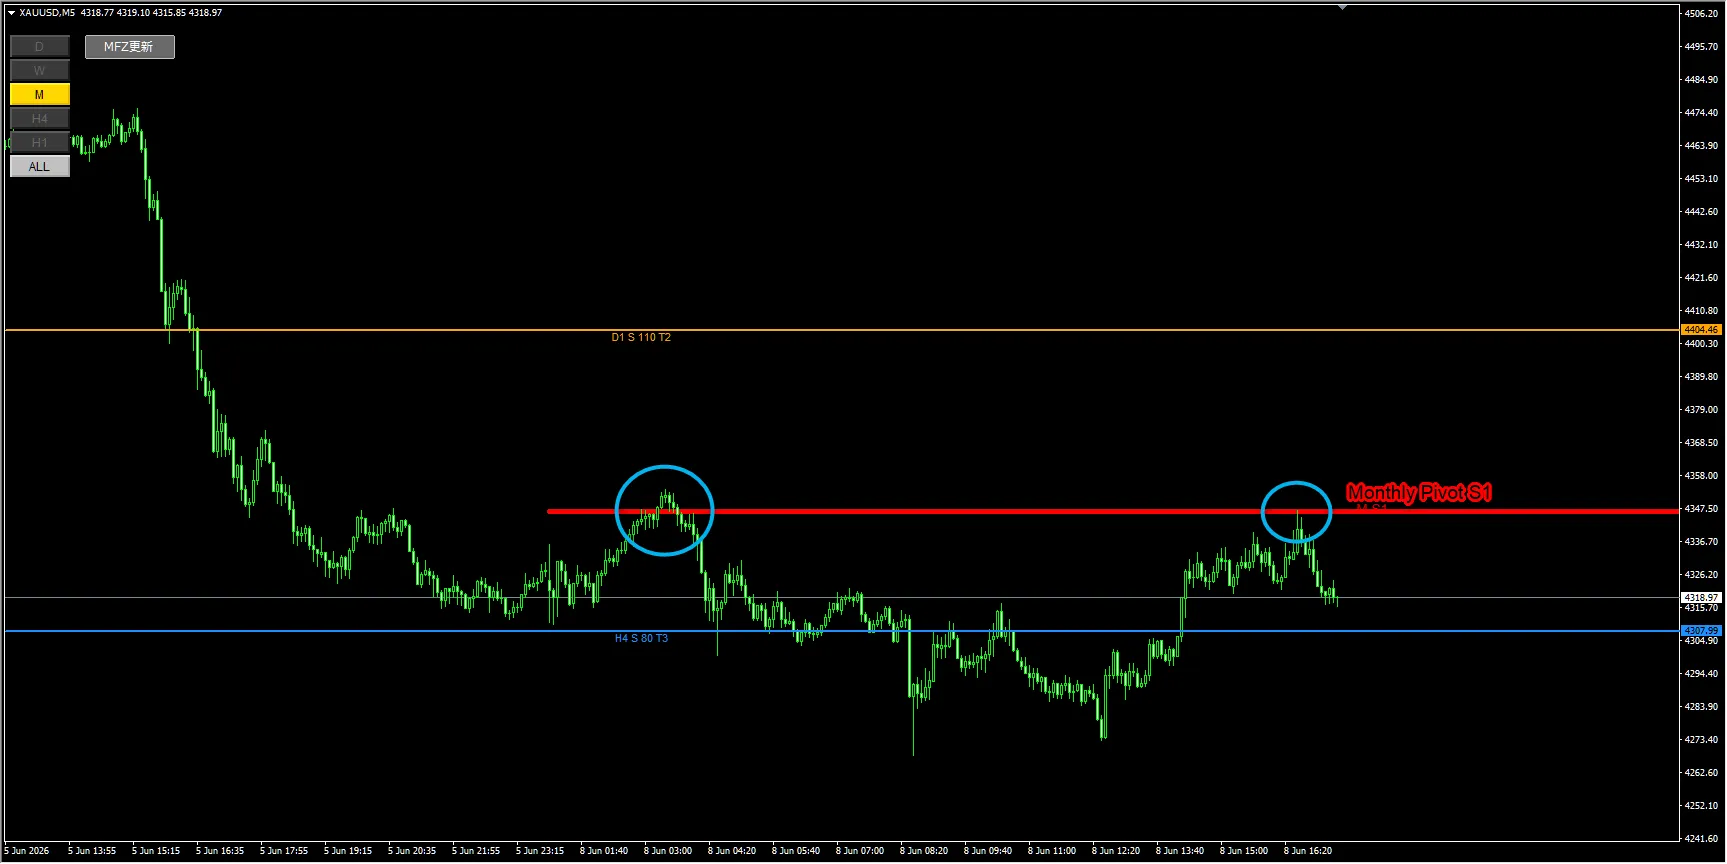
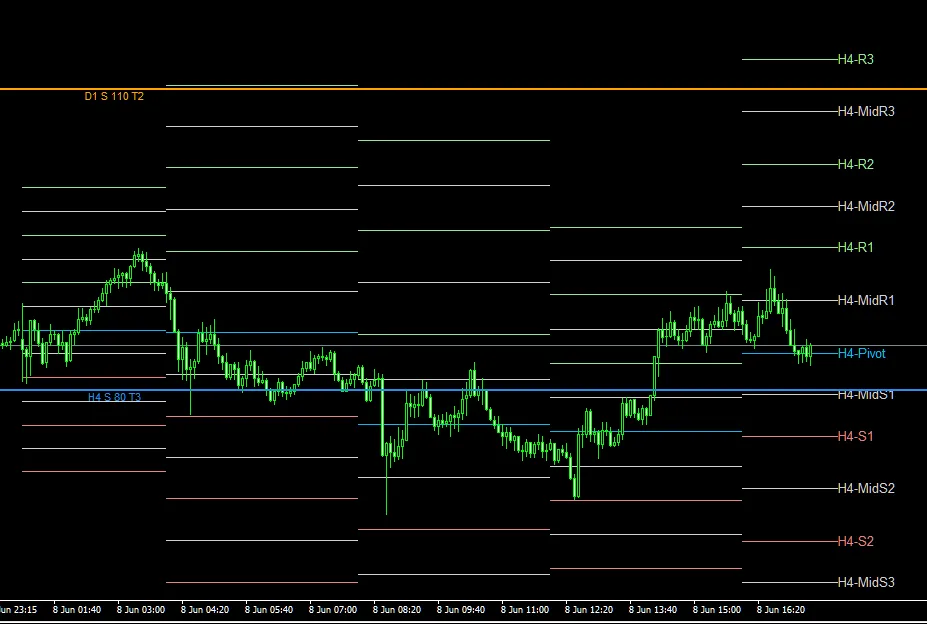
Image: XAUUSD M5 chart overlaying Monthly Pivot S1 and H4 Pivot lines
Trading plans that can be considered in this situation
From here, while watching H4 S 80 T3 and Monthly Pivot S1, we organize possible trading plans. This is not a buy/sell instruction; it’s an example of scenario creation.
| Scenario | Price ranges to watch | What to confirm |
|---|---|---|
| Look for a rebound near H4 S | Near H4 S 80 T3 | See if price stops falling, forms wicks or reversal patterns. However, do not decide merely because it touched the line; verify candlestick shapes and momentum. |
| Watch for a break below H4 S | Below H4 S 80 T3 | Determine whether there is a breakout with a full candle or if it reverses soon after. Be aware of false signals and consider confirmations from candles and pullbacks. |
| Look for downside pressure near Monthly Pivot S1 | Near Monthly Pivot S1 | Check whether price is capped after rising, or if a full breakout occurs. In the image, it appears price struggle around this area. |
| Observe fine reactions around H4 Pivot | H4 Pivot, Midline vicinity | In the fourth image, small reactions near H4 Pivot or Halfline can be used as short-term take-profit candidates or pullback confirmation material. |
What beginners should learn from this chart
When beginners look at horizontal lines, they may rush to decide “buy here or sell here.”
However, what’s important in charts like this is not to treat lines as buy/sell signals, but to organize where price tends to stall and where breaks tend to shift the trend..
- Make it easier to confirm higher-timeframe support/resistance candidates on the lower-timeframe chart
- Reduce the risk of overlooking important higher-timeframe lines by looking only at lower timeframes
- Split scenarios into rebounds, breaks, pullbacks, and retracements
- Look at price action to the right of the label and confirm price reactions to the displayed line
In particular, for instruments with large price movements like XAUUSD, it’s important to monitor not only nearby lines but also higher-timeframe price zones. Manually switching H1, H4, daily, weekly to find lines is time-consuming.
MFZ Auto SR reduces that effort and lets you focus on scenario creation by viewing higher-timeframe lines on the chart.
It is not an automated trading EA.
It does not guarantee profits.
The displayed lines are materials to help you form a trading plan.
Final trading decisions should be based on your own rules and risk management.
FX involves risk of capital loss, and depending on market conditions, the displayed lines or zones may be less effective.
Historical chart examples do not guarantee future profits.
Summary: Don’t miss this line
In this XAUUSD M5 chart, MFZ Auto SR’sH4 S 80 T3appears to react multiple times.
Also, with the Pivot indicator overlaid,Monthly Pivot S1 vicinity looks like a resistance candidateto watch. H4 Pivot and Halfline can be used as supplementary materials to observe short-term reactions.
Of course, simply having a line does not mean you should trade immediately. The key is to base decisions on whether price rebounds, breaks, makes a pullback, or retraces around the line.
If you spend time every time locating higher-timeframe lines, MFZ Auto SR can be a very helpful supplementary tool. If you want to reduce your manual work and focus on scenario creation on the chart, check the details page.
If you find it difficult to identify important higher-timeframe price zones from scratch, MFZ Auto SR helps show higher-timeframe lines on the lower-timeframe chart and organize the decision-making materials for trading plans.
It visually clarifies the gateway to multi-timeframe analysis and can serve as a foundation for considering scenarios like rebounds, breakouts, pullbacks, and retracements.
Divide scenarios.
Make judgments according to your own rules.