

What do you make of the reaction near the D1 line seen on USDJPY M5?
This chart isUSDJPY M5. In the image, the current price isaround 160.048, and a little below, aroundD1 R 135 T4 area, the price has reacted several times.
What matters here is not simply “touch the line and buy/sell.” Instead, use the line as a reference to consider scenarios of rebound, breakout, pullback, and return.
MFZ Auto SR is an MT4 helper indicator that displays price zones on lower-timeframe charts that are commonly watched on higher timeframes such as H1, H4, daily, and weekly.
For those who find it tedious to search for higher-timeframe horizontal lines themselves, or who tend to overlook higher-timeframe levels when looking only at lower timeframes, it provides a convenient reference to organize trading plans.
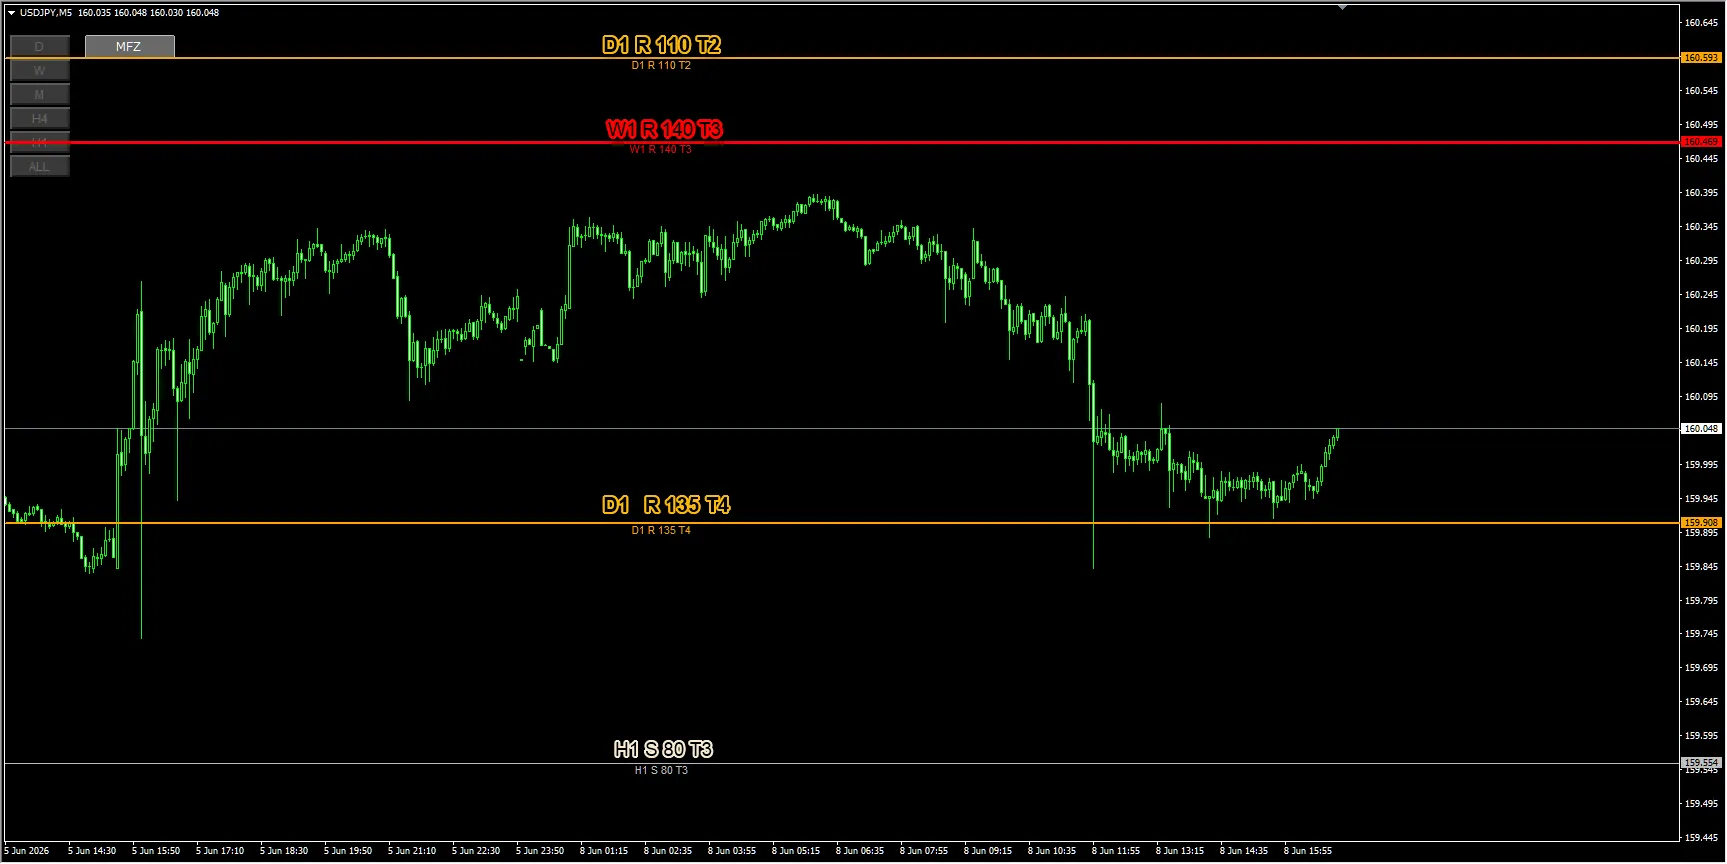
Image: Chart showing MFZ Auto SR higher-timeframe lines on USDJPY M5
Key points to look at in this image
On the image, above the price there areW1 R 140 T3andD1 R 110 T2, and below the current price there areD1 R 135 T4, and further downH1 S 80 T3is displayed.
Of particular note is the yellowD1 R 135 T4. Although labeled as resistance, the current price is above this line. In such a scenario, price ranges that were once resistance can be perceived as support when tested from the downside.
Look at the meaning of R and S in the labels while also considering the current price relationship. It’s not a simple rule of “R means only up” or “S means only down”; observe how the price reacts after it breaks these lines.
Main lines overview
| Display label | Approximate price range | How to view on the image |
|---|---|---|
| D1 R 110 T2 | around 160.593 | Daily resistance candidate. Currently above this level; if the price rises further, this is a confirmation point for upside potential. |
| W1 R 140 T3 | around 160.469 | Weekly resistance candidate. Since it is above the current price, it is a point to watch when price tries to move higher. |
| D1 R 135 T4 | around 159.908 | In the image, there is a pattern of a lower wick around the line and a return. This is the most notable price range to watch. |
| H1 S 80 T3 | around 159.554 | 1-hour support candidate. If price breaks below around D1 R 135, this becomes the next lower target to confirm. |
Note line: around D1 R 135 T4
What you want to focus on in the image isaround 159.908 D1 R 135 T4. In the enlarged image on the right, there is a red circle near this line, and it looks like the price briefly dipped below the line and then retraced with a lower wick.
Moreover, you can see the price again showing a lower wick near the same line later. This area suggests that D1 R 135 T4 may have been psychically observed by short-term timeframes at least once.
In MFZ Auto SR, the position of the label indicates roughly when that line was created/drawn. In this case, the D1 R 135 T4 appears to react near the price to the right of the label, implying the price reacted to a already-displayed line rather than a line drawn afterward for convenience.
Of course, there is no guarantee this line will continue to function the same way in the future. The key is to observe candle shapes, wicks, the way bodies break or return, and prepare multiple scenarios when the price approaches a line.
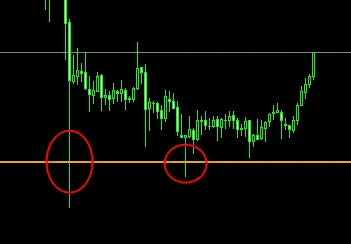
Image: magnified view of the lower wick near D1 R 135 T4
Trading plans that can be considered in this scene
The current price is around 160.048, slightly above D1 R 135 T4. In the visible range, the price seems to be rebounding from the lower line. Rather than deciding a direction in advance, it is easier to organize scenarios as follows.
| Scenario | Points to watch | Beginner-friendly thinking |
|---|---|---|
| Supported near D1 R 135 | When it tests around 159.908 again, do we see a lower wick or a reversal pattern? | This is a scenario to confirm support. Do not jump to conclusions; observe candle reactions. |
| Break below D1 R 135 | Whether a body closes below, or it is pulled back after breaking | If a break persists, consider potential room up to around the next H1 S 80 T3 vicinity. |
| Rise and test around W1 R 140 | When approaching around 160.469, does upside pressure fade? | This is a candidate for the upper resistance. Consider whether price will reverse or retest after breaking higher. |
| Break above W1 R 140 | Candle close, momentum, retest after breakout | Even after a breakout, beware of fakeouts; consider pullbacks or retests to confirm. |
What beginners can learn from this chart
Beginners tend to want to know “where to buy” or “where to sell” immediately. However, with horizontal lines, the key is not to decide the answer, but toidentify price levels where reactions are likely to occur.
When, as in this example, daily and weekly lines are displayed on the M5 chart, it becomes easier to check higher-timeframe price zones that might be overlooked when focusing only on shorter timeframes.
- Reduces the burden of finding higher-timeframe lines from scratch
- Eases checking the relationship of higher-timeframe context before relying on lower-timeframe judgments
- Makes it easier to organize rebound, breakout, pullback, and return scenarios
- Helps verify how price moves relative to already-displayed lines
In particular, as with D1 R 135 T4 where price reaction is seen to the right of the labels, it is a good practice for practicing environmental recognition using lines. It is practical to observe “how price reacts around this line” rather than “trading because of this line.”
Cautions
It is not an automated trading EA.
It does not guarantee profits.
Displayed lines are materials for forming trading plans.
Ultimately, trading decisions should be made according to the user’s own rules and risk management.
FX involves risk of loss, and depending on market conditions, displayed lines and zones may be less effective.
Past chart patterns do not guarantee future profits.
Summary
In this USDJPY M5 chart, around the areaD1 R 135 T4 vicinitythere are multiple lower-wick reactions. The current price is above that line, so in the short term this line may be watched as a downside confirmation point.
On the upside, there areW1 R 140 T3andD1 R 110 T2nearby. If prices rise further, observe whether upside pressure slows at these higher-timeframe resistance candidates, or whether price breaks through and forms a pullback.
Horizontal lines are not the answer to trading. By checking lines, watching the reactions, and preparing multiple scenarios, MFZ Auto SR serves as a useful tool to establish a basis for discretionary judgment.
If you spend a lot of time searching for higher-timeframe lines each time, MFZ Auto SR is a strong supportive tool. It makes it easier to confirm important price zones on the lower timeframe, helping you focus on organizing your trading plans.
This line is worth not missing. If you want to reduce manual decision time and focus on creating rebound, breakout, pullback, and return scenarios, check the detailed page.
Split the scenarios.
Make decisions by your own rules.