
[Hacking Mass Psychology] The Truth of Support and Resistance That Dramatically Changes Win Rate and the Law of First Touch
"This should be resistance here!"
I confidently went against the trend and, despite that, was easily broken through and incurred a huge loss.
In FX trading, haven’t you had experiences like this?
"The support line I drew myself isn’t working at all"
"Even though I have several moving averages displayed, I still wonder which one will hold and rebound"
"I entered thinking it would be a solid line, but it suddenly broke out"
Why is the line you drew not functioning?
Why do you get shaken by the market and end up exhausted?
The answer is clear.
Because the points you are looking at and the points investors around the world are watching are misaligned.
To achieve steady profits in trading, you must discern the market's walls.
This time, we will unravel the true function of "support and resistance" that many traders struggle with.
And we will tell you the "First Touch Law" that dramatically increases win rate.
We will also introduce powerful tools that visualize these concepts completely.
That is why we have prepared this solution for you.
■ The true nature of Support & Resistance is a 'collective investor psychology'
The essence of support & resistance.
It is the fact that they are a "collective psychology of investors."
Why does the market rebound at a specific price range?
Because the minds of investors around the world concentrate there.
A price range where many investors think "if it falls this far, it’s cheap" becomes the support.
A price range where people think "if it goes up this far, I'll take profits" becomes the resistance.
Once that barrier is breached, its role reverses.
The so-called “role reversal” is essential knowledge for traders.
This applies not only to horizontal lines but also to trendlines.
However, it won’t work unless it’s a line that many people around the world consciously monitor.
A line drawn only in the short term won’t move mass psychology.
That’s why it is easily broken through.
■ Why Moving Averages (MA) function as Support/Resistance
Moving averages have the same function as horizontal lines and trendlines.
Originally, a moving average is simply a line connecting the average of past prices.
It is not a tool that predicts future rebound points.
Nevertheless, it actually functions perfectly in the market.
Why is that?
The answer is simple.
"Because many investors around the world are looking at that moving average."
Everyone thinks, "I’ll buy when this moving average is touched."
As a result, buy orders concentrate there, and it truly functions as support.
The condition for us to win in trading.
It is not about fancy settings.
Knowing the "period of the moving average that many investors around the world use."
And using it is extremely important.
■ The First Touch Law to Perfect the Win Rate
Once you find a genuine, functioning support/resistance, the next thing to be aware of is the "number of touches."
A truly conscious and strong line or moving average.
When price first reaches there (the first touch).
It rebounds with a fairly high probability.
However, what happens if it is touched again and again, two times, three times?
The rebound strength (the wall of orders) at that line gets consumed and weakens.
Ultimately it breaks through and leads to a "breakout."
Conversely, also pay attention to the movement after a solid rebound at the first touch.
There are cases where the momentum to test that price again gradually weakens.
In such scenarios, oscillators tend to show "divergence."
Ultimately, it heads toward a major reversal.
"Where is the next easy-to-rebound first touch point?"
Please understand this in advance.
By waiting at advantageous points, you can select trades with higher win rates.
■ A Powerful Tool that Finds the Market's Walls for You
You should have understood the advantage of the First Touch.
However, it is extremely difficult to continuously identify the "real lines" that the world watches in real time across multiple currency pairs and timeframes on your own.
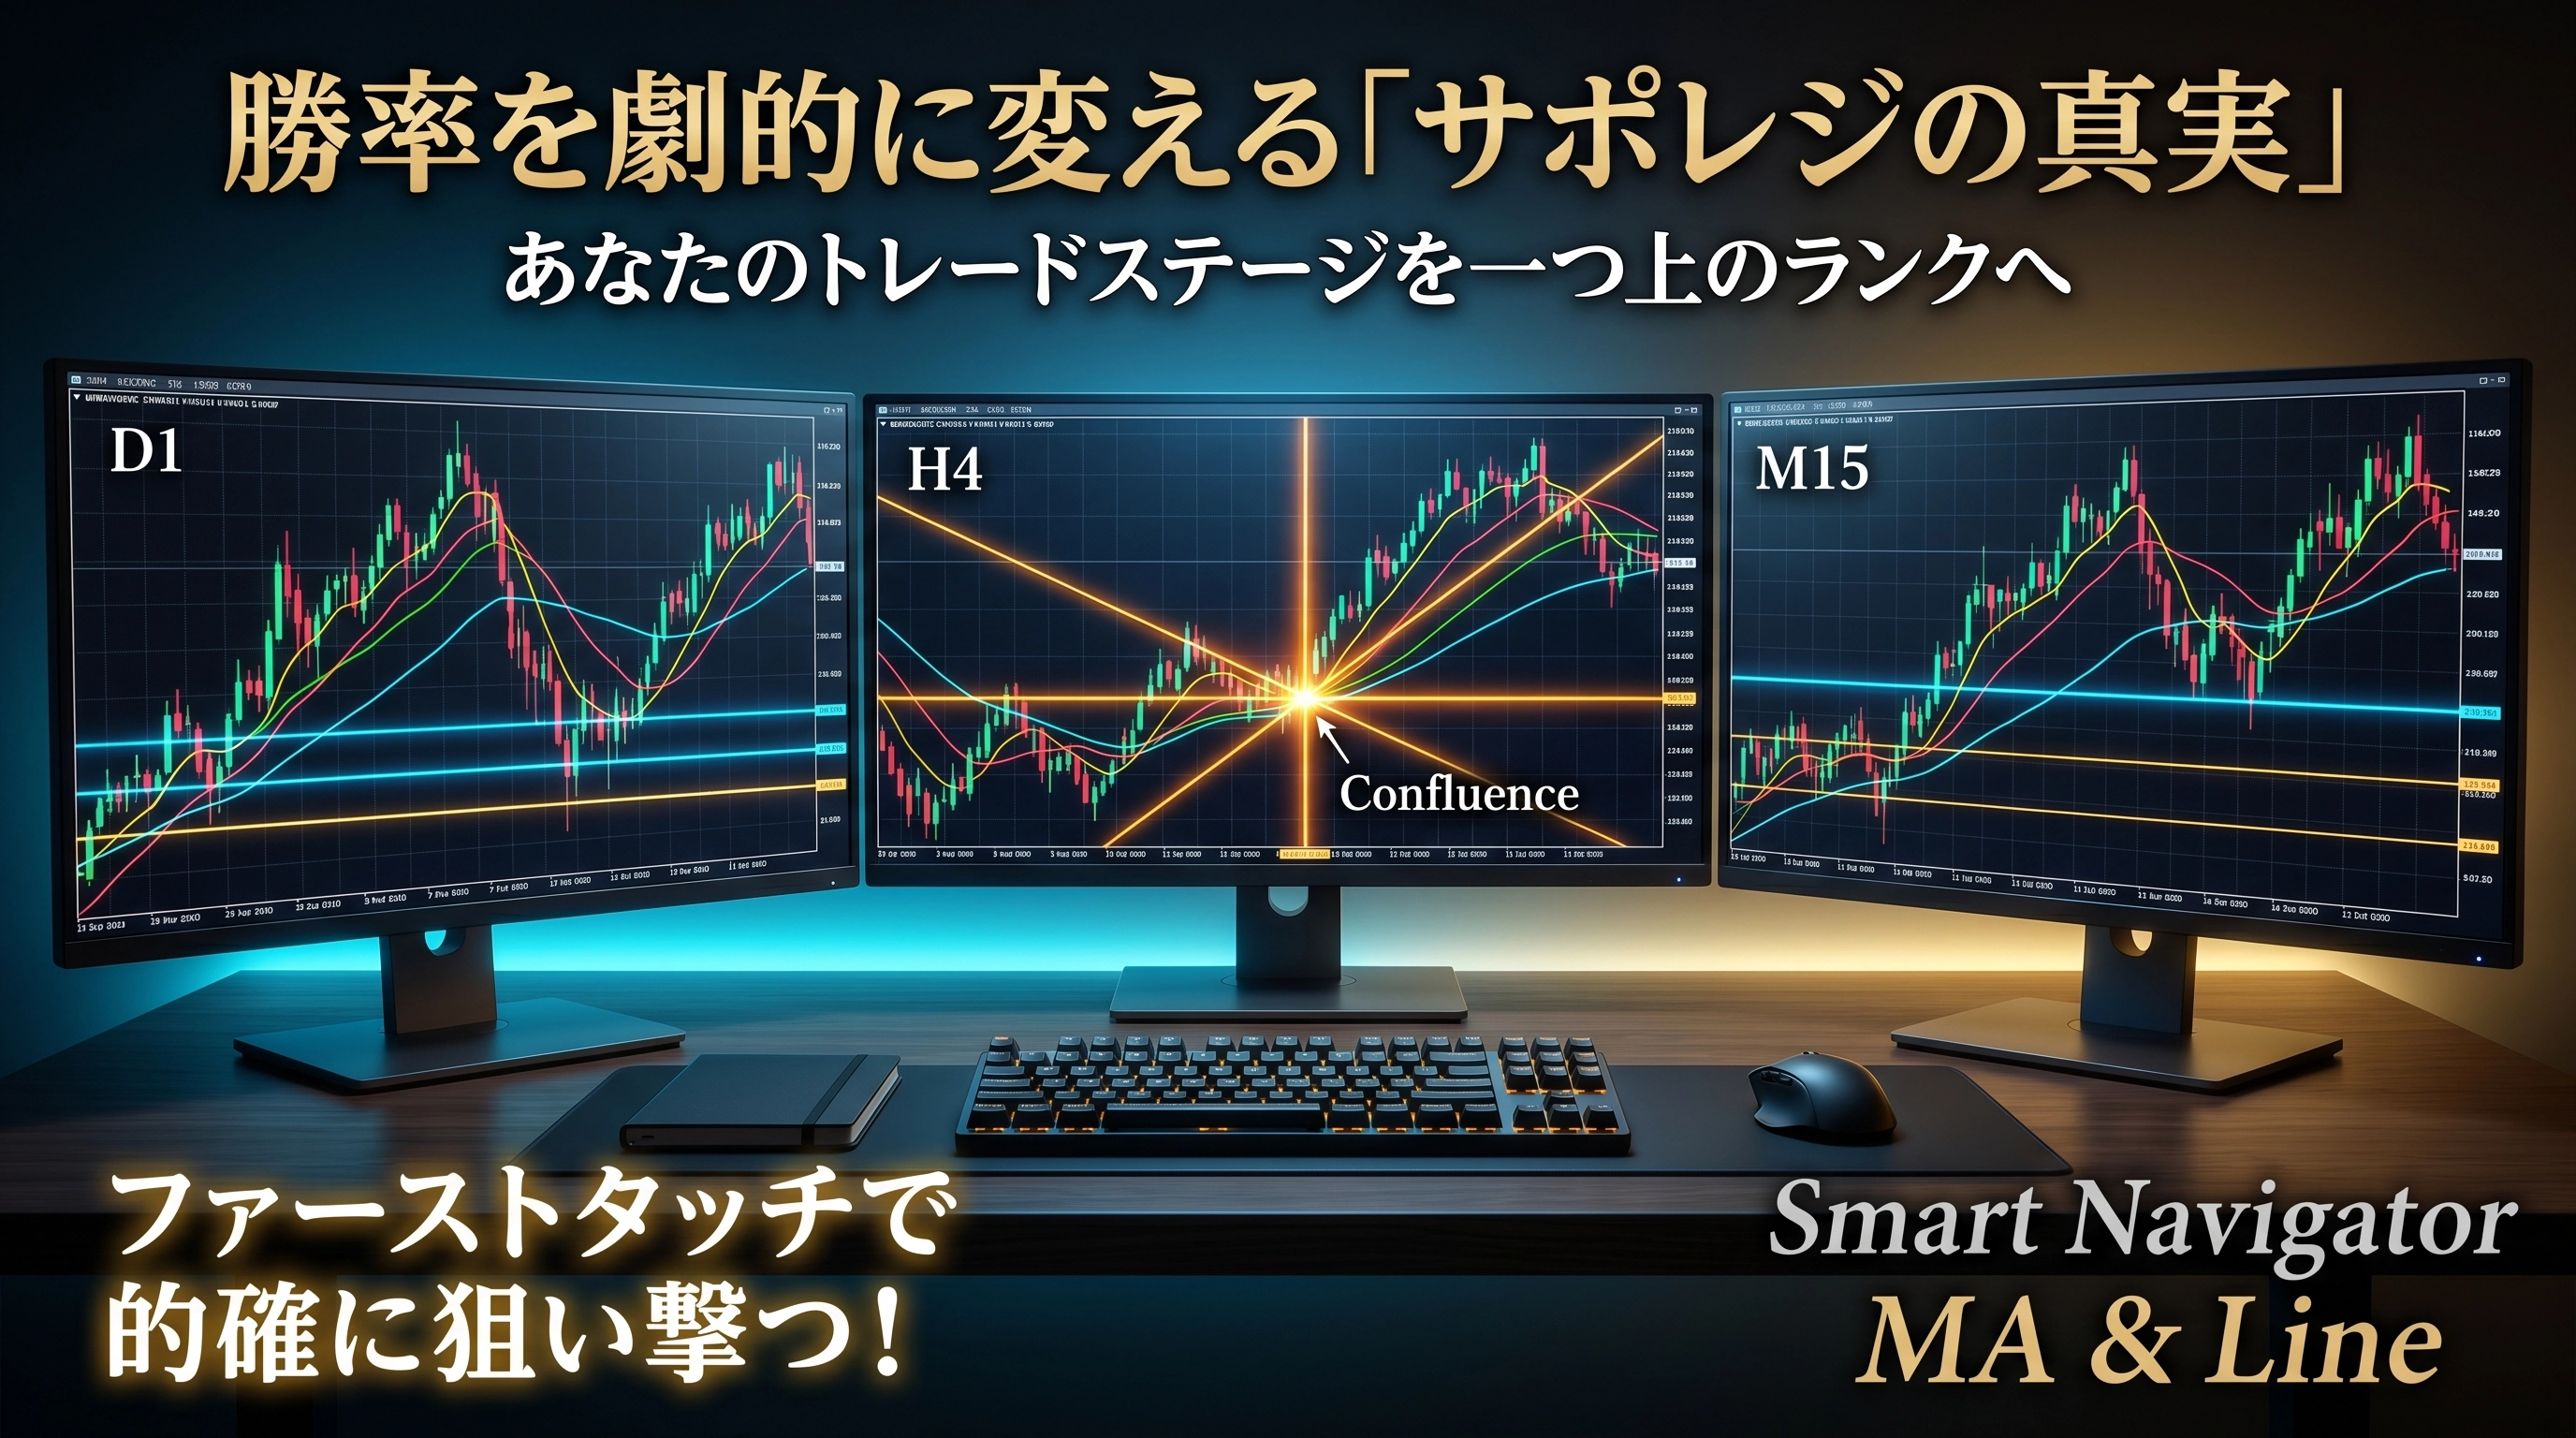
Therefore, we introduce two indicators that automatically compute and visualize the psychology of investors worldwide.
They help avoid short-term fakes and provide overwhelming confluence-based advantage.
1. World-standard coverage! "Smart Navigator MA"
Implies the standard moving average periods used by investors around the world as a built-in standard.
An indicator that supports multi-timeframe (MTF).
Automatically displays strong moving averages from higher timeframes on the current chart.
You can see at a glance the globally recognized walls where rebounds are likely.
⇒ [MT4 version]
⇒ [MT5 version]
2. Back-calculating crowd psychology from price action! "Smart Navigator Line"
This is not merely a tool that connects highs and lows.
It derives support/resistance automatically from actual price movements (price action).
As a result, it accurately captures the lines where investors around the world’s psychology concentrates.
It is extremely powerful for waiting for the first touch and for judging breakouts.
⇒ [MT4 version]
⇒ [MT5 version]
■ Entrust the tool with the "Forecast" and Trade with Confidence
The essence of support and resistance is "mass psychology."
Display lines that are likely to function well on the chart in advance.
"Is it almost time for the first touch, so let's target a rebound?"
"We have touched it several times, so be wary of a breakout"
In this way, you can construct scenarios with plenty of leeway.
"I can’t have confidence in the lines I drew"
"I want to identify reliable rebound points"
If you worry about these things, please consider these tools as options.
Be released from time constraints and cultivate the eye to see the market's essence.
We hope our tools can contribute, even a little, to further improving your trading skills.
May your trading stage rise to the next level.
We sincerely wish to be a solid support for you in daily trading to help you achieve that.