
Which pair should really be traded right now? Use RSI to assess currency strength and execute reversals with the "overlay" strategy
FX traders, daily trading, you must be really tired.
As you face the charts, almost everyone has felt (indeed, many times) a dilemma. It is, “Which currency pair should I trade today?” the difficulty of choosing a pair.,
Is it USD/JPY you should pick, or EUR/USD, or perhaps GBP/JPY…. Even though you’re searching for attractive opportunities, without solid reasons you may end up choosing a pair “for no particular reason,” and you may have regrets.
I used to be exactly one of those people.
Everyone, how did you choose the pair you are trading now for such reasons?
If you can’t clearly explain “why that pair,” or if you feel even a little uncertainty about current pair selection, this article might be one hint to make your trades more reliable.
In fact, in the world of FX, while we’re casually gazing at charts, a very important force, the “strength” of currencies, is at work….
The fatal weakness of traditional currency strength charts
To judge currency strength, many traders use “currency strength charts.” Many charts on the market express how each currency expands or contracts in a line graph starting from the left edge of the chart, for example from “the beginning of the day.” By looking at this, you can see at a glance which currency has been bought the most since the starting point and which has been sold the most.
However, this format has a few drawbacks. One is that it takes time to grasp the situation. And another, which is fatal,“you can’t tell whether now is the peak (overbought) or whether the trend still has more room”.
Is the currency at the top being “overbought,” or is it still going to be bought even more? Is the currency at the bottom “oversold,” or will it be sold further? This kind of top and bottom judgment is difficult with traditional line graphs.
The solution is the RSI! Visualizing overbought/oversold
To solve this problem, the king of oscillators, RSI (Relative Strength Index), appears. RSI quantifies overbought and oversold over a defined period on a 0–100 scale.
“What if we mapped currency strength charts into RSI?”
From that idea, we present a tool that visualizes currency strength using RSI. By using this tool, you can perfectly grasp the status of overbought/oversold for each currency, which traditional line graphs could not show.
“If one currency reaches the RSI overbought area, and another reaches the oversold area,”
that moment is the first step to determine the best timing to apply a contrarian trade, the perfect timing for a reversal.
A convergence strategy that maximizes reliability
However, RSI alone can mislead you. RSI rising above 70 does not guarantee an immediate reversal. So, we evolve this strategy further and introduce a “confluence” approach that maximizes reliability.
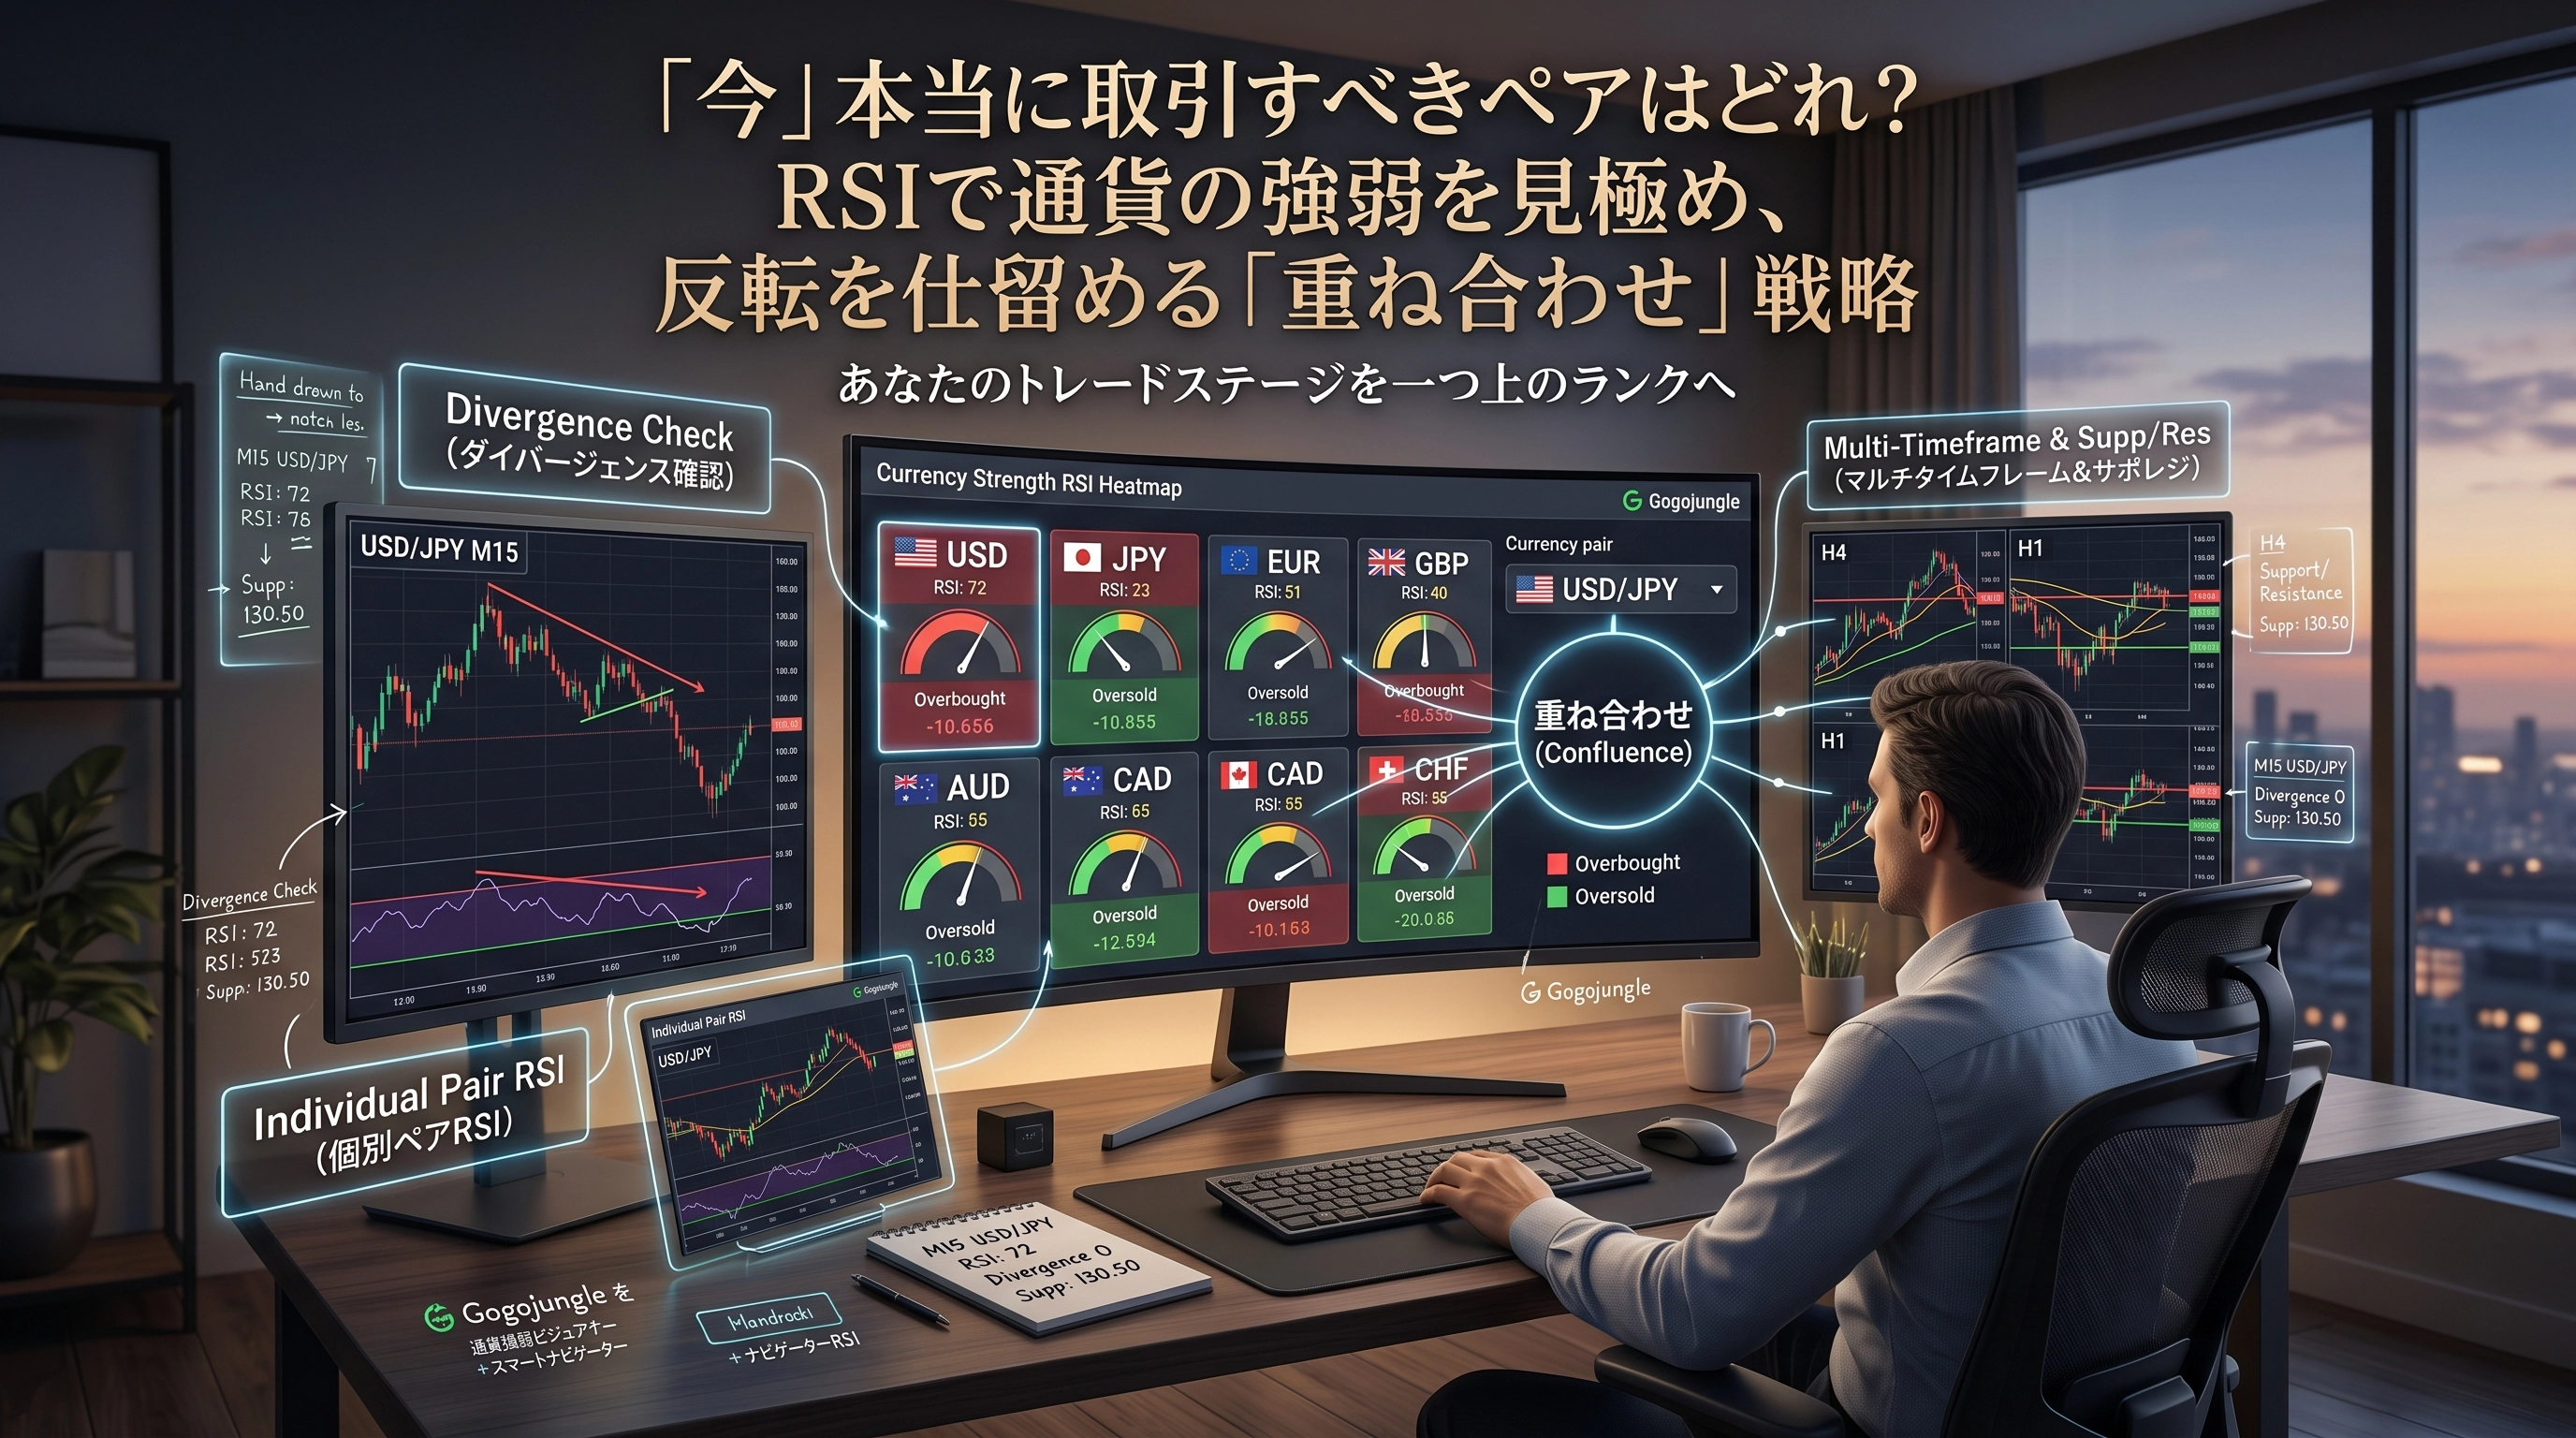
Step 1: Select the pair with currency strength RSI First, use the currency-strength RSI tool to pick the strongest currency (overbought) and the weakest currency (oversold). For example, if USD is the strongest and JPY the weakest, you would consider buying USDJPY.
Step 2: Verify timing (with another indicator) On the chart of the selected pair, verify reversal signals using another indicator.
Check for divergences: price makes higher highs, but the indicator (e.g., RSI) makes lower highs, indicating a divergence, which greatly increases reversal reliability.
Check RSI for the individual pair: for the selected pair, confirm whether its own RSI is overbought or oversold, and whether currency strength and the pair’s RSI both indicate overbought/oversold. If both signals align, it’s a strong sign.
Step 3: Check multi-timeframe and support/resistance Moreover, by considering higher timeframes (4-hour, daily, etc.) in this decision logic, reliability increases further. If the short-term reversal signal aligns with a major trend change on higher timeframes or a strong support/resistance level, it’s exactly the moment to act. Also, checking whether current price action is hitting important levels like horizontal lines or moving averages is very useful. When these levels and RSI signals coincide, the reliability as a reversal point is very high.
What do you think? Rather than trading aimlessly, objectively identify the strongest and weakest currencies now with RSI, and by layering multiple indicators, higher timeframes, and support/resistance, avoid misreads and practice high-confidence reversal trades. This is the essence of “high-win-rate trading” that many pro traders actually practice.
If you’ve envisioned this strategy and want to try it, you are already taking a first step toward a higher level of trading.
To help you implement this strategy, we introduce a set of tools that can be highly useful.
■ Determine the strongest and weakest currencies at a glance. Visualize overbought/oversold as well. Currency Strength Visualizer
Introduction video:
- MT4 version:
https://www.gogojungle.co.jp/tools/indicators/80551 - T5 version:
https://www.gogojungle.co.jp/tools/indicators/80552
■ Avoid RSI false signals. Automatically detect strong reversal signals. Smart Navigator - Divergence
Introduction video:
MT4 version:
https://www.gogojungle.co.jp/tools/indicators/80549 MT5 version:
https://www.gogojungle.co.jp/tools/indicators/80550
■ Fully grasp individual pair momentum. Includes voice guidance. Smart Navigator - RSI
Introduction video:
MT4 version:
https://www.gogojungle.co.jp/tools/indicators/80540 MT5 version:
https://www.gogojungle.co.jp/tools/indicators/80541
We hope the “confluence” strategy and toolset introduced here will make your daily trading environment more comfortable, and lift your trading to a higher level.
We sincerely wish that your trading style evolves to become even more solid.