

Price reaction to the displayed higher-timeframe line on XAUUSD M5
This time, using the lines displayed on the XAUUSD 5-minute chart labeled “Upper-timeframe Zone Horizontal MFZ Auto SR,” we’ll整理 to make it easy for beginners to understand which price ranges to look at and how to interpret them.
What to pay attention to in particular is the label position. Near where the label is displayed, it gives a rough idea of when the line was created or drawn. In other words, the candlesticks to the right of the label show how the price moved after the line was already displayed.
MFZ Auto SR is an MT4 utility indicator that displays price ranges on the lower-timeframe chart that are likely to be relevant in higher timeframes such as H1, H4, daily, or weekly.
For those who find it difficult to locate higher-timeframe horizontal lines each time, or who tend to miss important higher-timeframe price zones by looking only at the lower timeframe, this tool provides a convenient foundation for planning trades.
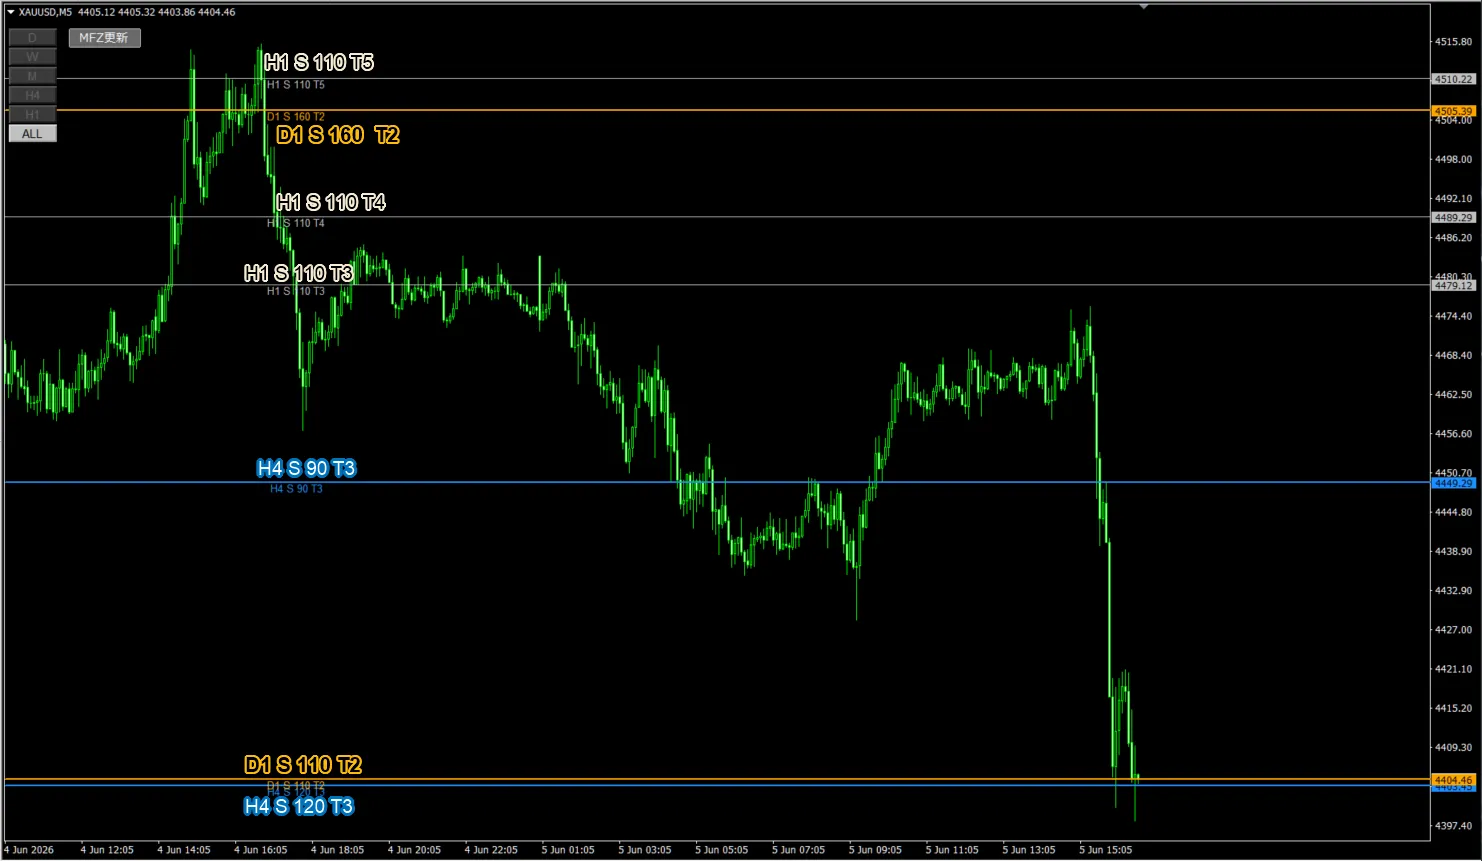
Image: Chart of XAUUSD M5 with MFZ Auto SR upper-timeframe lines displayed
What to look for first in this image
In the image, on the XAUUSD 5-minute chart, several support candidate lines from H1, H4, and D1 are displayed. At the top are the H1 and D1 S-lines, in the middle there is H4 S 90 T3, and at the bottom there are D1 S 110 T2 and H4 S 120 T3 overlapped closely.
From what’s visible, price moved down from the upper price zone, tested near the H1 and H4 lines along the way, and ultimately reached a price zone where the lower D1 and H4 support candidates overlapped, showing a substantial decline.
The areas where price ranges around to the right of the label, or is capped at the top, and reacts near the lower line after a sharp move. This is not a “line drawn after the fact for convenience” but a situation where you can observe how subsequent price action responds to the already-displayed line.
Main lines visible in the image
| Line | Approximate price range | Beginner-friendly way to view |
|---|---|---|
| H1 S 110 T5 | Around 4510 | Upper H1 support candidate. Since it is above, it tends to be a target for retracements or a reference for checking higher prices relative to the current price. |
| D1 S 160 T2 | Around 4505 | Displayed as a daily support candidate. T2 indicates the number of touches as a reference. |
| H1 S 110 T4 | Around 4489 | In the image, price appears to consolidate below this level and then move downward. |
| H1 S 110 T3 | Around 4479 | A convenient candidate line for confirming the lower and upper bounds of a temporary consolidation. |
| H4 S 90 T3 | Around 4449 | Blue line in the center of the image. The price has approached it several times, making it easy to view as a support candidate and a place to confirm a rebound. |
| D1 S 110 T2 | Around 4404 | Lower daily support candidate reached after the sharp move. |
| H4 S 120 T3 | Around 4403 | Close to the D1 line, making it a visible lower support candidate zone. |
Attention Line 1: Consolidation near H1 S 110 T3 and T4
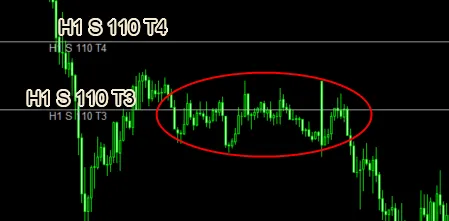
Image: Highlight of consolidation around H1 S 110 T3 and H1 S 110 T4
In the enlarged image, price appears to be range-bound around or near the H1 S 110 T3 and H1 S 110 T4 lines.
The label is on the left, and price action moves up and down to the right of it for a period, so on the image you can think that the price may have reacted around the H1 line that was already displayed.
What matters here is not assuming it will always hold because it is an S-line. In the visible range, the price moved downward afterward, so the price zone seen as a potential support may have shifted to a place where resistance at the top is weighed more.
An S-line is a potential support at lower prices, but if price cannot return above it after dipping below, it can become a guide for considering selling on a rebound. Do not judge solely by the line name; also consider the current price position relative to the line and the candlestick reactions.
Attention Line 2: Multiple reactions near H4 S 90 T3
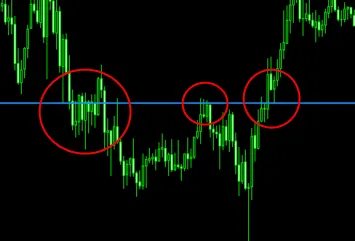
Image: Highlight near H4 S 90 T3 where price approaches several times
The central blue line H4 S 90 T3 appears to be approached multiple times in the image. On the left, it looks like price is attempting to stop the decline near the line, and later there are scenes where the line is tested for both upside and downside moves near it.
T3 can be viewed as a guideline for the number of touches or reactions. Of course, having a T value does not guarantee that price will stop there. But for beginners, it helps narrow down which price range to monitor.
With this line, you can prepare several scenarios: a rebound if supported, a break if breached, or a pullback scenario if it breaks and then holds a retest.
Attention Line 3: Confluence of D1 S 110 T2 and H4 S 120 T3
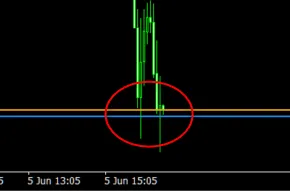
Image: Highlight near D1 S 110 T2 and H4 S 120 T3 reaching near after a sharp drop
The most noticeable is the price reaching zones where D1 S 110 T2 and H4 S 120 T3 are in close proximity after a steep fall.
In the image, the downward momentum is strong, and the price seems to react near these support zones with a lower wick. Since the daily and 4-hour lines are close, this is a scene where higher-timeframe price zones become easier to confirm when only looking at lower timeframes.
However, this is not a place to simply buy because it rebounded. After a sharp drop, price action can become volatile, lines may be temporarily breached, or tested again. What to watch is the shape of the downside stop, the strength of the rebound, and whether price recedes back through the line again.
When D1 and H4 support candidates are nearby, it’s a very clear point for scenario building. MFZ Auto SR makes it easier to observe such higher-timeframe lines on the lower-timeframe chart.
Trading plans that can be considered from this chart
From here, we’ll organize possible scenarios based on this image. This is not trading advice; it’s a way to pre-split plans using lines.
| Situation | Line to observe | Possible scenarios |
|---|---|---|
| Consolidation near the H1 line | H1 S 110 T3 and T4 | Watch whether it is supported near the line or if upside is capped. If price cannot return after breaking below, it can become a basis for considering selling on a pullback. |
| Approaching the H4 line | H4 S 90 T3 | If supported, a rebound scenario; if breached, a breakout scenario; if it retraces after the breach, a retest scenario can be considered. |
| Downside reach after a sharp drop | D1 S 110 T2 and H4 S 120 T3 | A moment to observe a potential stop and reaction. Consider avoiding forced entries while watching for a rebound or another break. |
Line label position helps clarify line value
In this image, there isn’t a morning indicator image. However, the MFZ Auto SR label positions visually show where the line was created or drawn, making it easier to interpret.
If price ranges around to the right of the label or reacts near the line, it is less about a line drawn retroactively from past charts and more about the price movement reacting to an already-displayed line.
This is a big benefit for beginners who struggle with horizontal lines. It reduces the time spent deciding which price bands to monitor and makes it easier to focus on scenarios like rebounds, breaks, pullbacks, and retracements.
MFZ Auto SR is a very helpful auxiliary tool. It makes it easier to confirm higher-timeframe price zones on the lower-timeframe chart, reducing the time spent searching for lines and helping you form trading plans.
Of course, just because a line is displayed does not complete your trading decision. But having a clear idea of “where to look” changes the chart analysis burden significantly.
What beginners should focus on in this scenario
Set the viewing order to reduce confusion
- First, check the higher-timeframe lines close to the current price
- Next, see whether those lines are S or R via the label
- Then observe whether the candlesticks are being supported or breached
- Don’t decide buy/sell direction immediately; separate the scenarios into rebound, breakout, pullback, and retracement
In sudden drop scenarios like this, reaching a lower support candidate does not automatically mean you should target a rebound. You may consider a view that it has stopped the decline, or alternatively, that price could move lower again after a brief pullback.
MFZ Auto SR lines can be used to organize these multiple scenarios.
It is not an automated trading EA.
It does not guarantee profits.
The displayed lines are for forming trading plans.
Finally, make your trading decisions according to your own rules and risk management.
FX carries a risk of capital loss, and market conditions can make the displayed lines or zones difficult to function.
Past chart examples do not guarantee future profits.
Summary
In this XAUUSD M5 chart, consolidation near the upper H1 line, several near-misses around the central H4 S 90 T3 area, and a price zone where the lower D1 and H4 support candidates overlap after a sharp drop were observed.
In particular, by looking at price action to the right of the label, it becomes easier to see how subsequent price movements relate to the displayed line.
Horizontal lines are not answers to trading. However, once you decide where to base your chart viewing, it becomes easier to construct scenarios such as rebounds, breakouts, pullbacks, and retracements.
If you find it difficult to locate important price zones on higher timeframes from scratch, using MFZ Auto SR to display higher-timeframe lines on the lower-timeframe chart can help organize the decision-making process for trading plans.
Reduce time spent deliberating manually and focus on scenario construction by checking the details page. It is especially valuable for those who tend to judge using only the lower timeframe to visualize higher-timeframe lines on the chart.
Divide scenarios.
Make judgments based on your own rules.