

GBPAUD 5-minute chart combines MFZ line and H4 Pivot for environmental awareness
This time is the GBPAUD 5-minute chart.
In this chart, prices repeatedly hit the higher-timeframe lines automatically drawn by MFZ Auto SR not so cleanly, but rather move by creating up and down waves between lines.
Therefore, this time I will explain for beginners how to organize the waves by using MFZ Auto SR’s higher-timeframe lines as a main environmental reference, and by viewing H4 Pivot displayed with PivotMatrixPro together.
MFZ Auto SR is an MT4 environmental awareness assistant indicator that displays price ranges on lower-timeframe charts that are easily noticed on higher timeframes such as H1, H4, daily, or weekly.
It does not generate buy/sell signals, nor is it an automated trading EA. The displayed lines are materials for making trading plans.
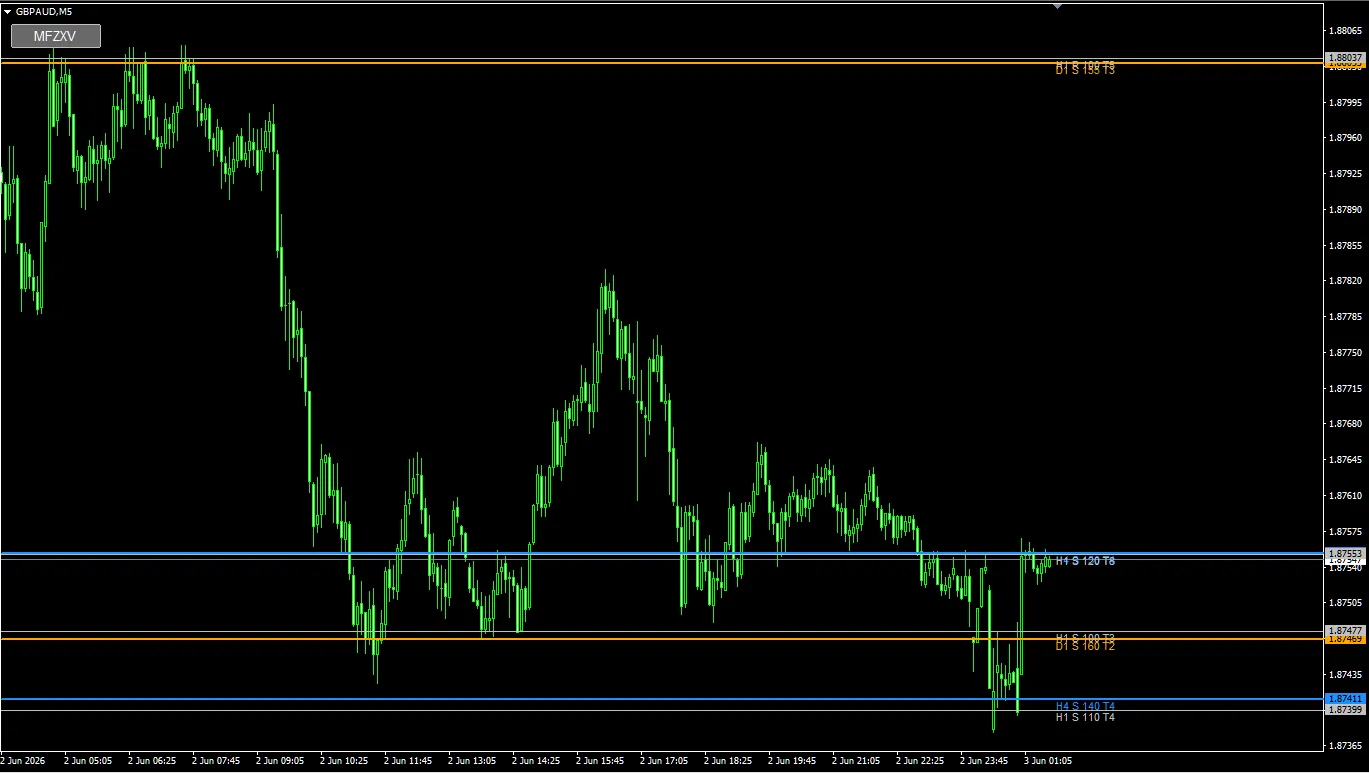
Image: GBPAUD 5-minute chart, MFZ Auto SR line display chart
Image: subsequent GBPAUD 5-minute chart
In this GBPAUD chart, the MFZ Auto SR label positions look slightly different between the morning image and the later image.
This is due to introducing PivotMatrixPro midway, which changed the chart display environment. Even so, at this point there is no major difference in the main lines displayed by MFZ Auto SR, so I will continue the explanation with the same group of lines.
When looking at the image, it is important not to judge only by label position, but also to verify the displayed price range, line names, and how subsequent price action responds.
Key points visible in this image
The currency pair is GBPAUD, and the timeframe is 5 minutes.
On the image, after a large drop, price seems to move down to around the H4 S 140 T4 or H1 S 120 T5 area on the lower side, then rebound and move upward.
On the other hand, it gives the impression that prices are not strictly reacting to MFZ Auto SR’s main lines, but are moving with waves between lines.
- Upper side shows D1 S 155 T3
- Mid shows H4 S 120 T8
- Lower side shows D1 S 160 T2, H4 S 140 T4, H1 S 120 T5
- Price falls toward the lower line once, then rebounds
- In the subsequent rise, PivotMatrixPro’s H4 Pivot family lines appear to be in play
Even if the price does not reach MFZ lines exactly every time, it does not mean the chart is unusable. There is an approach to confirm the environment with major higher-timeframe lines and supplement the finer waves with pivots or other criteria.
Main MFZ lines visible in the image
| Line display | Approximate price range | Beginner-friendly interpretation |
|---|---|---|
| D1 S 155 T3 | Around 1.8803 | Daily support candidate. In the image it is fairly high; used as a guide when price moves back upward. |
| H4 S 120 T8 | Around 1.8755 | 4-hour support candidate. Labeled T8, it serves as a line with many touches or reactions. |
| D1 S 160 T2 | Around 1.8745 | Daily support candidate. Close to lower H4/H1 lines, part of the lower price zone. |
| H4 S 140 T4 | Around 1.8741 | 4-hour support candidate. Looks like price was pushed down near this level during the decline. |
| H1 S 120 T5 | Around 1.8739 | 1-hour support candidate. Close to H4 S 140 T4, viewed as part of the lower support zone. |
Focus on price action to the right of the labels
When using MFZ Auto SR, check not only the line positions but also the label positions.
Where labels are displayed marks the timing when that line was created/drawn. In other words, candles to the right of the label represent price movement that occurred after the line was displayed.
In this GBPAUD, to the right of the H4 S 120 T8, H4 S 140 T4, and H1 S 120 T5 labels, you can see price forming up and down waves.
However, unlike XAUUSD or USDJPY where lines repeatedly react directly at the MFZ lines, many scenes show waves forming between lines. In such cases, it is easier to organize by treating MFZ lines as the large environmental awareness and Pivot as a finer wave guide.
With MFZ Auto SR, you can verify how price moves after a line is displayed by looking at price action to the right of the label. Even in cases with little direct reaction, it provides material on which price ranges the market is moving within.
Point of interest 1: Near H4 S 120 T8
H4 S 120 T8 is displayed as a 4-hour support candidate. The price range is around 1.8755.
In the first image, price seems to hover around this H4 S 120 T8 several times. Rather than strongly rebounding in one direction, it appears to be moving sideways around this line to determine the direction.
In the second image, price returns above H4 S 120 T8 and then extends higher. In this case, H4 S 120 T8 can be viewed as a lower bound.
How to view H4 S 120 T8
- View as a 4-hour support candidate
- If price chatters near the line, wait for a breakout rather than deciding direction immediately
- After returning upward, confirm if it can act as a pullback target
- Treat T8 as a guideline for the number of reactions
Point of interest 2: Lower zone of H4 S 140 T4 and H1 S 120 T5
The lower side shows H4 S 140 T4 and H1 S 120 T5 in close proximity. The price range is around 1.8741–1.8739.
In the bottom-right of the first image, price seems to be pushed into this lower zone and then rebound. It is easier to view this not as a single line, but as a lower price zone where H4 and H1 support candidates coincide.
In the second image, after rising from this lower zone, price seems to form an upward wave for a while.
When H4 and H1 lines are in a similar price area, it is useful to view them as a support zone with a bit of width, rather than a precise line.
In scenes where MFZ lines are hard to reach, use Pivot as an auxiliary
In this GBPAUD, the chart shows waves moving between lines rather than repeatedly hitting MFZ lines directly.
In such cases, it is easier to organize by combining another criterion rather than trying to explain every minor reaction with MFZ alone.
In the third image, PivotMatrixPro displays H4 Pivot. On the image, around lines such as H4 Pivot, H4-MidR1, H4-R1, H4-MidR2, H4-R2, there appear to be price reversals or temporary halts.
This time, the Pivot indicator used to observe the finer waves of GBPAUD is PivotMatrixPro. Displaying H4 Pivot, R1, R2, S1, S2, and intermediate lines helps organize the subtle price movements between MFZ Auto SR’s higher-timeframe lines.
Details of PivotMatrixPro
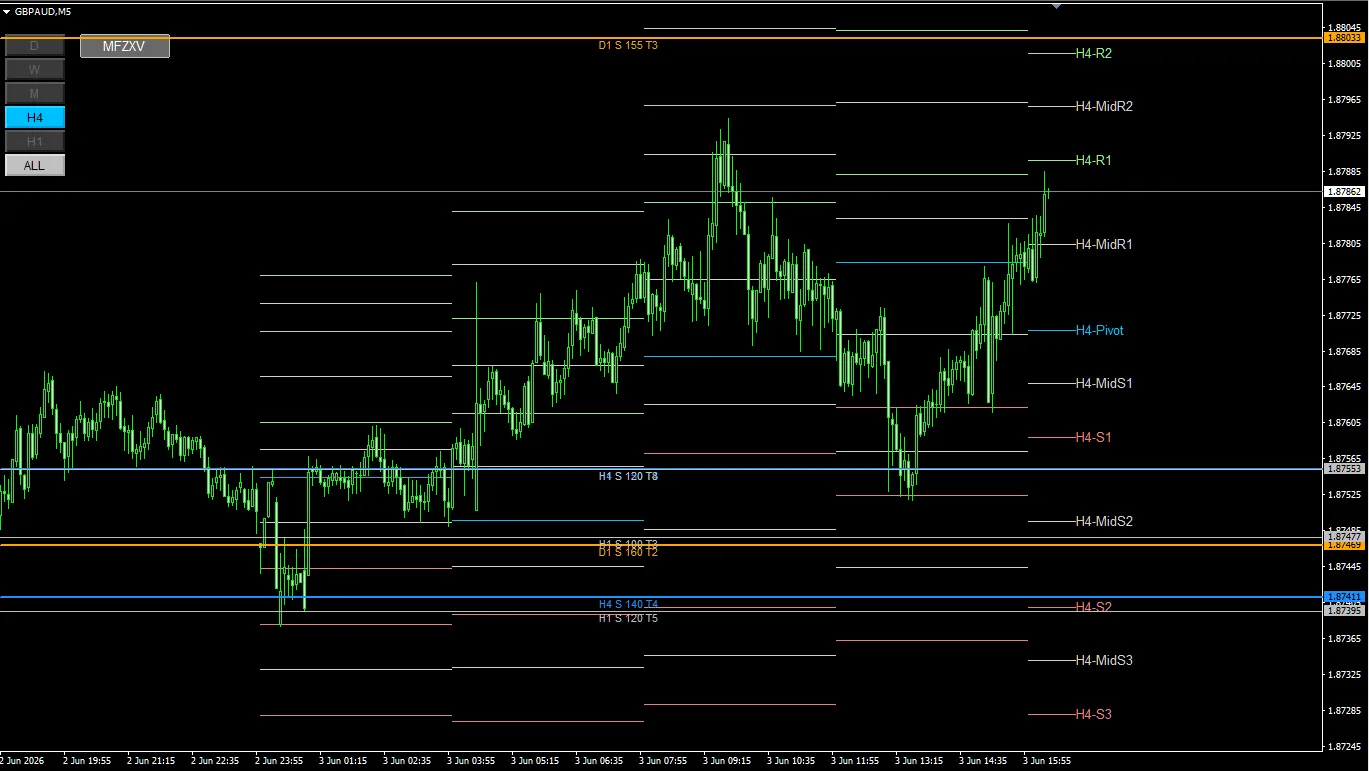
Image: GBPAUD 5-minute chart with H4 Pivot shown by PivotMatrixPro
Reaction of H4 Pivot as seen in PivotMatrixPro
In the third image, multiple H4 Pivot lines are displayed.
Specifically, lines such as H4-Pivot, H4-MidR1, H4-R1, H4-MidR2, H4-R2 seem to be watched during upward moves or retracements.
In the image, price moves upward from around H4-Pivot, encounters a congestion near H4-R1, then seems to head toward H4-MidR2 or H4-R2.
Also, in downward moments, near H4-MidS1 or H4-MidS2 appears to be potential points for a rebound or reversal.
What to verify with H4 Pivot
- Whether price is trading above or below H4-Pivot
- Whether price action weighs on H4-R1 or H4-R2
- Whether moderate lines like H4-MidR1, H4-MidR2 react temporarily
- Whether reversal around H4-MidS1, H4-MidS2 occurs
- Areas where MFZ lines and Pivot lines are close deserve more attention
Distinguishing MFZ Auto SR and PivotMatrixPro usage
In charts like this, it’s clearer to separate their roles instead of treating MFZ Auto SR and PivotMatrixPro as the same tool.
| Tool | Main way of reading | How it was used in this GBPAUD |
|---|---|---|
| MFZ Auto SR | Identify commonly observed support and resistance on higher timeframes | Use as guidance for major upper/lower bounds and lower support zones |
| PivotMatrixPro | Use as a guide to confirm key pivot points between MFZ lines where price moves up and down |
Confirm the big price ranges with MFZ Auto SR and observe the finer turning points with PivotMatrixPro. Dividing roles this way helps organize chart waves.
Trading plans that can be inferred from this chart
From here on, I’ll organize scenarios based on lines rather than giving trading instructions.
| Scenario | Lines to watch | What to confirm |
|---|---|---|
| Look for a rebound from the lower support zone | H4 S 140 T4, H1 S 120 T5 | Check for lower wicks, higher lows, and a renewed upward move |
| See whether price can stay above H4 S 120 T8 | H4 S 120 T8 | Whether price can stay above the line or be supported by a pullback |
| Confirm incremental Pivot rises | H4-Pivot, H4-MidR1, H4-R1, H4-MidR2, H4-R2 | Whether price can extend to the next Pivot line or stalls near each line |
| Look for a rebound if upside weakens | H4-R1, H4-MidR2, H4-R2 | How far back to the next Pivot line after a slowdown |
Beginner-friendly points
As with GBPAUD in this example, when MFZ Auto SR lines aren’t touched often, it doesn’t mean the chart is unusable. Confirm the big environment with higher-timeframe lines and use Pivot for supporting finer movements as needed.
MFZ lines are a reference for major higher-timeframe zones. For finer up-down movement cues, you can overlay H4 Pivot as shown here.
- Treat MFZ lines as a major environment reference
- If lines are not reached, observe the range within which price oscillates
- H4 Pivot serves as a supplementary tool for subtle turning points
- When MFZ lines and Pivot lines are close, examine price reaction more carefully
- Look at price action to the right of the label to confirm post-display movement
MFZ Auto SR is not only a tool to check when price exactly hits lines. By confirming the major lines on higher timeframes and supplementing with Pivot as needed, you can organize your trading plan scenarios more effectively.
Disclaimer
It is not an automated trading EA.
It does not guarantee profits.
The displayed lines are materials for forming trading plans.
PivotMatrixPro’s pivot lines are also aids to assist trading decisions.
Final trading decisions should be made according to your own rules and risk management.
There is a risk of capital loss in FX trading.
Market conditions may cause displayed lines or zones to be less effective.
Past chart examples do not guarantee future profits.
Summary
In this GBPAUD 5-minute chart, price did not frequently hit MFZ Auto SR lines directly; instead, it formed up and down waves between higher-timeframe lines.
In such scenes, it is useful to confirm major support/resistance with MFZ Auto SR and verify finer pivot points with PivotMatrixPro.
On the image, H4-Pivot, H4-R1, H4-R2, and near the halves of R1 and R2 appear to be watched during rises or declines.
- Check major higher-timeframe price ranges with MFZ Auto SR
- When MFZ lines are hard to reach, observe the wave ranges
- Confirm fine turning points with PivotMatrixPro’s H4 Pivot
- If label positions differ, correlate the actual line with price reaction
- Use lines not as buy/sell signals but as materials to separate scenarios
If it is difficult to identify major higher-timeframe lines from scratch, using MFZ Auto SR helps display higher-timeframe lines on lower-timeframe charts and organize the materials for forming trading plans.
By combining with other analysis axes like Pivot as shown, you can separate major environmental awareness from細い waves for easier interpretation.
Look at turning points with Pivot.
Divide scenarios according to your own rules.