

USDJPY 5-minute chart: Reaction to daily and 4-hour lines and trading scenarios
This time, using the USDJPY 5-minute chart, we explain how to read the lines displayed by the higher-timeframe MFZ Auto SR zones.
The first image is the morning chart where the line is displayed, and the second image shows the subsequent price action. On the image, it appears that the daily and 4-hour lines are the focus, with the price reacting several times around them.
MFZ Auto SR is an MT4 utility indicator that displays price ranges on lower-timeframe charts that are commonly watched on higher timeframes such as H1, H4, daily, weekly, etc., aiding market awareness.
Even on a 5-minute chart like this, it becomes easier to identify potential support and resistance in higher-timeframe zones, providing material for breakouts, reversals, pullbacks, and retracements scenarios.
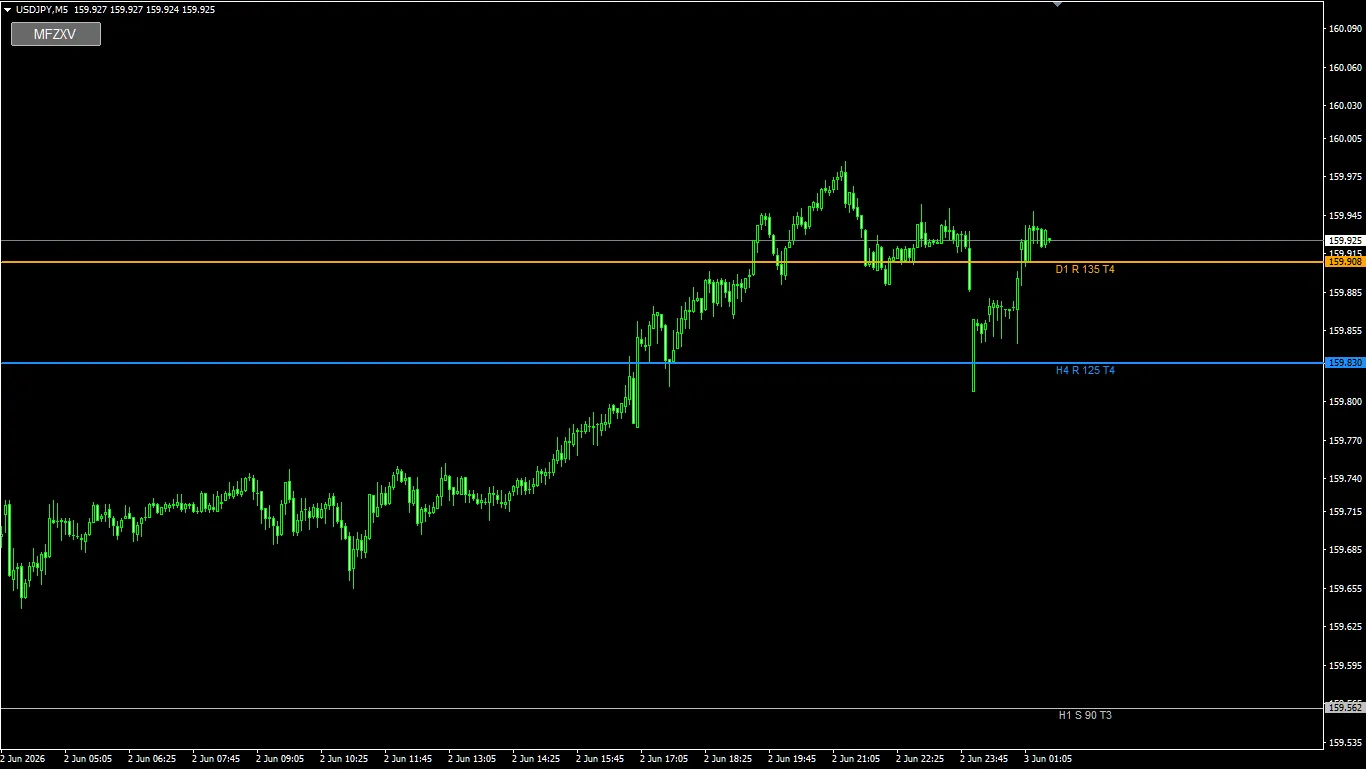
Image: USDJPY 5-minute chart displaying MFZ Auto SR lines in the morning
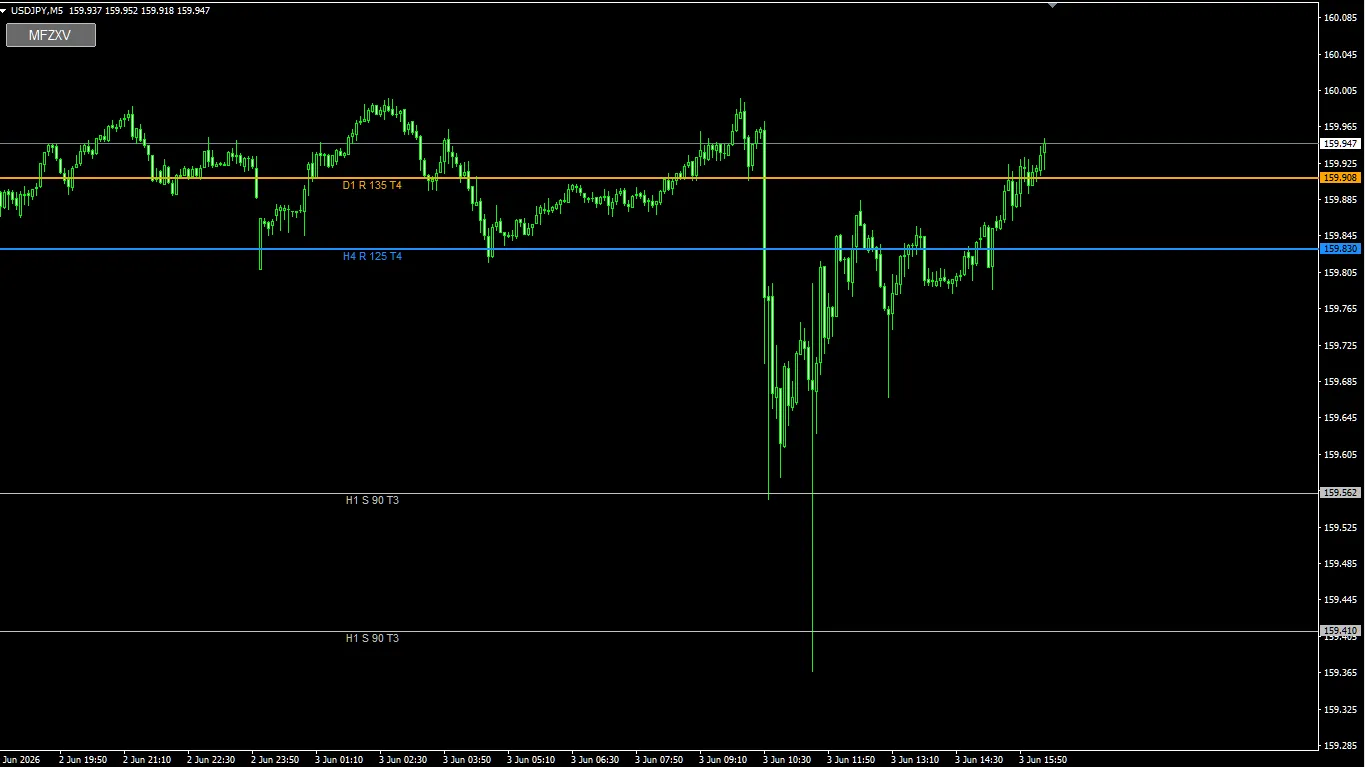
Image: subsequent price action on USDJPY 5-minute chart
Key points seen in this image
Currency pair is USDJPY, timeframe is 5 minutes. In the image, price rises, then moves around the D1 R 135 T4 area, and is then pushed down toward around H4 R 125 T4.
In the second image, price falls sharply to near H1 S 90 T3 around 159.562, then recovers and returns toward around D1 R 135 T4.
- Yellow line: D1 R 135 T4, near 159.908
- Blue line: H4 R 125 T4, near 159.830
- White-toned line: H1 S 90 T3, near 159.562
- Lower side also shows an H1 S 90 T3 line near 159.410
- Current price on the second image appears around 159.947, above the D1 line
When multiple lines are close together as in this case, it helps to view the area between the D1 line and the H4 line as an “upper-timeframe battle zone” rather than focusing on a single line, for easier analysis.
Main lines visible in the image
| Line display | Approximate price region | Beginner-friendly interpretation |
|---|---|---|
| D1 R 135 T4 | Around 159.908 | Daily line serving as a support candidate. If price breaks below and then returns, it can be viewed as a line indicating potential upper price limits. |
| H4 R 125 T4 | Around 159.830 | 4-hour resistance candidate. However, price on the image crosses above and below, making this a price zone prone to clashes and battles. |
| H1 S 90 T3 | Around 159.562 | 1-hour support candidate. A line to gauge downside during sharp declines. |
| H1 S 90 T3 | Around 159.410 |
Pay attention to price movement to the right of the labels
When viewing MFZ Auto SR, check not only the lines but also the position of the line labels.
In this indicator, labels appear near the time when lines are created or drawn. That means candles to the right of the label are the price movements formed after the line appeared.
In the current image, price around the D1 R 135 T4 and H4 R 125 T4 labels seems to bounce around near the lines to the right. This is not about lines drawn later, but about how price reacted to already-displayed lines.
For beginners, instead of judging solely by the line name, observe how price is supported, breaks, or returns to the right of the label to better understand line usage.
Focused line 1: Around D1 R 135 T4
D1 R 135 T4 is displayed as a daily-line support candidate. The price region is around 159.908.
In the first image, after rising, price appears to briefly break above this D1 line and then pull back toward it. In the second image, price hovers around the D1 line several times.
S is support candidate, but if price breaks below and returns, it may become a line marking resistance. In the second image, price seems to finish above this line, suggesting a watch for whether price can stay above it again.
How to read D1 R 135 T4
- See if price stabilizes above the line
- If it breaks lower, watch whether it encounters further resistance near the line
- After breaking above, see if pullbacks hold as support
- Because this is a daily line, view it on the 5-minute chart as a somewhat wider price band
Focused line 2: Around H4 R 125 T4
H4 R 125 T4 is shown as a 4-hour resistance candidate. Price region around 159.830.
In the first image, after crossing above this line during ascent, price appears to extend higher. Later to the right, there is a sharp drop and price returns near this H4 line.
In the second image, price moves around near the H4 R 125 T4 area; after a drop, it again moves upward.
R is a resistance candidate, but if price breaks above and returns, the vicinity can become a pullback confirmation area. In the image, this H4 line appears to be central to price action, not just a simple resistance.
After price breaks above a resistance candidate, it may come back toward the line again. At that time, determine whether the line remains upper resistance or becomes a reference for potential downside confirmation.
Focused line 3: Around H1 S 90 T3
In the second chart, price appears to drop significantly from morning to around the H1 S 90 T3 area at 159.562.
On the image, after reaching near this line, price shows a long lower wick and moves back up. H1 S 90 T3 is a 1-hour support candidate, so it is easy to use as a downside target during sharp declines.
However, a long lower wick does not mean you should immediately buy. After large moves, price action tends to be choppier, so determine whether the rebound continues or whether price tests the line again.
How to read H1 S 90 T3
- See if price recovers with a lower wick after the drop
- See if new lows form again near the line
- See if highs and lows rise after the rebound
- If price breaks below, check the next lower line
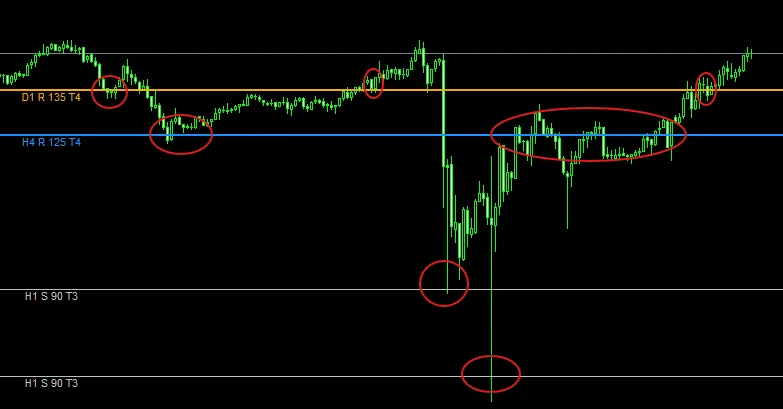
Image: zoomed chart of reactions around D1 R 135 T4, H4 R 125 T4, and H1 S 90 T3 areas
Trading plan derived from this chart
From here, this is not an instruction to buy/sell, but a way to categorize scenarios based on lines.
| Scenario | Lines to watch | What to confirm |
|---|---|---|
| A scenario where price is supported above the D1 line | D1 R 135 T4 | Price remains above around 159.908 and holds during pullbacks |
| A scenario watching cross-zone battles across the H4 line | H4 R 125 T4 | Whether it breaks above 159.830 and sustains, or pulls back |
| A scenario watching rebounds after a sharp drop | H1 S 90 T3 | Whether lower wick/highs continue around 159.562 |
| A scenario watching a return after a break below | D1 R 135 T4、H4 R 125 T4 | If price returns near the broken line, observe whether upper price pressure increases or if it breaks above again |
Beginner-friendly points
In this USDJPY example, D1 and H4 lines are close, and price seems to move around them several times.
In such cases, instead of relying on a single line, think of the area between multiple lines as zones to simplify decision-making.
- View D1 R 135 T4 as a daily resistance candidate
- View H4 R 125 T4 as a 4-hour resistance candidate
- If price crosses lines, do not decide immediately—confirm stabilization
- After sharp declines, also check lower-line like H1 S 90 T3
- Watching the reactions to the labels to the right helps interpret post-display price moves
When price moves around the lines to the right of the labels as shown, you can see “how price reacted after the line appeared.” This is about reacting to already-displayed lines, not lines drawn later.
Disclaimer
It is not an automated trading EA.
It does not guarantee profits.
Displayed lines are for forming trading plans.
Ultimately, trading decisions should be based on your own rules and risk management.
There is a risk of capital loss in FX.
Depending on market conditions, displayed lines or zones may be less functional.
Past chart examples do not guarantee future profits.
Summary
In this USDJPY 5-minute chart, we focused on price reactions around D1 R 135 T4, H4 R 125 T4, and H1 S 90 T3.
In the images, price oscillates around the D1 and H4 lines, and after a sharp drop, it retreats from around the H1 support area.
For beginners, use lines not as absolute answers, but as criteria to determine where reactions may occur and where a scenario might change if a line is breached.
- Check the label positions
- Observe price movement to the right of the labels
- Confirm lines on daily, 4-hour, and 1-hour timeframes separately
- Consider scenarios of reaction, breakout, pullback, and retracement
- Make final judgments based on your own rules and risk management
If it is difficult to identify major higher-timeframe price levels from scratch, MFZ Auto SR helps display higher-timeframe lines on the lower-timeframe chart, simplifying the process of organizing trading plans.
It acts as an intuitive entry into multi-timeframe analysis and provides a foundation for considering rebound, breakout, pullback, and retracement scenarios.
Divide scenarios.
Make judgments based on your own rules.