

20260603 XAUUSD 5-minute view MFZ Auto SR line reaction and scenario整理
This time, using the XAUUSD 5-minute chart, I will explain how to view the lines displayed by MFZ Auto SR in the higher timeframes.
There are three images: the first shows the morning line display, the second shows subsequent price movement, and the third is an enlarged chart near the line showing the reaction.
MFZ Auto SR is an MT4 compatibility indicator that displays price ranges in higher timeframes (such as H1, H4, daily, weekly) on lower-timeframe charts, to aid environmental recognition.
Even on a 5-minute chart like this, it becomes easier to check potential support and resistance from hourly, 4-hour, and daily timeframes.
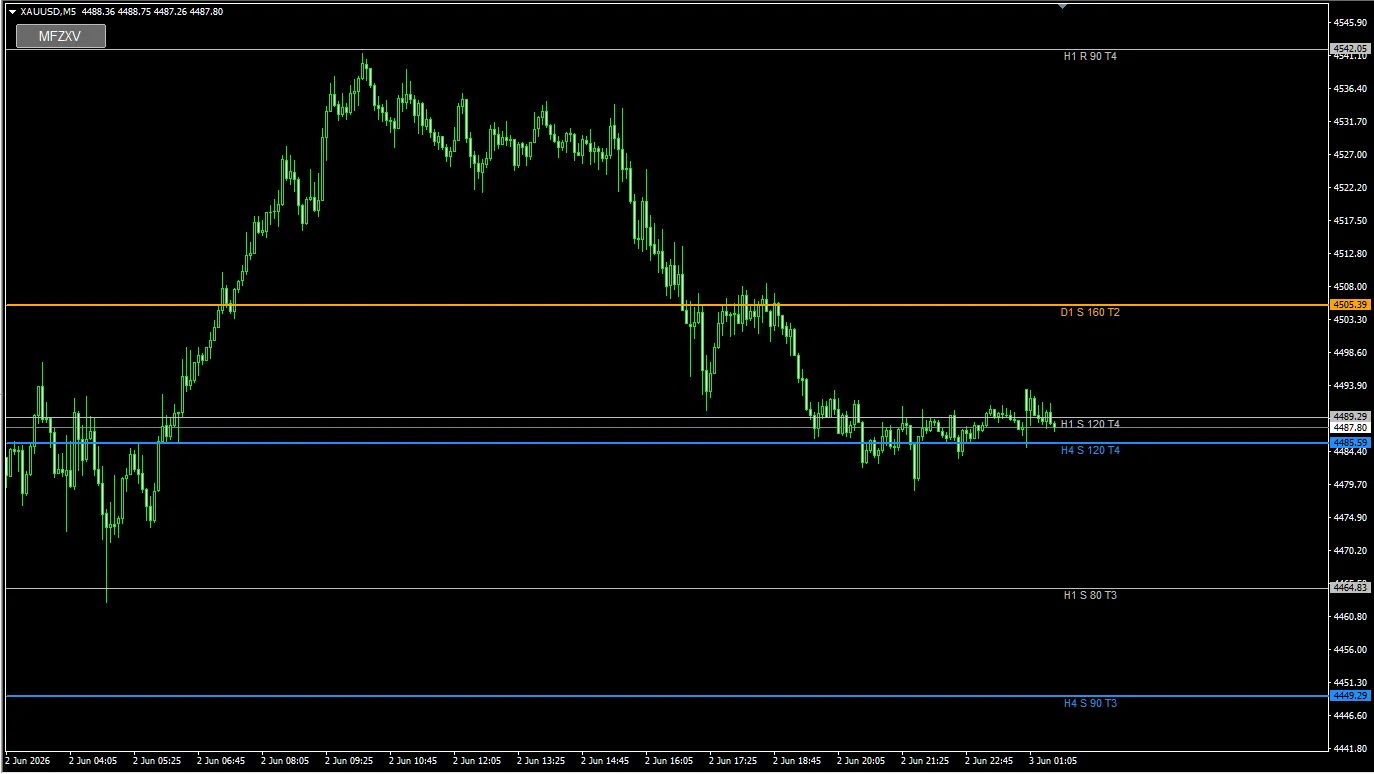
Image: XAUUSD 5-minute chart displaying MFZ Auto SR lines in the morning
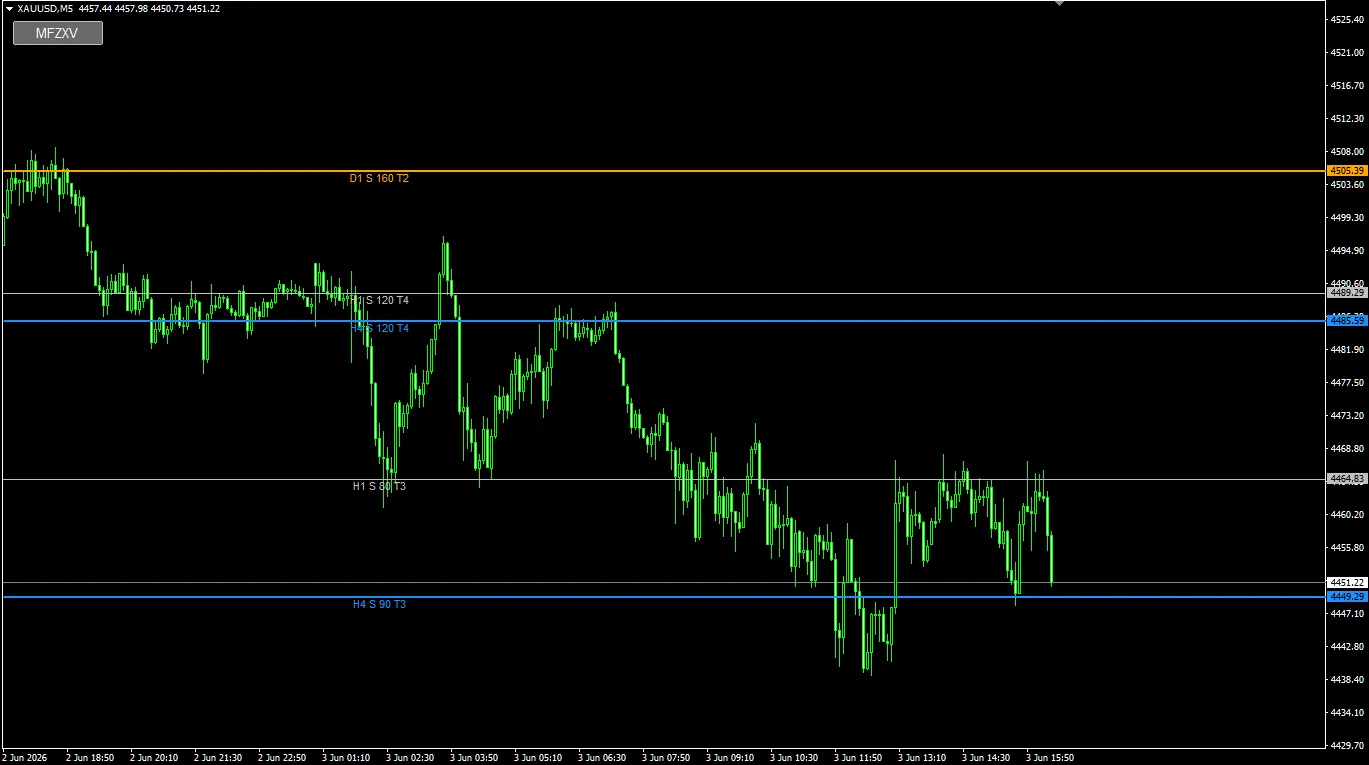
Image: later price movement on the XAUUSD 5-minute chart
Key points seen in these images
In the first morning chart, after a sharp decline, the price appears to dip toward the nearby support candidates on the H1 and H4 timeframes.
In the second image, the price moves further down, reacting near H1 S 80 T3 and H4 S 90 T3 areas, roughly around those levels.
- XAUUSD 5-minute chart
- Above it shows D1 S 160 T2 and H1 R 90 T4 lines
- In the middle, H1 S 120 T4 and H4 S 120 T4 appear in close proximity
- Below, H1 S 80 T3 and H4 S 90 T3 appear
- In the third image, reactions near H1 S 80 T3 and H4 S 90 T3 are clearly enlarged
When looking at the lines, don’t think “trade as soon as touched.” Instead, check whether price stops there, breaks through, or returns after breaking. The line is not the answer but a criterion to shape scenarios.
List of main lines visible in the image
| Line display | Approximate price range | How to view it for beginners |
|---|---|---|
| H1 R 90 T4 | Around 4542.05 | Hourly resistance candidate. Can be seen as a potential resistance above the current price. |
| D1 S 160 T2 | Around 4505.39 | Daily support candidate. In the second image, positioned above, it can also be viewed as a guidance for a retrace. |
| H1 S 120 T4 | Around 4489.29 | Hourly support candidate. In the morning, close to the current price, a zone where defense/offense is likely. |
| H4 S 120 T4 | Around 4485.89 | 4-hour support candidate. Close to H1 S 120 T4; can be viewed as a zone. |
| H1 S 80 T3 | Around 4464.83 | Support candidate that appears to be momentarily acknowledged after a drop; later may serve as a target for upside moves. |
| H4 S 90 T3 | Around 4449.29 | 4-hour support candidate. In the third image, price action around this line shows a stopping/recall behavior. |
Focus on price action to the right of labels
What matters when viewing MFZ Auto SR is the label position of the line.
In this indicator, the line name and the label indicating the timeframe appear near the time the line was created/drawn. In other words, the candles to the right of the label represent price action formed after the line was displayed.
In these images, it appears price reacts to the right of the H1 S 80 T3 and H4 S 90 T3 labels. This is not a line drawn retrospectively for convenience; it is material for assessing how the price moved after the lines were already displayed.
Beginner users will find it easier to see how price reacted to the line after it was displayed by looking at price action to the right of the label, rather than only at the line itself.
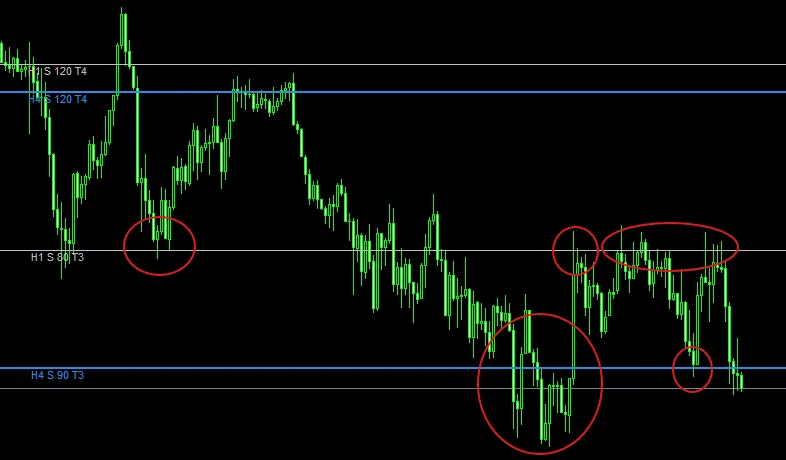
Image: zoomed chart showing reactions around H1 S 80 T3 and H4 S 90 T3
Attention line 1: near H1 S 80 T3
In the enlarged third image, there is a scene where the price seems to pause near H1 S 80 T3. The left side encircled in red shows the price dipping to the line and then returning with a lower wick.
S stands for support candidate. H1 S 80 T3 can be viewed as a commonly watched support candidate on the hourly timeframe. T3 indicates the number of touches or reactions.
However, being a support candidate does not mean to buy there. It is a criterion to see whether price can be supported, break through, or return after breaking.
How to view H1 S 80 T3
- Look for a lower wick around the line
- See whether price returns without closing below the line
- See if it moves upward again after being briefly supported
- If it breaks, check the next support candidate
Attention line 2: near H4 S 90 T3
In the large red circle near the bottom center of the third image, price appears to oscillate around H4 S 90 T3.
H4 means the 4-hour timeframe. Even when trading on the 5-minute chart, the 4-hour price zone can be a material factor for environmental recognition, so it’s easy to overlook if you only look at the lower timeframe.
In the image, there is a movement where price briefly stops at H4 S 90 T3 and then rebounds back toward near H1 S 80 T3.
In such cases, one approach is to use H4 S 90 T3 as a reference to test whether price can hold there or clearly break lower.
Rather than viewing a single line as a thin line, it is clearer to see it as a slightly wide price range. Especially for instruments like XAUUSD with large price movement, it’s important to observe price action around the line rather than at the exact line.
Attention line 3: a scenario where H1 S 80 T3 serves as a return target
In the right side of the third image, after rebounding from near H4 S 90 T3, price seems to have returned to near H1 S 80 T3.
What to focus on here is that the H1 S 80 T3, originally viewed as a support candidate, could later be seen as a target for upside moves after a break lower.
In the image, price appears to resist around H1 S 80 T3 several times. This suggests the previously broken support candidate might be treated as a resistance target during the subsequent pullback.
However, this is only within the visible chart. In reality, one must consider candle confirmations, higher-timeframe trends, and recent highs/lows as well.
Trading plans that can be inferred from this chart
From here on, I will organize how to divide scenarios using lines rather than issuing trading instructions.
| Scenario | Lines to watch | What to confirm |
|---|---|---|
| Watch for support rebound | H1 S 80 T3, H4 S 90 T3 | Check for lower wicks, reversals, or higher lows near the lines. |
| Watch for a break | H4 S 90 T3 | See whether price breaks with real bodies or if downward momentum continues after the break. |
| Wait for a pullback | H1 S 80 T3 | When price returns near the broken line, observe whether upside potential becomes heavier. |
| Confirm upper-side targets | H1 S 120 T4, H4 S 120 T4, D1 S 160 T2 | If rebounds continue, identify the next likely upper price range to watch. |
Beginner-friendly points
What we want beginners to look at in this chart is not just whether the line was touched.
What matters is how price reacted around the line. Did it show wicks, break with a body, or return after breaking? Observing these helps to divide trading plans more easily.
- R should be viewed as resistance candidate
- S should be viewed as support candidate
- T as a guideline for number of touches or reactions
- Numbers that look like scores indicate importance
- Observe price action to the right of labels
- Divide scenarios into rebounds, breaks, pullbacks, and retracements
As in this example, by looking at how price reacted after the line was displayed in the morning, you can assess the reaction to the already-displayed line rather than a line drawn retroactively.
Disclaimer
It is not an automated trading EA.
It does not guarantee profits.
The displayed lines are materials to help you form a trading plan.
Final trading decisions should be based on your own rules and risk management.
FX carries the risk of capital loss.
Depending on market conditions, the displayed lines or zones may be less functional.
Past chart examples do not guarantee future profits.
Summary
In this XAUUSD 5-minute chart, we examined how the price moved after the morning display of lines on H1, H4, and D1.
In particular, around H1 S 80 T3 and H4 S 90 T3, there are scenes where the line was treated as a support candidate or as a target for a retrace after a break.
For beginners, it is crucial not to view lines as the answer, but to observe price reactions and use them as a basis for considering multiple scenarios.
- Check lines displayed in the morning
- Observe price action to the right of labels
- Check wicks, reversals, breaks, and retracements near the lines
- Consider multiple scenarios from a single line
- Make final judgments based on your own rules and risk management
If you find it difficult to identify important price levels on higher timeframes, MFZ Auto SR can display those lines on lower-timeframe charts and help organize decision-making materials for trading plans.
It provides a visual entry point to multi-timeframe analysis and can serve as a basis for considering scenarios such as rebounds, breaks, pullbacks, and retracements.
Divide the scenarios.
Make decisions based on your rules.