

Cryptocurrency market analysis [June 2]
As of June 2, 2026: Price movements and market backdrop for major cryptocurrencies (BTC·ETH-centered)
In the current cryptocurrency market, market "polarization" is becoming increasingly pronounced.
Since last week, while traditional equity markets (especially US stocks) have remained near all-time highs and firmed, the cryptocurrency market led by Bitcoin (BTC) has continued to languish.
The primary factor is ongoing outflows from U.S. spot Bitcoin ETFs, with institutional investors adopting a risk-off posture in the background.
Today's moves (as of June 2, 2026, UTC basis)
The current price trends and volatility for major cryptocurrencies are as follows.
·Bitcoin (BTC)
The current trading range is roughly $67,700 to $72,000. Recently, it traded around $67,716, and compared with the previous day, has shown a decline of about 3% to 5%. Intraday price swings have been volatile, and there have been noticeable occasions where the previously held$70,000 round level has been broken, indicating a continued heavy upper for the upside.
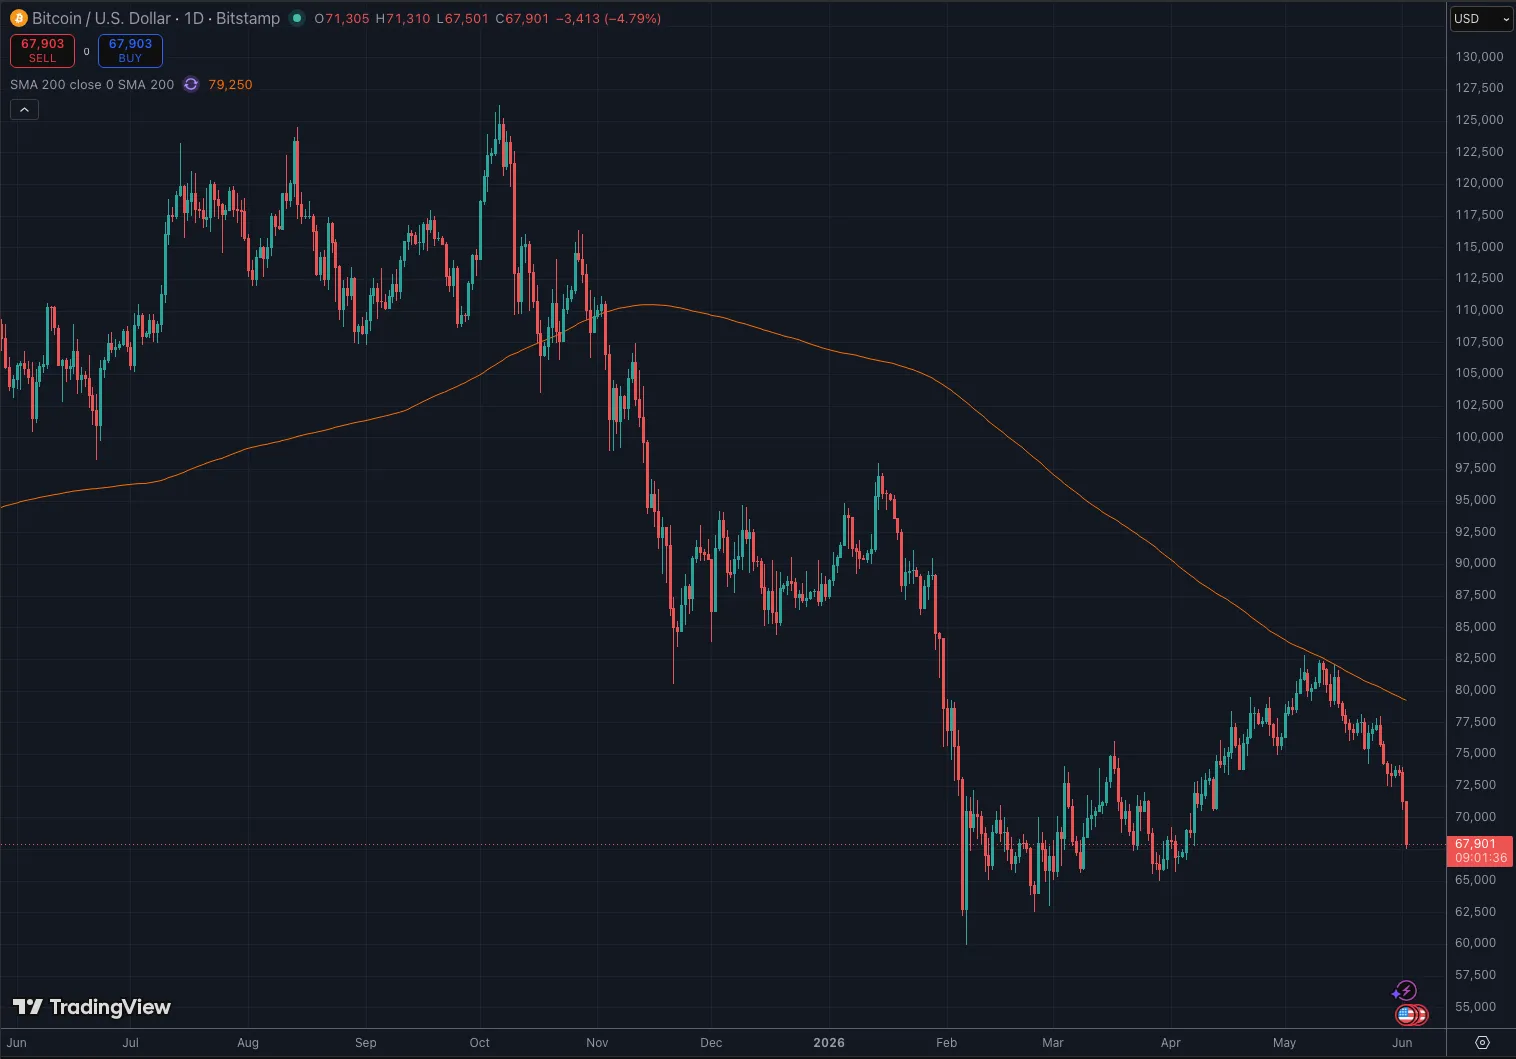
Bitcoin daily chart
·Ethereum (ETH)
The current range is around $1,970 to $1,990. Daily changes are roughly +0.2% or slightly negative. Unlike Bitcoin, it has not shown a sharp decline and remains comparatively solid and stable.
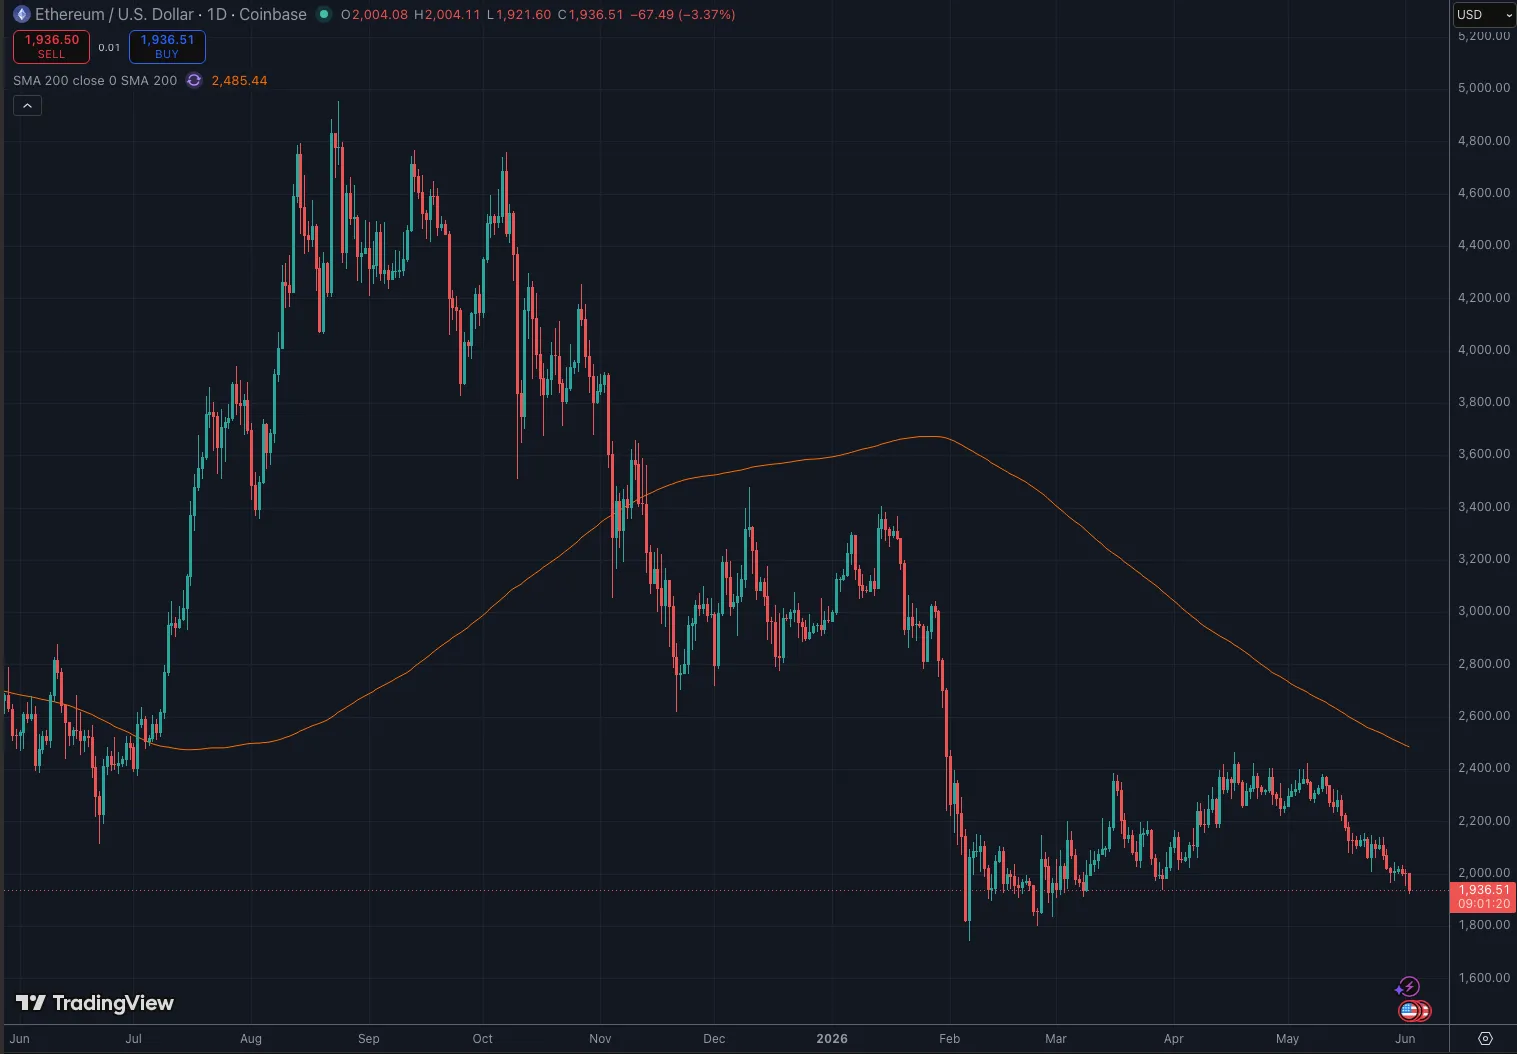
Ethereum daily chart
·Other major altcoins (top market cap examples)
Major coins like BNB (Binance Coin), XRP (Ripple), SOL (Solana) have fallen by about 1% to 4% in tandem with the decline of Bitcoin, the largest market-cap asset.There is a risk-off mood prevailing across the crypto market
Looking at traditional financial markets, US stocks remain near their all-time highs, pushing stock-linked indices higher. However, for major cryptocurrencies including Bitcoin, today marks a clear "down day," ending the session down by 3.2%.
The psychological trigger for this decline was the movements of Michael Saylor of MicroStrategy. He had previously hinted at selling some of his Bitcoin to fund STRC dividends, and finally put that into action.The sale involved 32 BTC (sold at an average around $77,000, totaling about $25 million). Compared with MicroStrategy's enormous total Bitcoin holdings, it is a tiny amount, but for market participants who believed Mr. Saylor would forever HODL (hold) no matter what, this was a shock and overturned that myth.
Main factors moving the market and latest news
The factors driving the current bearish trend are varied, including macroeconomics, geopolitics, and specific news.
1. Escalation of geopolitical tensions
Tensions in the Middle East involving the US, Israel, and Iran have intensified again. Reports of attacks and fluctuating hopes for ceasefire have triggered risk-off selling of risk assets among investors. This has driven crude oil prices higher, leading to funds fleeing to safe-haven assets such as the US dollar and gold.Safe-haven assets like the dollar and gold are attracting funds.
In theory, Bitcoin could function as a digital gold safe asset, but in practice it has often been sold alongside stocks as a high-risk, high-return asset, failing to demonstrate commodity-like characteristics.
2. Macro economy (monetary policy) headwinds
US interest rates and bond yields remain high, and the dollar remains strong. Furthermore, continued outflows from spot ETFs have led institutional investors—previous market leaders—to adopt a cautious stance (waiting or reducing positions), putting downward pressure on prices.
3. Wariness toward large-scale selling (whales)
· The aforementioned MicroStrategy's report of a third-year sale, andso-called "whales" moving funds, have significantly worsened market sentiment across investors.
Developments and trends over the past week (roughly the last week)
Looking back on the macro trend over the past week, market weakness has become more pronounced.
· Bitcoin (BTC) movement
Has fallen roughly 7% to 10% from earlier, trading in the high 73k to 75k range recently, but then dropped sharply, leading to a very weak monthly trajectory.
· Ethereum (ETH) movement
Approximately down 6% to 7%. Relatively better than Bitcoin, but it has failed to hold the psychological level around $2,000 and has slipped below it. Over the past month, it has declined by about 15% overall.
· Market-wide summary
Unpredictable geopolitical events and large-scale ETF outflows have created a double blow, pushing the market into a fully risk-off phase. Additionally, Bitcoin's share of market dominance remains high, causing altcoins to fall more sharply than Bitcoin and leaving them comparatively weaker.
Bitcoin spot ETF flows (in-depth)
The U.S. spot BTC ETF, approved and launched in 2024, represents the largest bridge for traditional Wall Street institutions to enter the crypto market and is a iconic financial product. Main products include BlackRock's IBIT, Fidelity's FBTC, and Grayscale's GBTC.
Latest flow status (details around June 1–2)
· Data for the most recent day (June 1): overall market experienced net outflows of about $484 million. Of this,the majority came from BlackRock's IBIT at about $440 million outflow. Fidelity's FBTC also saw outflows of about $37 million.
· Recent trend: a record of “10 consecutive days of net outflows” has been observed, with tens of billions of dollars exiting ETFs from late May into June (e.g., IBIT alone saw outflows of $96.6 million in just one week).
· Long-term cumulative data: since ETF launch, total cumulative inflows remain positive at over $55 billion (plus 55B, about 8 trillion yen, or about 700,000 BTC), preserving a strong long-term base.
· Market impact: short-term, intermittent outflows act as a clear price-down pressure; conversely, inflows provide strong buying support. Note that Grayscale’s GBTC carries high fees, so ongoing outflows and switching or taking profits have favored cheaper options like IBIT and FBTC.
Bitcoin (BTC) downside: individual factors and latest topics
Key concrete factors and related news that recently intensified BTC downside are as follows.
The Bitcoin investor sentiment gauge, the Fear & Greed Index, is currently at [23], indicating the market is in Extreme Fear. The Bitcoin price at that time was $68,987.
【Paid subscription notice】
In the paid subscription area, we provide deeper, value-driven, stock-specific analyses.
“We want to invest in the next big gain beyond Bitcoin and Ethereum.”
“We want to understand the fundamental flows and future of the crypto market and catch that wave reliably.”
If you think this way, please consider subscribing. Consistently high-quality research is the key to big success.
(Since its launch in 2016, this report has always delivered at the front lines of the market)