
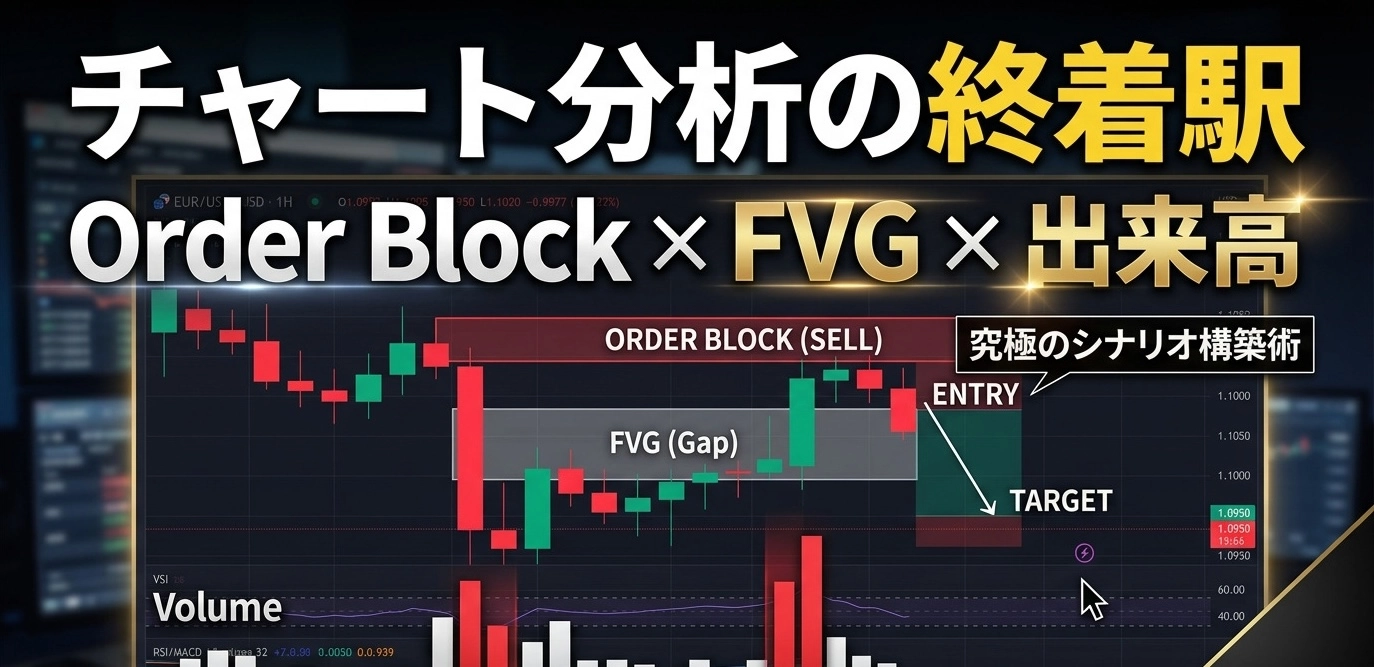
Chart analysis terminus: Order Block × FVG × Volume — The ultimate scenario construction technique copy
The Final Destination of Chart Analysis: Order Block × FVG × Volume
— The Ultimate Scenario Construction Method
The Cruel Truth: Your “Effort” Won’t Always Pay Off
1. A Maze Under the Banner of “Indicators”
How much time have you spent on charts so far?
Stochastics show oversold, and the three lines of RCI align at the bottom. You enter with the conviction that this time is the reversal. Yet the chart mercilessly pushes further, dragging your stop losses along and accelerating—
Why is your “earnest effort” so constantly denied?
Because you areviewing only the back mirror (past values) and attempting a race at 200 km/h. Indicators calculated from formulas like Stochastics or RCI are merely price “follow-ups.” Institutional investors (smart money) are waiting for you to cross that “line” and enter.
2. You Are Designed as a “Gullible” Player
In the market, there are“giants (institutional investors)”that move hundreds of billions in a single order. We retail investors are the ants at their feet. When these giants move, a distortion is inevitably created.
- Order Block (OB):The residuals of their base where massive orders were placed
- FVG (Fair Value Gap):A price vacuum created when orders can’t catch up
They intentionally cause you to break through the textbook horizontal lines you drew, feeding on your stop losses (liquidity) and accelerating toward the direction they truly want to go.
3. The Final Answer to Ride on the Back of the Giants
Then why can Fad precisely capture the reversal points that many traders burn out on as if he has seen them before?
The answer lies in the giants’ undeniable“physical footprints”— the identity of a specific indicator that visualizes those footprints, and how to read it concretely.
This教材 reveals the physics behind the deception and gives youthe final answer to move from “being hunted” to “riding on the giants’ backs.”.Over 15,000 characters of overwhelming contentwill disclose the whole picture without omission.
【Important: Please read before purchase】
This教材 is a digital content that provides reproducible trading techniques. Due to the nature of the product, returned or refunded purchases cannot be accepted under any circumstances. Please proceed only if you are truly prepared to face the market.
【Notes on Investment Advice】
The information provided in this教材 is intended for explanations of chart analysis methods and learning tools. It is not investment advice that directs you to buy or sell specific currency pairs or instruments or guarantees profits. The final decision on investments should always be made by you and with your own responsibility.
Chapter 1: The End of Indicator Faith and an Invitation to the Physics of the Market
1-1. Why doesn’t your “earnest effort” pay off?
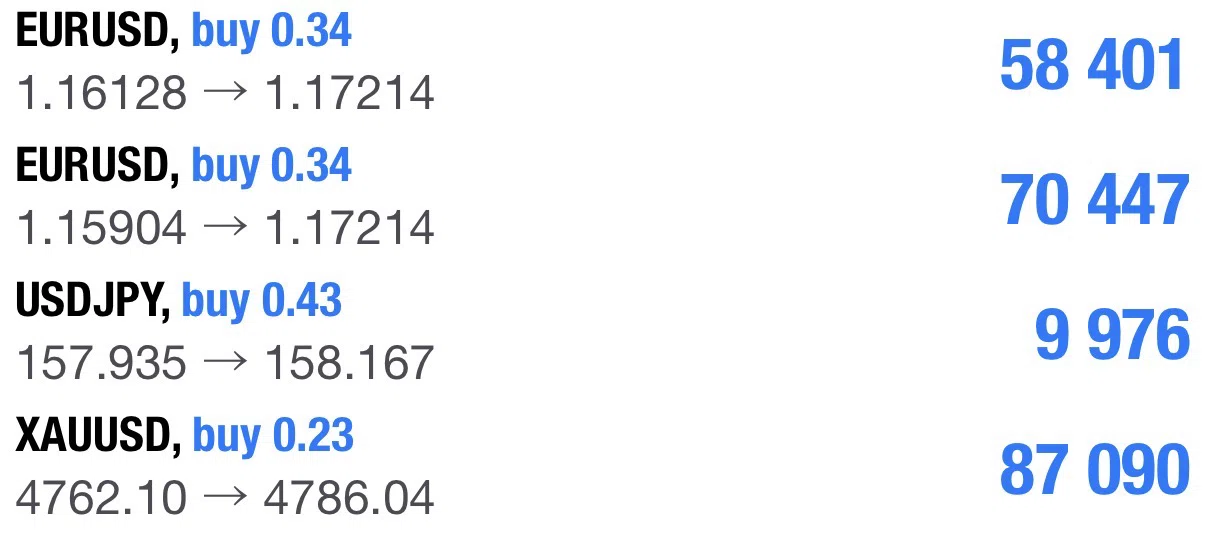
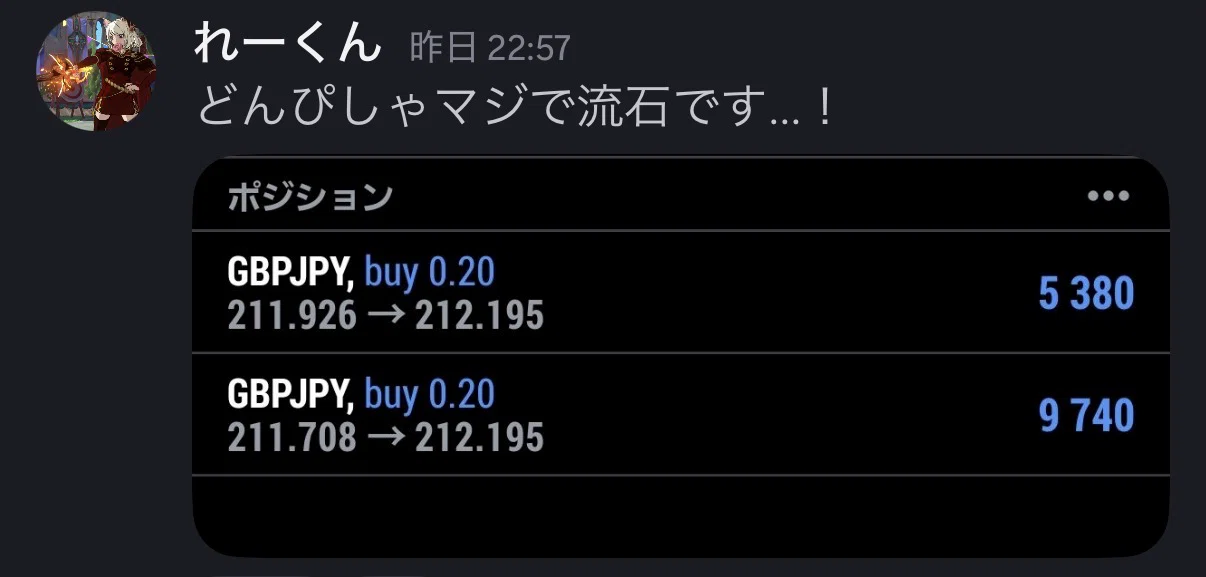
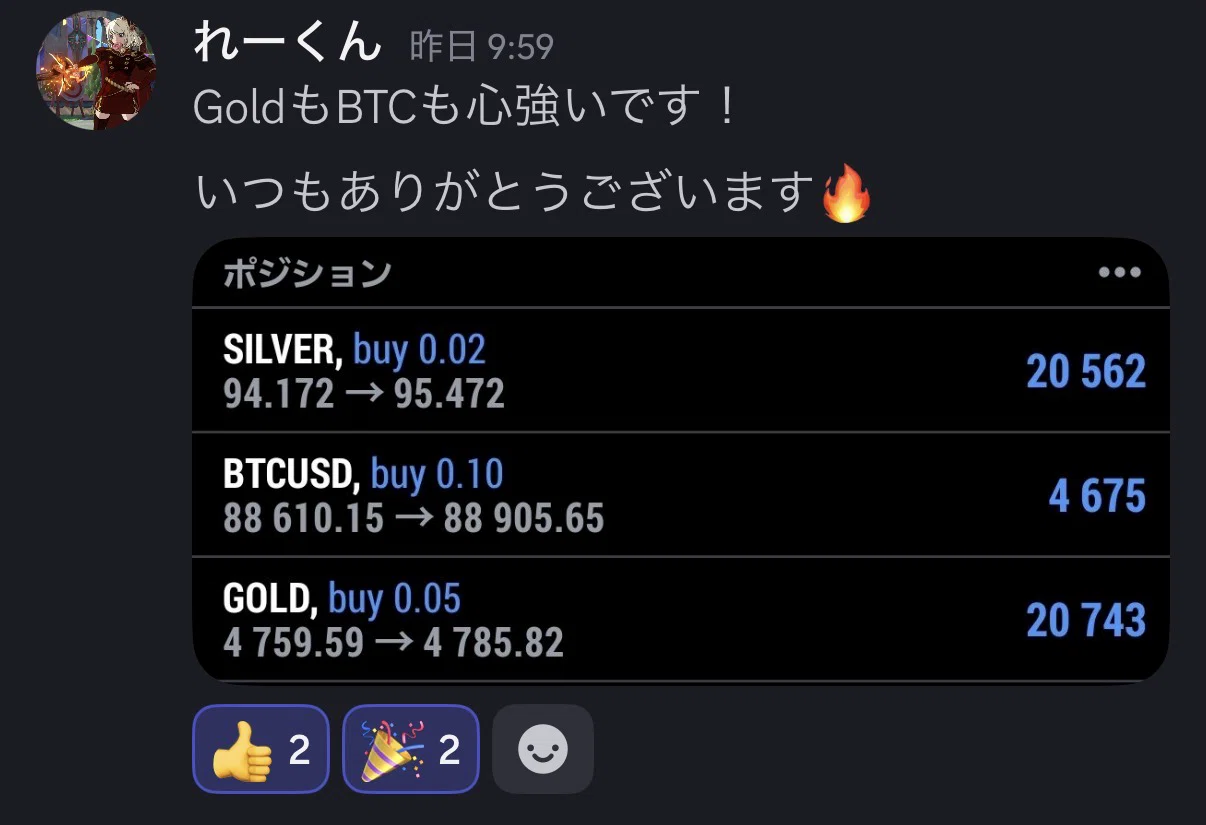
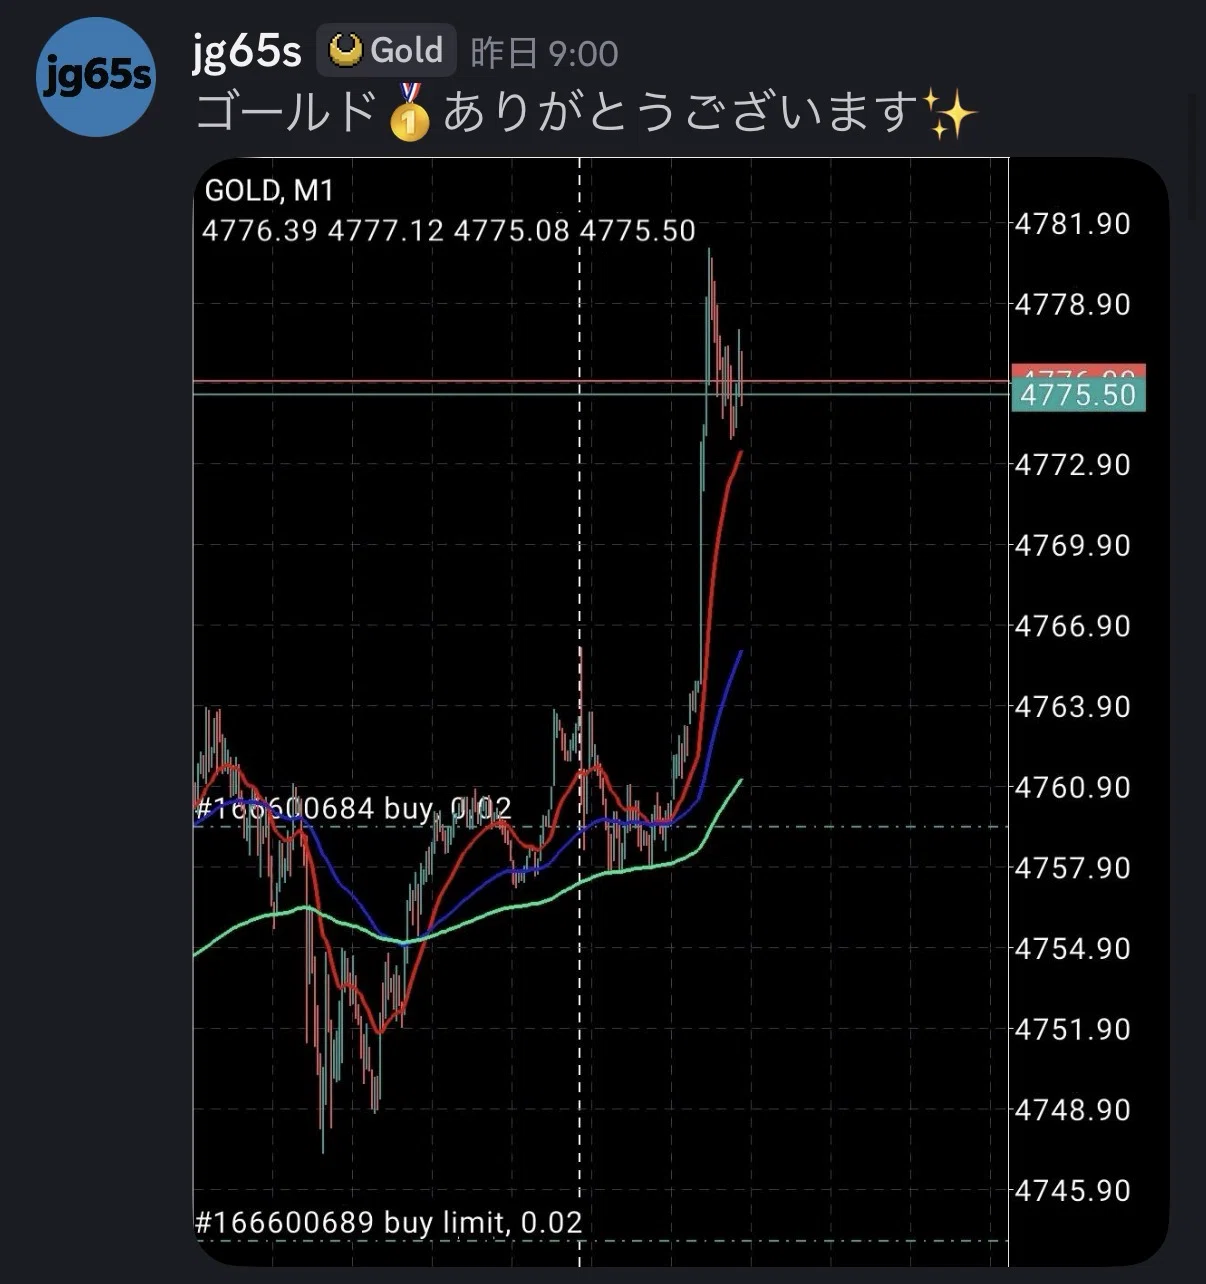
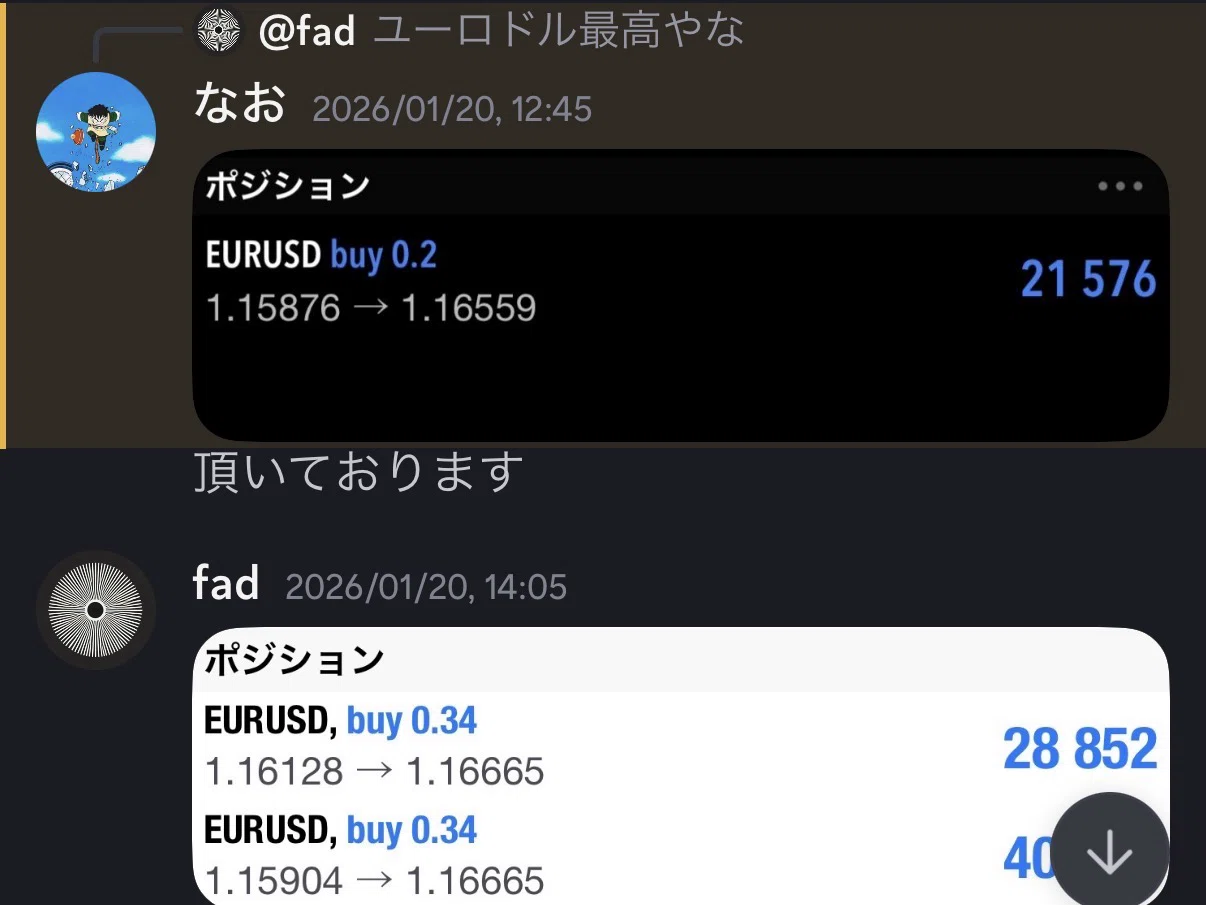
First, look at the reality I’m producing with this method. This is not a prediction, but a confirmed fact.
“Stochastics exceed 80%. It’s overbought. I’ll short on a counter-trend.”
“RCI’s three lines are pinned to the bottom. It should reverse soon.”
If you’ve been repeating these “textbook” trades and draining your assets, stop blaming yourself. It isn’t you. It’s what you have been taught— a “back mirror” named Indicatorthat’s to blame.
Imagine you’re in the driver’s seat of a Formula 1 car traveling 200 km/h. But the windshield is completely blacked out, and all you can see isthe back mirror.
Indicators (RCI, Stoch, moving averages, etc.) are all “lagging indicators” that apply formulas to past prices. Can you predict future sharp turns or walls by looking only at the back mirror? Impossible.
When a strong trend occurs, indicators cling to zones of “overbought” or “oversold,” steadily eating away your capital as they push forward. This is why you keep losing on “counter-trend” moves.
1-2. The Market’s One True Energy: Liquidity
Then what determines the “future price” beyond the windshield?
It isn’t a calculation.It is the orders from institutions with massive funds.
To secure their enormous orders, they require“liquidity”— i.e., opposite orders. The easiest opposite orders to obtain areretail investors’ stop losses.
- Your drawn “ textbook-level horizontal line”:Just beyond it, many retail stop orders accumulate.
- Institutional investors’ moves:They push the price to that line on purpose and turn your stop loss into fuel to accelerate toward the intended direction.
This is the real nature of the phenomenon where prices reverse the moment you take a stop loss.“That phenomenon”.
1-3. Throw Away Indicators, Chase the Footprints
“Smart Money Concept (SMC)”is a framework to identify the movement of these giants and trace the “footprints” of where they placed orders. They are so colossal that traces remain on the chart no matter how much they try to blur them. This is the core of this教材—the“three physical indicators”.
① Order Block (OB):The base where they placed large orders. When price returns to this level, unfilled orders fire and rally energy emerges.
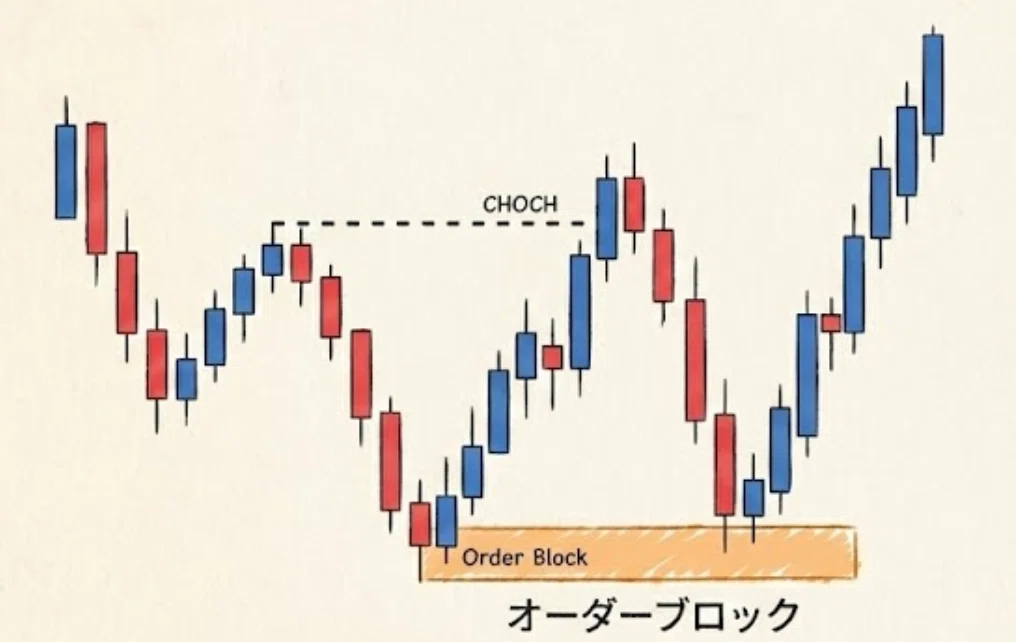
Concept diagram of Order Block
② FVG (Fair Value Gap):A price vacuum created when one-way demand outstrips supply and opposing orders lag behind.
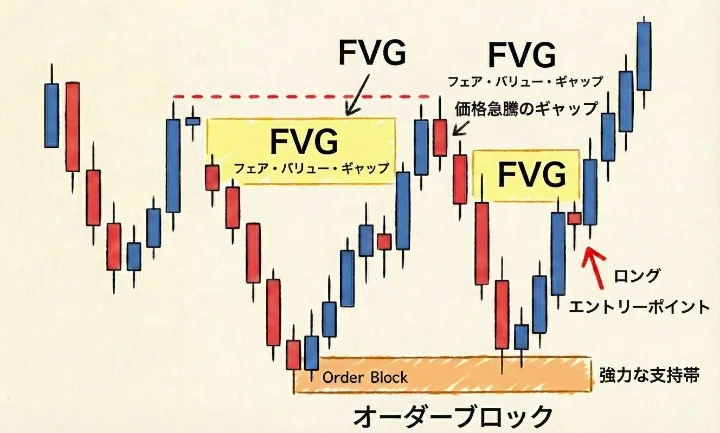
Concept diagram of FVG
③ Volume:Conclusive evidence that they actually deployed large funds. Price can be manipulated, but volume cannot lie.
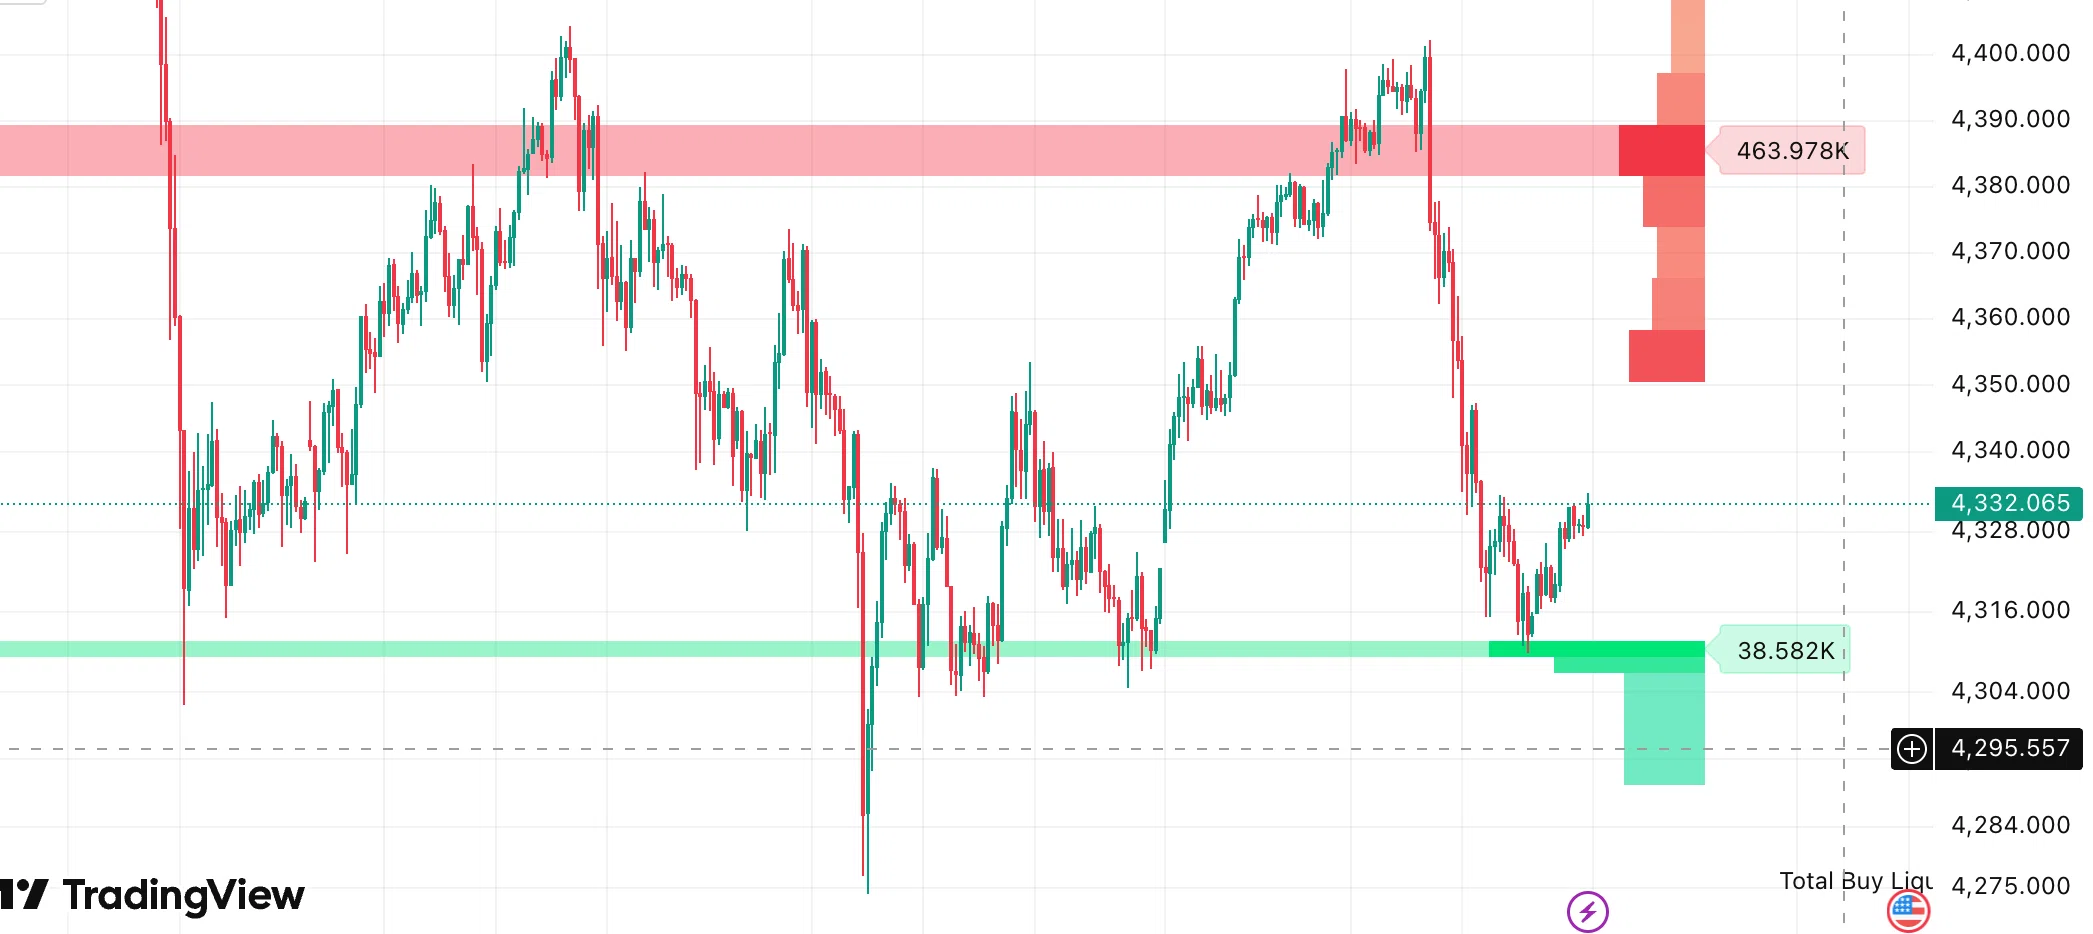
Red = sell volume / Green = buy volume
1-4. The Mathematical Proof of Expectation
E: Expectation, W: Win rate, R: Risk-Reward ratio, L: Lose rate (= 1 − W)
This method does not maximize win ratebut maximizes risk-reward ratio (R)by riding OB and volume to minimize stop loss width and maximize take-profit width.
【Calculation Example】10 trades, 3 wins, 7 losses (win rate 30%), RR 1:5
Profit: 3 × 5R = +15R
Loss: 7 × 1R = −7R
Net profit: +8R (even with 70% losses, assets grow steadily)
Chapter 1 Summary
- Indicators are lagging tools reflecting the past and are structurally unsuitable for predicting the future.
- The market is physically moved by giant orders, and retail stop losses fuel institutional funds.
- By追跡 big footprints (OB, FVG, and volume), you win not by win rate but by“expectation”.
Chapter 2: The Abyss of Order Block (OB) — The Wall of Orders Where Giants Hide
2-1. Discarding the Misconception of the “Just Before Upward Color”
If you were taught that “the last bearish candle just before the rise is the Order Block,”that definition alone is insufficient. The color (bearish or bullish) is secondary information. What matters is“who was there, what they intended, and how much capital they deployed”as a physical fact.
OB functions not because “everyone sees it,” but becausethere are unfilled orders physically present there.
2-2. The 3 Golden Rules to Identify Real OB
The zone where all of the followingthree conditions are metis the genuine base of institutional investors.
① Liquidity Sweep
Right before a real OB forms, price almost always briefly makes a new high or low (textures a wick). This is the giants’ “fuel replenishment.”
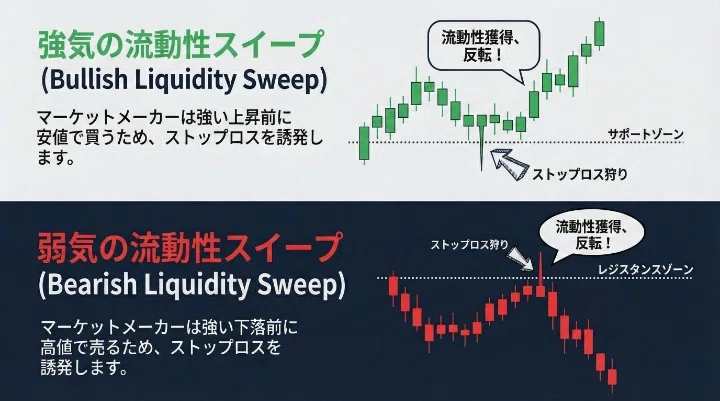
When this wick swallows most of the retail stops, it becomes the gasoline for the giants.
② Market Structure Shift
After fueling, price moves explosively, and must destroy the previous trend structure. In SMC this isBreak of Structure (BOS)andChange of Character (CHOCh)phenomena.
③ FVG Occurrence
Because the giants’ orders are so massive, a gap appears between candles. In three candles,the high of the first and the low of the third do not coincide.
“OB + Structure Shift + FVG.” When all three confluence, that becomes a base to protect.
2-3. Why Does Price Return to OB and Rebound?
Institutions cannot fill all orders at once. 1) They manipulate price to trigger stops (OB formation), 2) Push it forward, some orders remain unfilled, 3) Return price to OB and fill the rest before moving toward the intended direction. This is“repopulate of limit orders (refill)”.
Important:OB is consumed with each retest of remaining orders.First touch has the strongest rebound power, so target the initial retest first.
2-4. Treat It as a Zone, Not a Line
Institutions distribute orders across price bands (iceberg orders). OB is not a point but a thick zone.
| Layer | Name | Characteristics |
|---|---|---|
| Upper | Entry Point (入口) | When the trend is strong, price may rebound here, but reactions are often shallow |
| 50% | Mean Threshold (center of orders) | Most powerful rebound expectedPrime Point |
| Lower | Final Defense (最后防线) | If breached by body price = abandon base →Immediate retreat |
“Lines break, but zones bend.”Place stops outside Final Defense and allow zone thickness. This discipline greatly reduces needless stops.
Chapter 2 Summary
- OB is a physical base that combines liquidity grabs and structural shifts.
- Aim for where unfilled orders refill. First touch is the highest priority.
- Shift from “line” to “zone” to dramatically improve RR.
Chapter 3: FVG (Proof of the Vacuum) — Traces of Energy That Turn Correctness into Certainty
3-1. FVG Is Definitive Proof that the Big Players Passed Through
The moment institutional investors inject massive funds, the balance of buy and sell collapses and an unfilled gap appears. This is the true nature of FVG. In three candles,the high of the first and the low of the third do not coincide. This is a bullish FVG (bearish is the opposite).
3-2. Fad’s Order: Absolute Priority for Entry
【Fad’s Three Entry Rules】
- Order Block (OB):Are you identifying the base where giants lurk?
- Volume (BigBeluga):Is there a real pile of orders at that base?
- Price Action (PA):Does a reversal pattern appear on lower timeframes?
If these three align, you pull the trigger.If OB and volume provide rock-solid evidence, execute irrespective of FVG presence.Waiting for FVG appearance can cause you to miss the initial move and worsen RR.
3-3. FVG as a Vanity Meter for Take-Profit and Trend Strength
① Proof of Trend Strength:If a large FVG stacks after entry to form, it’s evidence that the big players are seriously pushing prices. You can hold with confidence.
② Define Take-Profit Target:Unfilled FVG in the opposite direction is a strong magnet. The 50% line of that FVG (CE) becomes a candidate for take-profit.
“Enter with OB and volume, gain certainty and take-profit targets with FVG.” The order of these steps maximizes profits.
Chapter 4: The Violence of Volume — Visualizing the “Liquidity Pool” with BigBeluga
4-1. Volume Is the Only Tangible Proof
Prices can be manipulated by giants’ algorithms, butvolume cannot lie.If enormous funds are deployed, a volume spike will always remain. If price moves without accompanying volume, it’s likely a false movement.
4-2. Recommended Indicator: Dynamic Liquidity Depth [BigBeluga]
Available on TradingViewfor freeDynamic Liquidity Depth [BigBeluga]is an ATR-based buffer tool that estimates stop-loss concentration bands and visualizes them with a heatmap.
![Dynamic Liquidity Depth [BigBeluga]](https://assets.st-note.com/img/1767538809-FgaG0L3imQlwUDYO8oj45E91.png)
Dynamic Liquidity Depth [BigBeluga]
| Color | Meaning | How to Read |
|---|---|---|
| Dark red | ||
| Dark green | ||
| Light band |
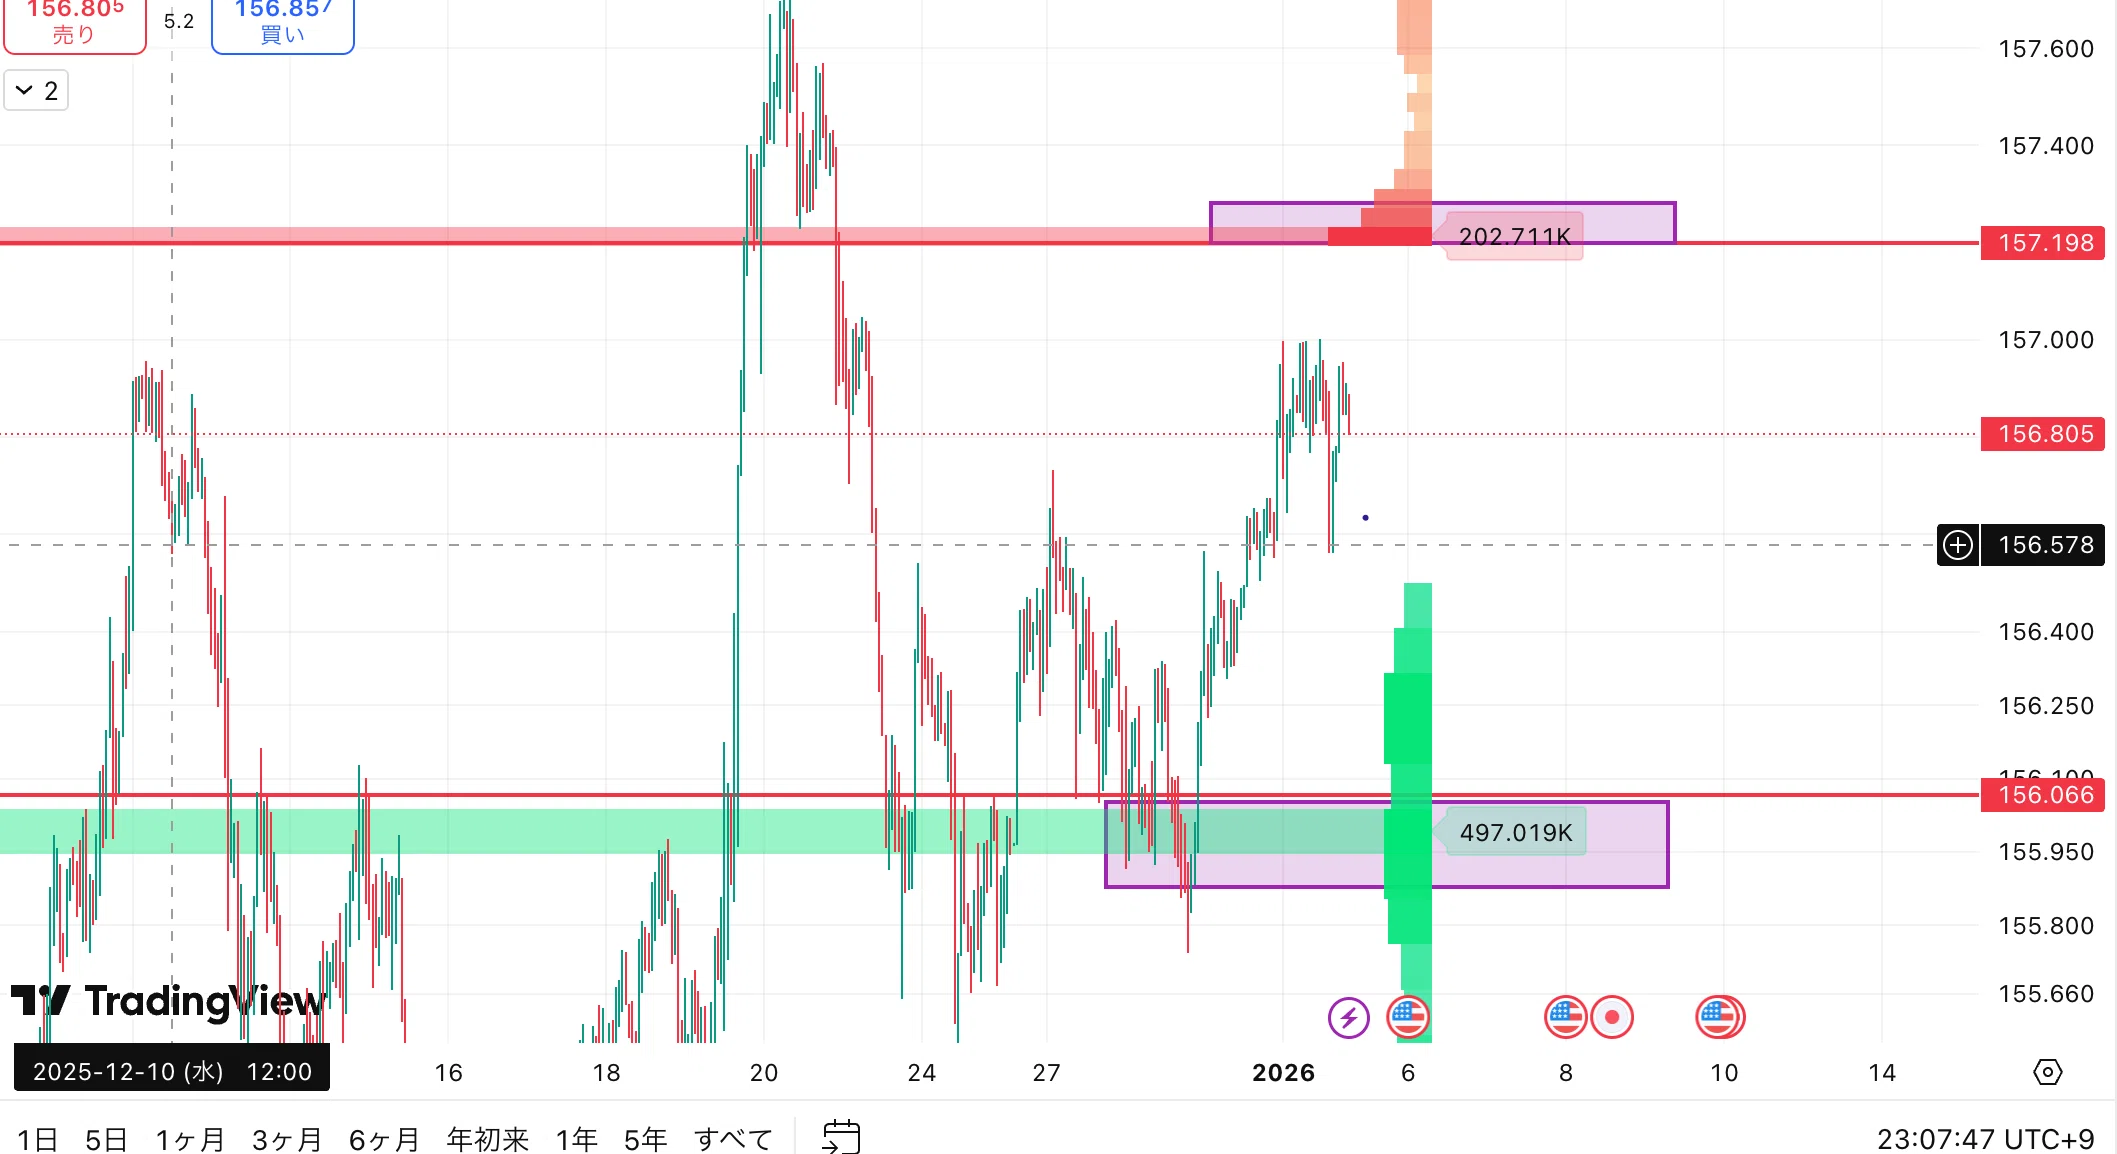
Darker colors indicate higher order concentration
4-3. Identify the Main Battlefield on Higher Time Frames
Trade success hinges 80% on “where you choose to fight.”
Step 1:On higher time frames (1H/4H), identify the thickest HVN in BigBeluga and draw a horizontal zone.
Step 2:Plot a zone across that height.
Step 3:Check if that zone overlaps with OB.
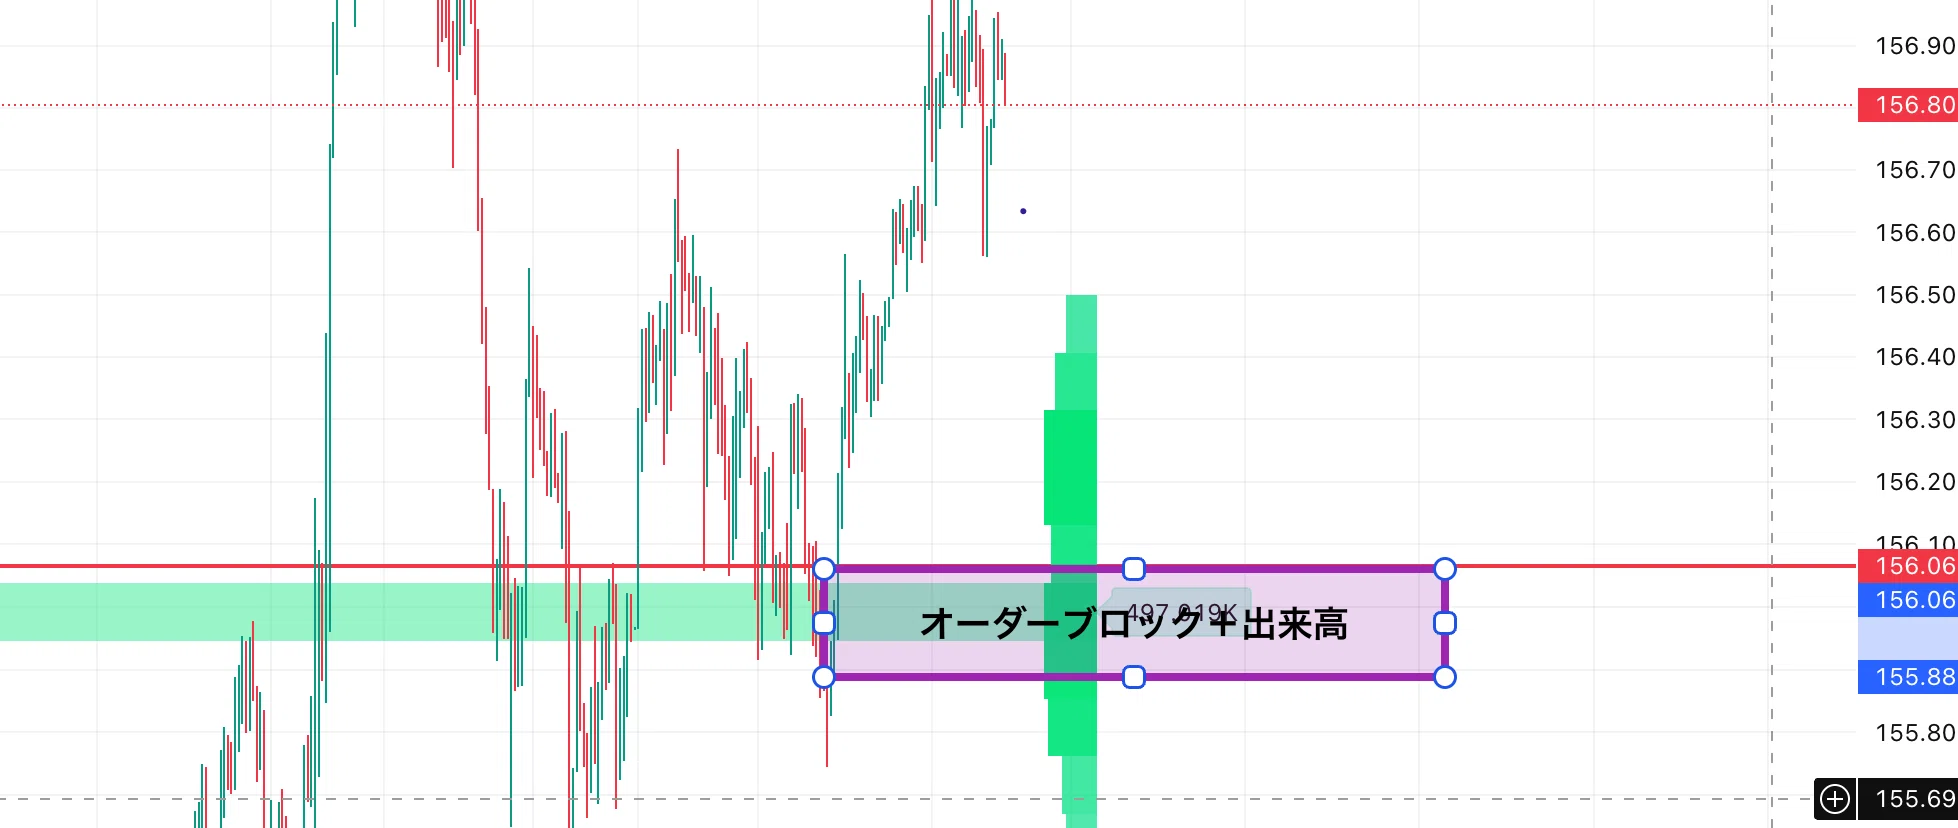
1-hour chart: Drag toward the zone where OB and volume coincide to aim for a long.
As a result, on this day the USD/JPY rose, but large sellers near the upper buy-order concentration zone caused a reversal. The volume mountain functioned as a textbook wall.
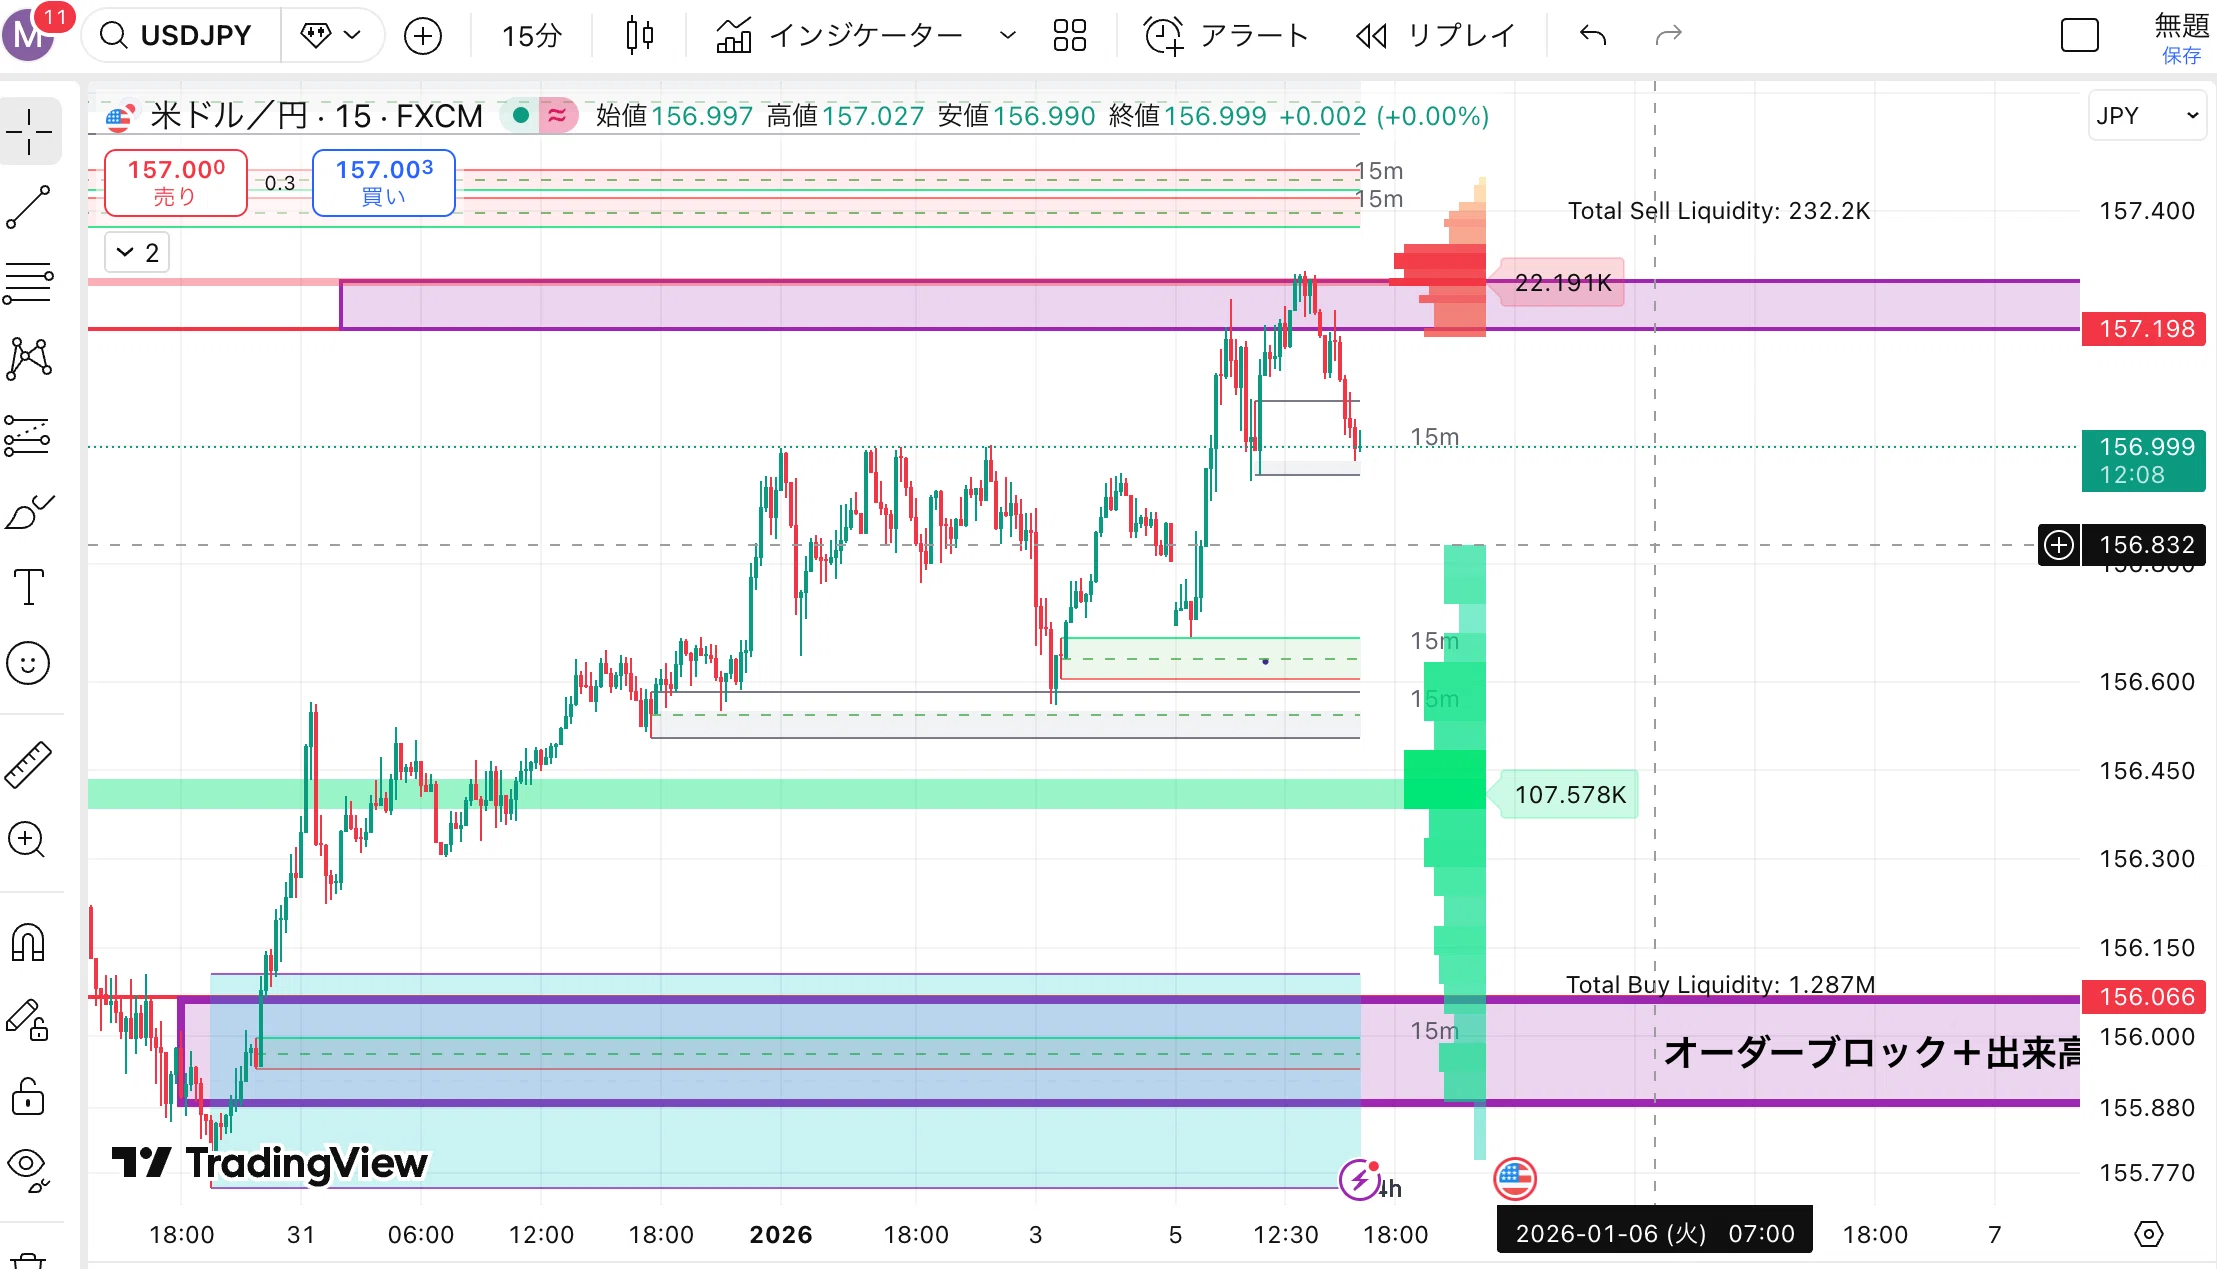
The place where price is bouncing and the dark-colored “mountain” coincide
Chapter 5: Execution Procedure — The Triumvirate Trigger from 4H to 5-Minute
5-1. The Truth of Multi-Timeframe
What we seek is—“the moment the lower timeframe signal appears inside the cushion (wall) of the higher timeframe.”This temporal confluence is the dominant source of advantage.
5-2. The Three Steps of Execution
Step 1: Identify the “Main Battlefield” on 4H/1H
Step 2: Confirm Alignment on 15-Minute
Use it to confirm whether the 15-minute OB overlaps with Step 1’s volume mountain.
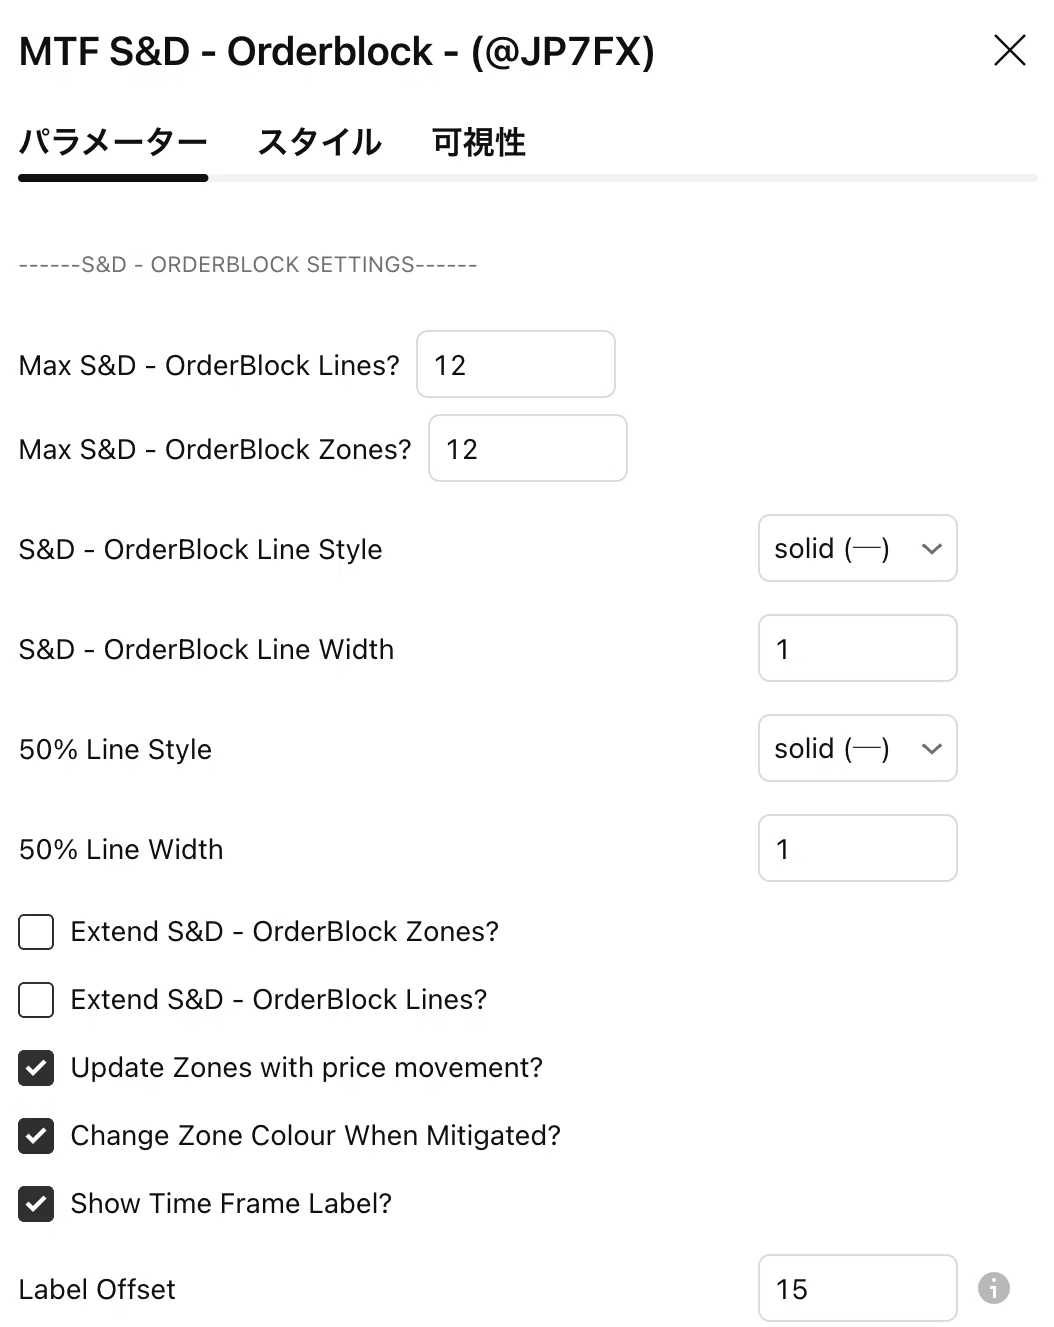
Search for indicators on TradingView
Settings:TIMEFRAME 2 set to “4h.” The 15-minute and 4-hour OBs are visible simultaneously on the chart.
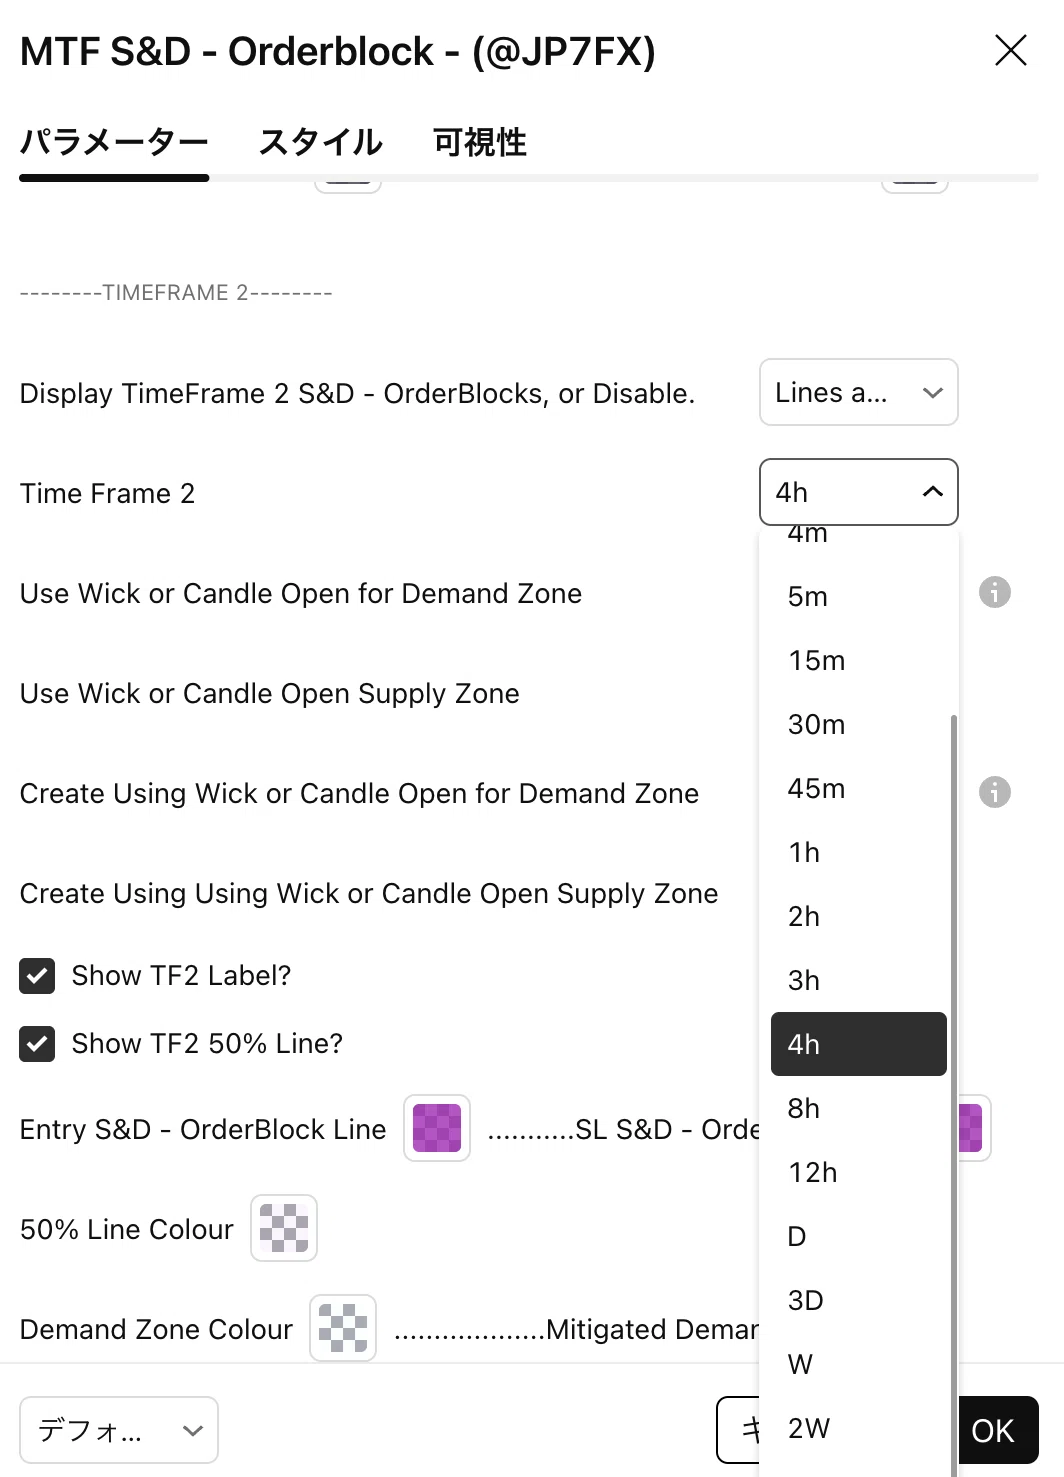
Set TIMEFRAME 2 to 4h
Step 3: 5-Minute — See Through the Last Trap with Wyckoff Theory
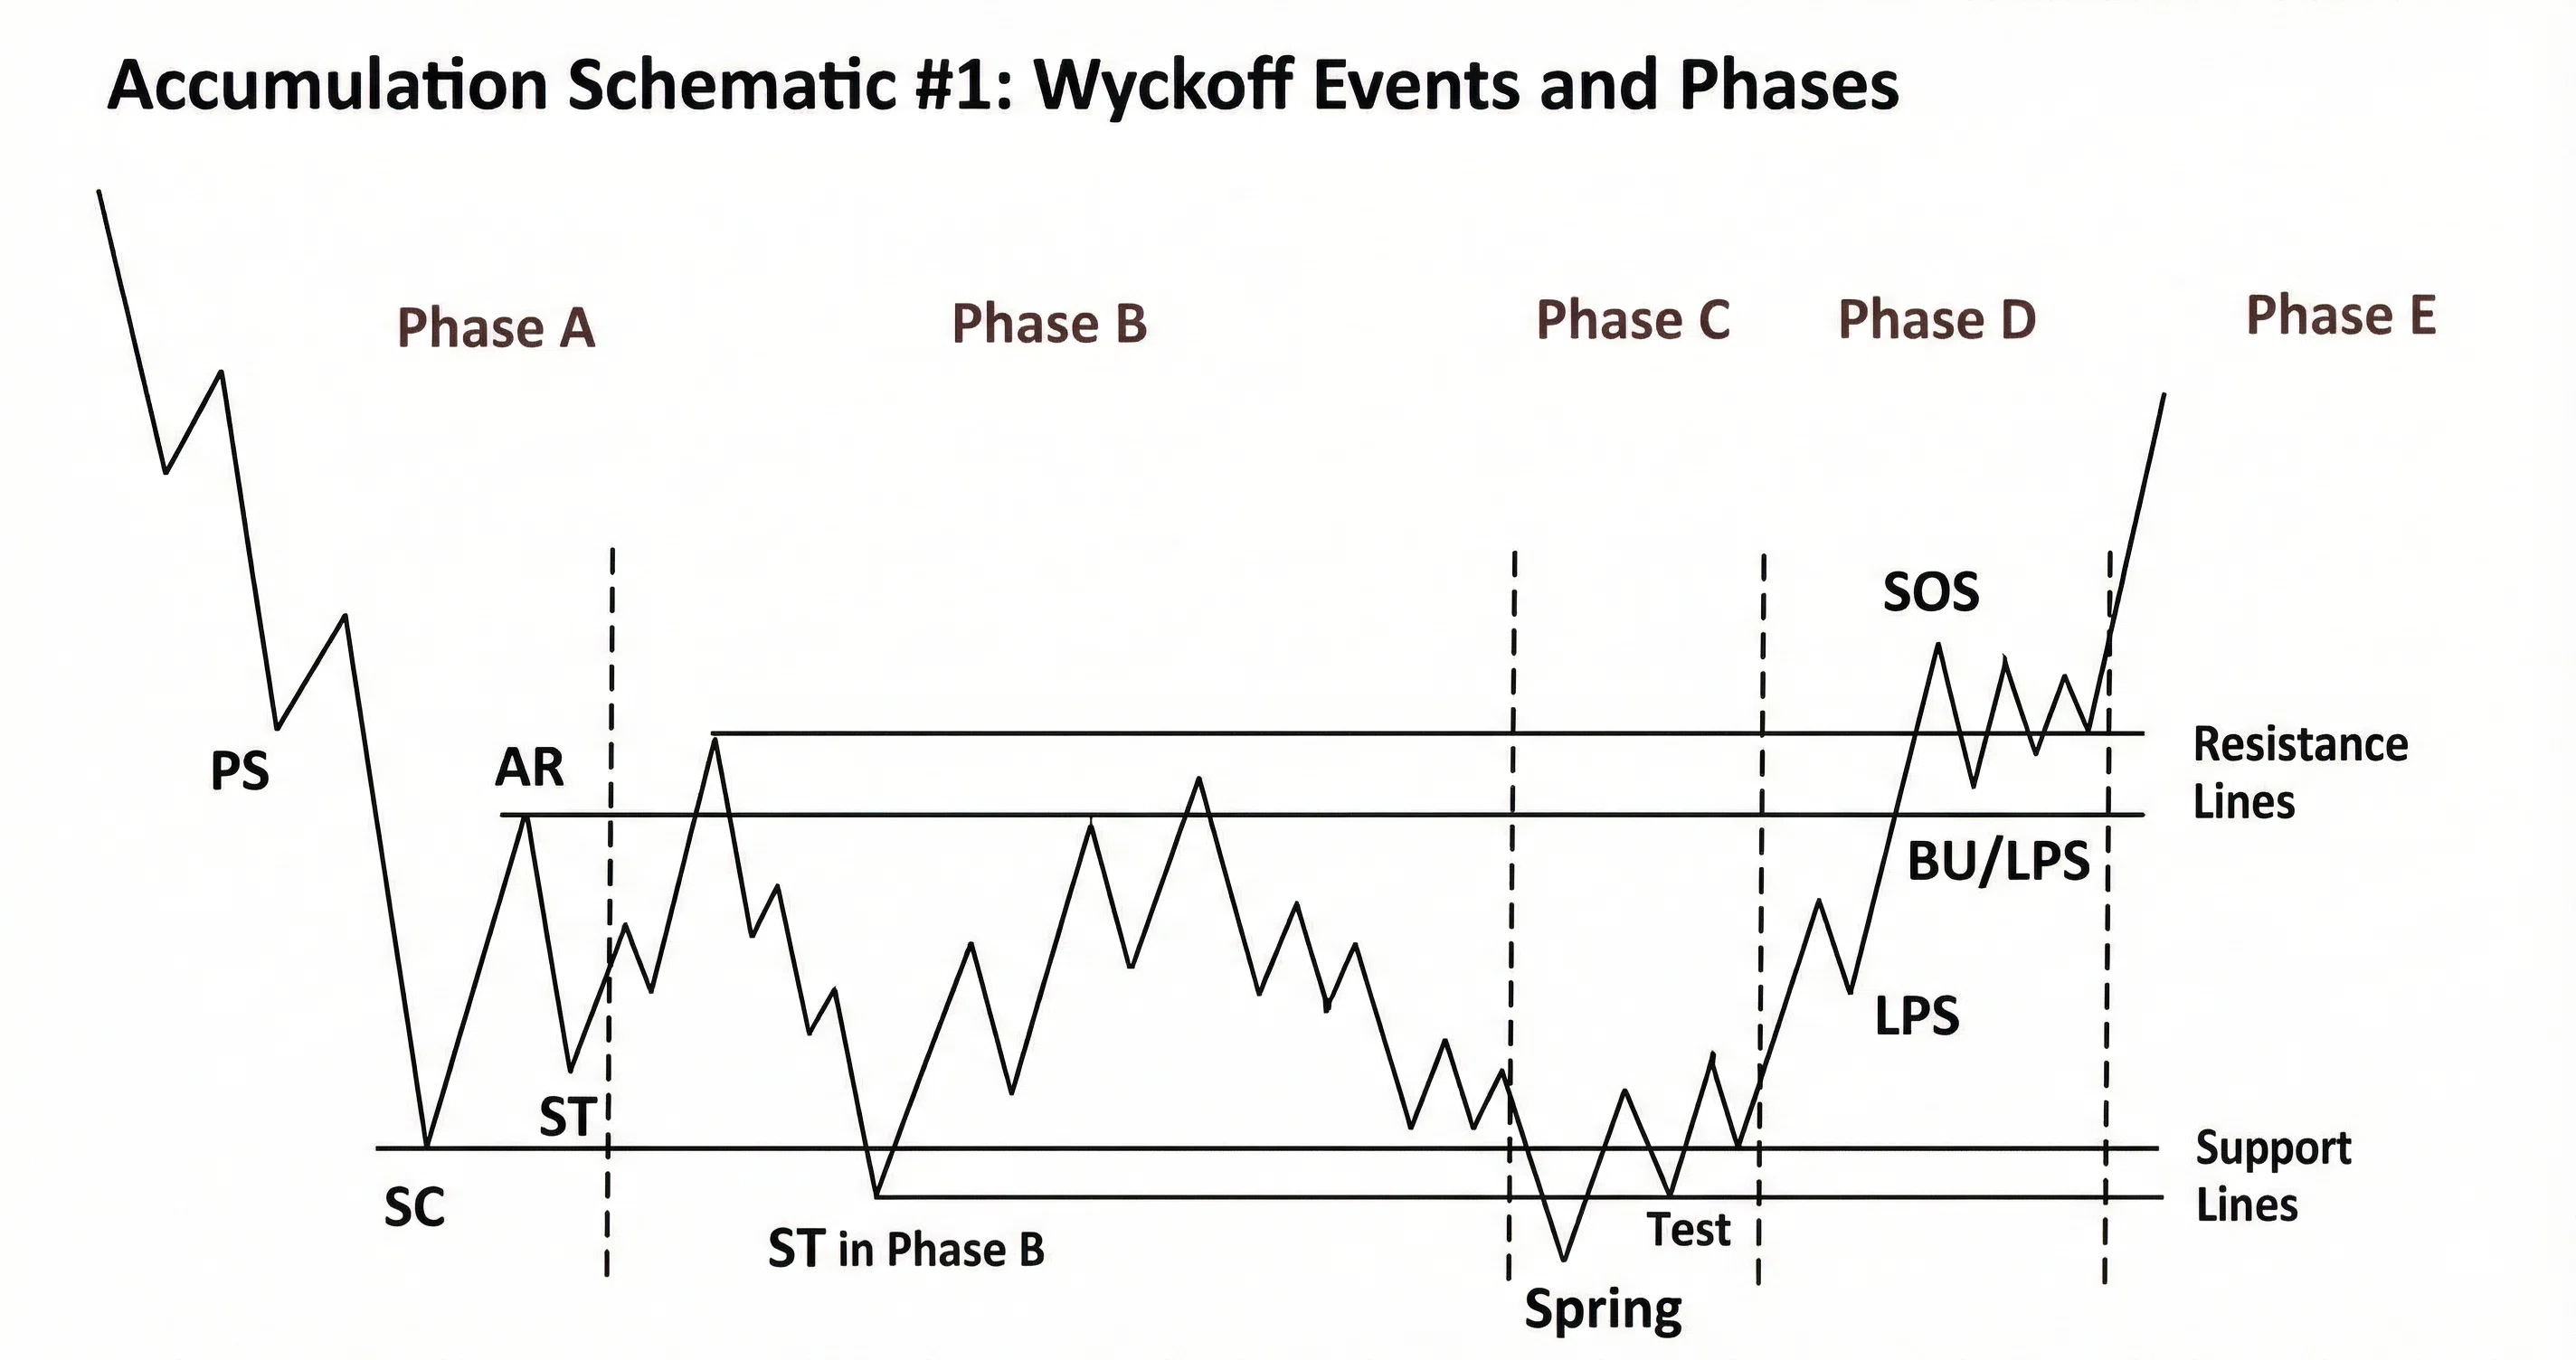
Wyckoff Theory reference diagram
| Phase | Content | Your Action |
|---|---|---|
| A | ||
| B | ||
| C | Spring:A final trap where price briefly makes a new low and stops are forced | |
| D | ||
| E |
Fad’s Check Point:“The price fell to a new low, yet quickly rebounded with strength”—evidence that selling pressure has dried up. The moment this deception is confirmed is the ultimate entry point for tight stops.
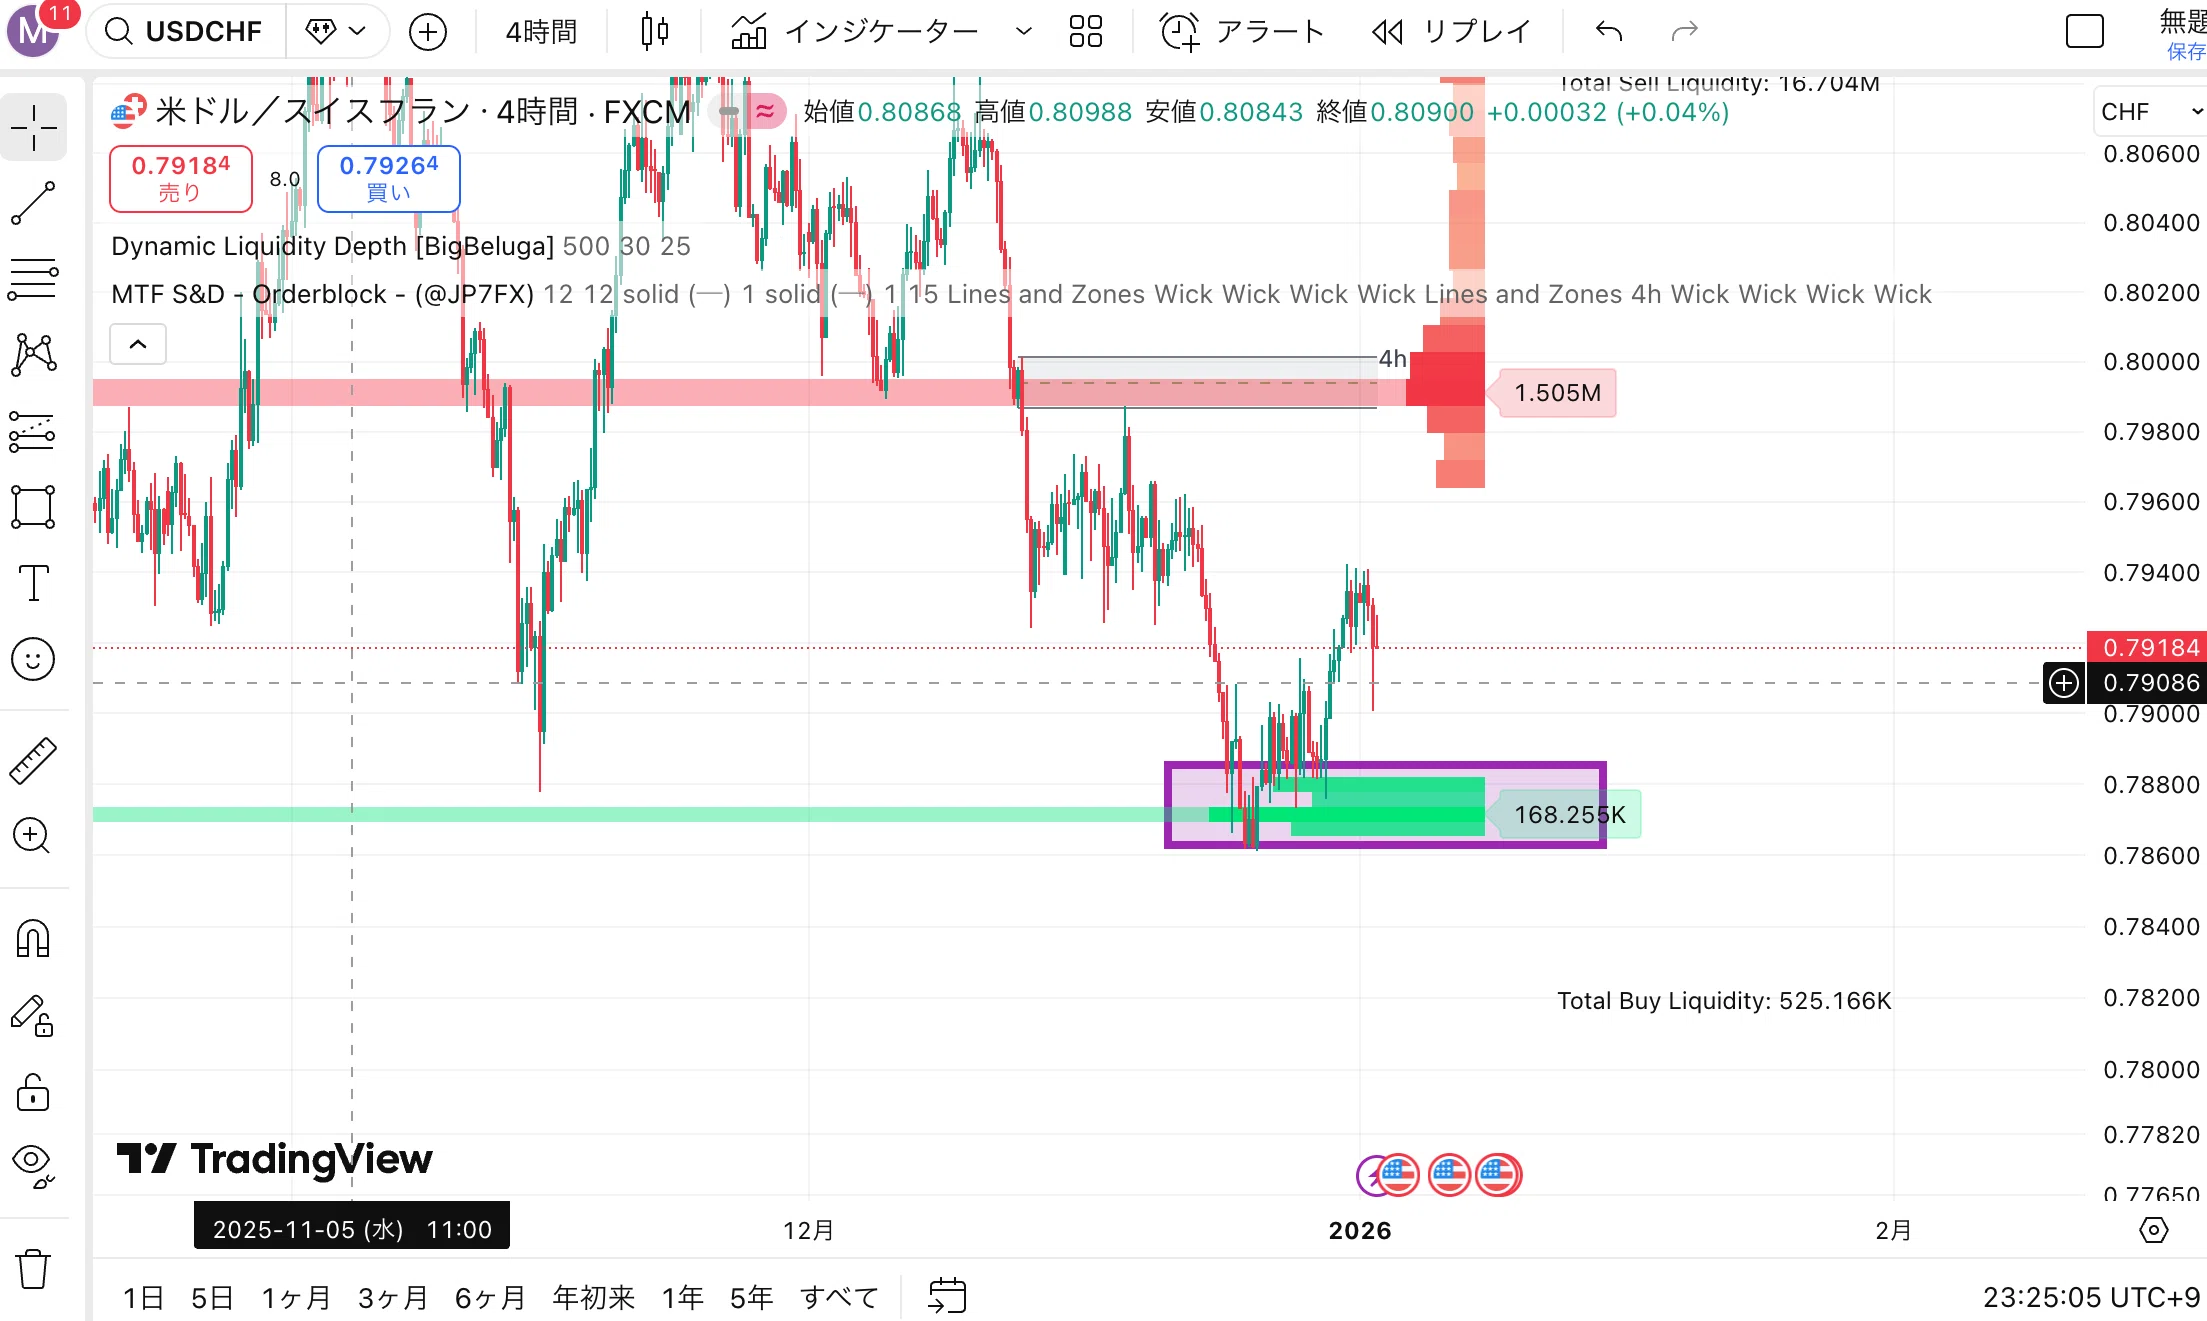
4-hour: The purple area shows OB and volume overlap
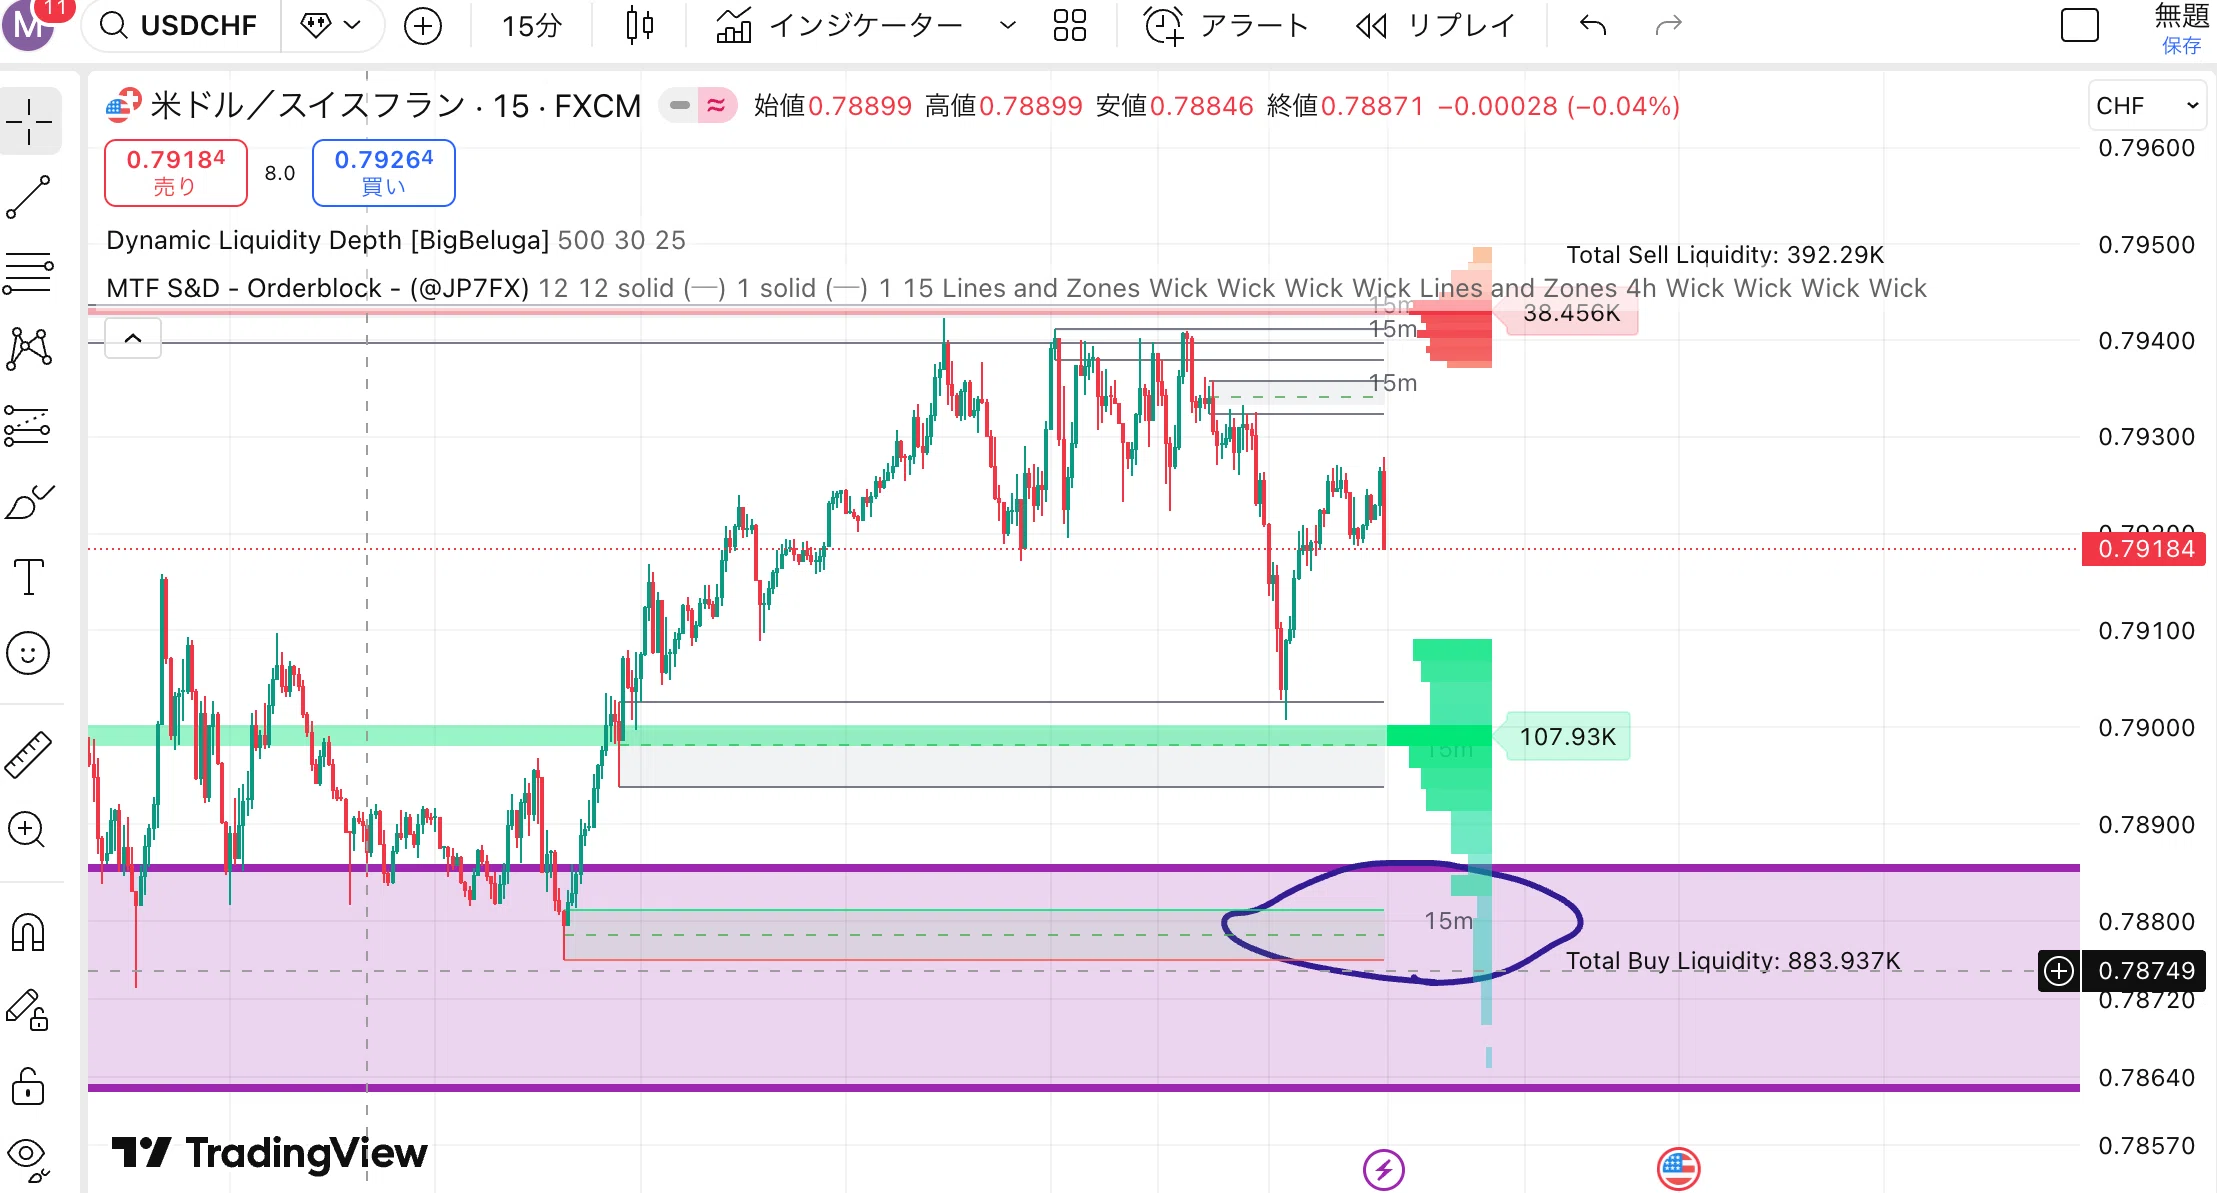
15-minute: Confirm OB within the purple zone. Entry is ideal here
Wait for an inverted head-and-shoulders pattern on the 5-minute chart.Wait for a head-and-shoulders pattern on the 5-minute chart. If a trend reversal can be confirmed on the 5-minute level, enter.
5-3. Structural Placement of Stop-Loss and Take-Profit
Outside the Final Defense OB. If breached by the body, the scenario collapses → immediate exit.
Just before the next volume mountain (HVN) or the 50% of the unfilled FVG (CE).
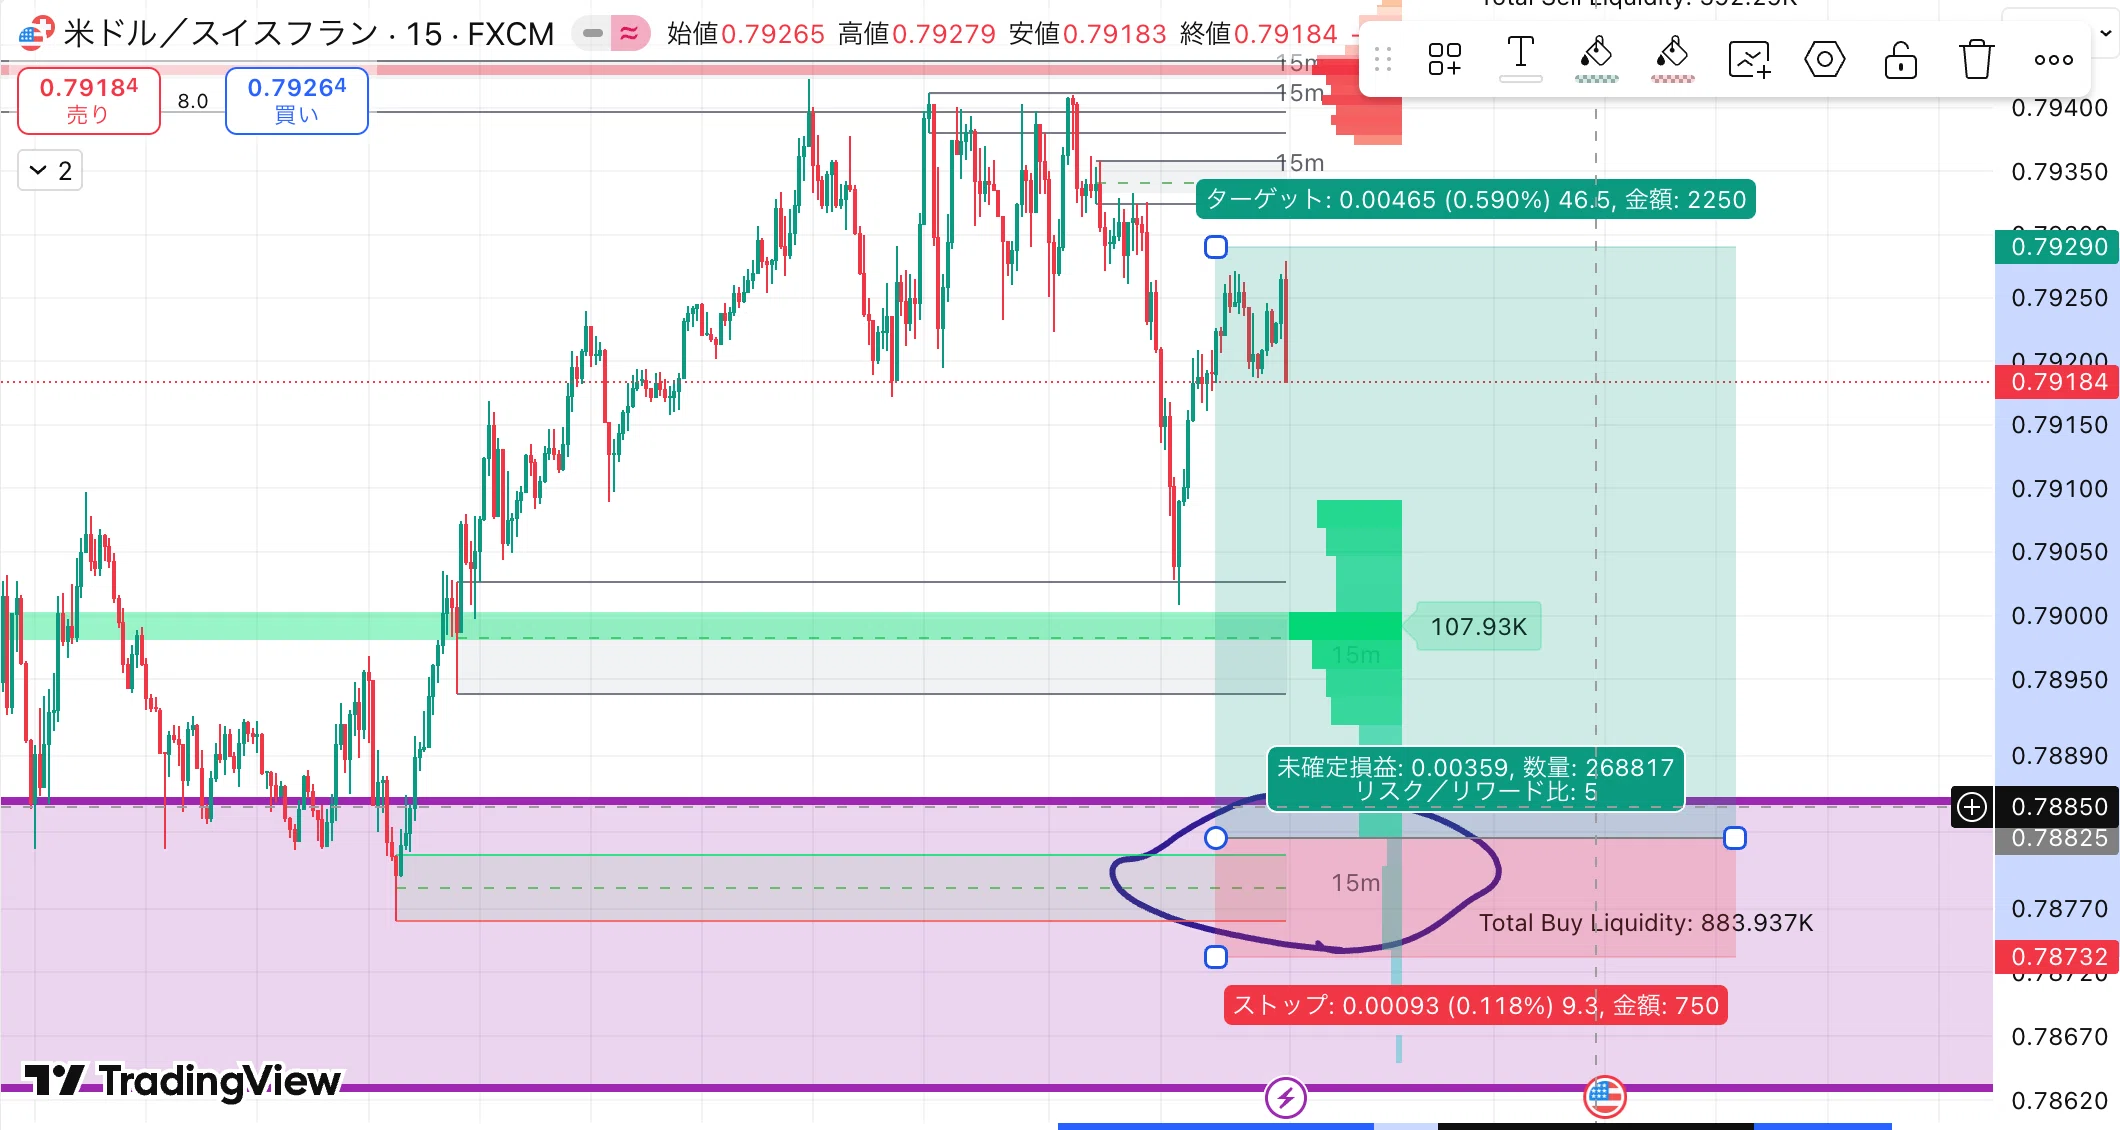
RR 1:5 is a structural value derived from OB thickness and the distance to the volume mountain
Until you’re comfortable, splitting profits (1:2, then 1:5 for the remainder) is effective to lock in wins while extending profit potential.
Chapter 6: Practical Case Studies and Maximizing Expectation
6-1. [Success Story] The Perfect Scenario Triggered by a Volume Mountain
- Environment recognition (4H):Identify a large green mountain of resistance repeatedly rebounding with BigBeluga
- Synchronization (15M):MTF S&D draws a strong buy OB overlapping the 4H volume mountain
- Execution (5M):Spring occurs → inverted head-and-shoulders form. Right shoulder volume declines, confirming fading selling pressure
- Result:Stop loss at OB lower edge, target the next HVN →Take profit at RR 1:5
6-2. [Failure Case] Why Did a “Clean OB” Punch Through?
| Missing Conditions | What Happens |
|---|---|
| Liquidity Sweep did not occur | No serious participation by institutions |
| Volume mountain is sparse | No real depth of orders |
| Market Structure Shift incomplete | Trend reversal not confirmed |
| OB has been retested multiple times | Remaining orders consumed, rebound power drained |
6-3. Expectation Mathematics
10 trades (30% win rate, RR 1:5):
7 losses × 1R = −7R
3 wins × 5R = +15R
Net profit = +8R — you won’t be rattled by a few losses. Mathematics supports this.
6-4. Turning This教材 into a Golden Hammer is Your Discipline
Knowledge must be converted into action, or it’s just symbols.
Step 1 — Backtesting:On BigBeluga’s hills and OB overlap locations, verify at least 100 five-minute reversal patterns.
Step 2 — Live Practice:Practice waiting with the smallest lot. Don’t move your hands until the zone forms or the pattern appears.
Step 3 — Instilling Discipline:For each trade, check whether all three conditions aligned. An entry that doesn’t align is a bad trade even if it wins.
If you have mastered the physics of the market, you no longer need doubt. Ride on the giants’ backs and quietly and surely seize profits.
【Refund Policy】
Because this is a digital product, returns, refunds, or cancellations are not accepted after purchase.
【Notes on Investment Advice】
This教材 is educational content, not investment advice. Please make investment decisions at your own risk and responsibility.
Read the intentions behind the market and ride on the giants’ backs.
May your turning point in trading begin today, starting here.