

Gold Analysis on 2026/05/28
【Daily chart】
It was a bearish candlestick. The lower shadow is long.
It rebounded near a downtrend channel, but since it is a bearish candlestick, the outlook is bearish.
【4-hour chart】
Since it is temporarily in a rebound, if you’re going to sell, it might be better to start during the New York session.
Even if a bearish candlestick appears in Japanese time, a trend-following move on the lower time frame is possible.
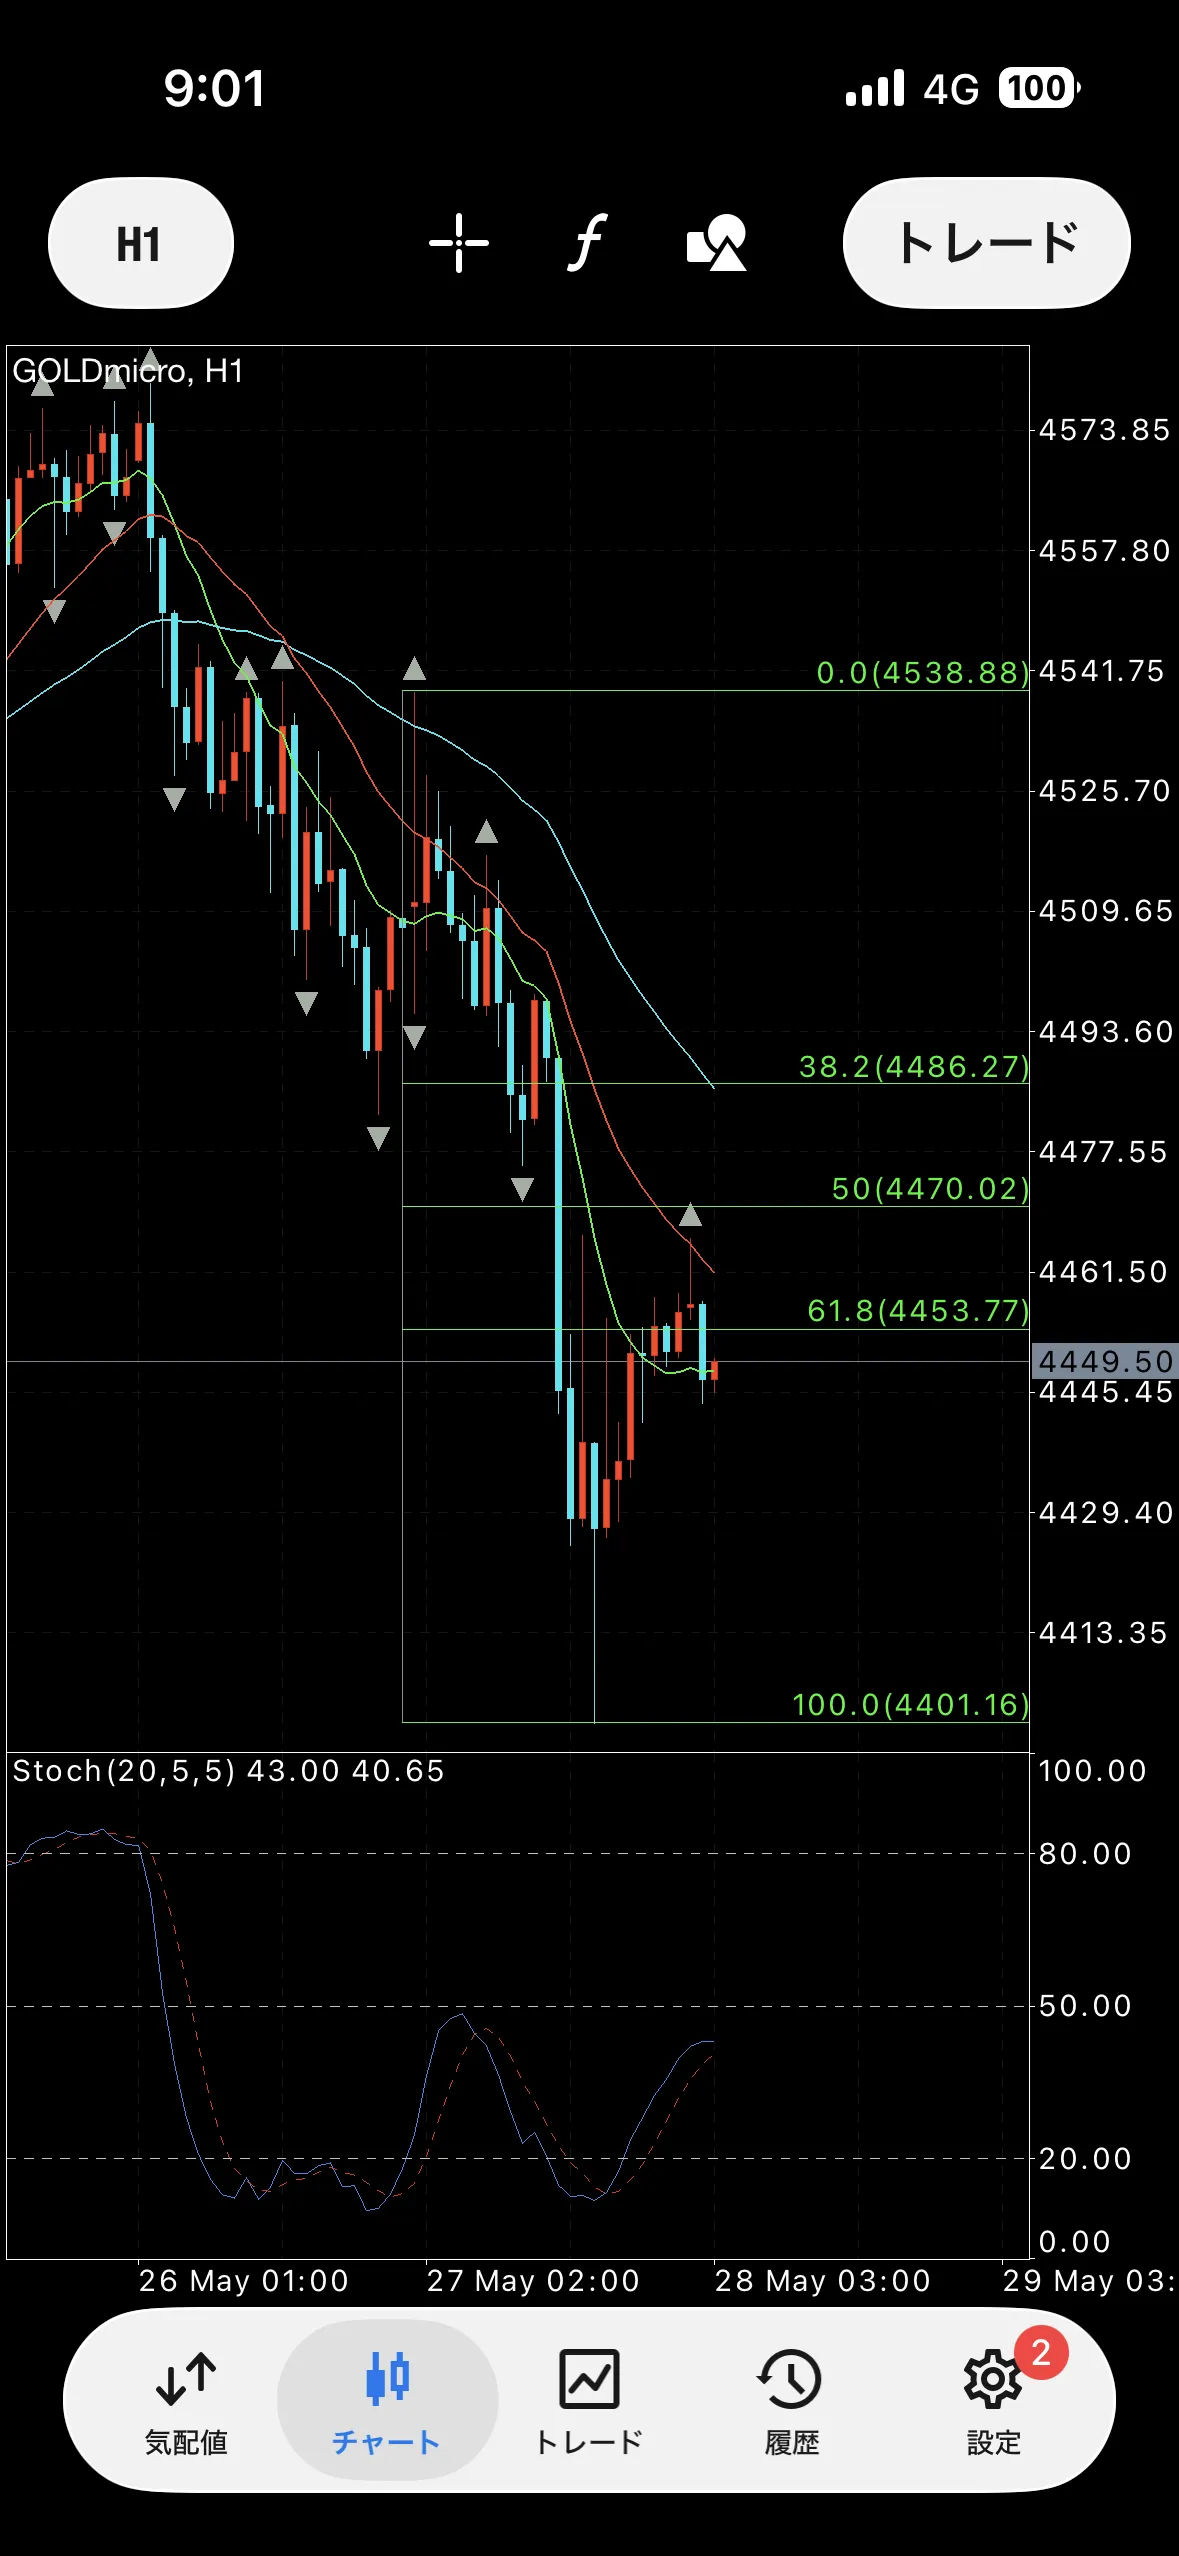
【1-hour chart】
Since it appears to break the neckline of the head-and-shoulders pattern, if measured equally, a decline to 4396 is expected, having almost captured the full price range...
For now, waiting to see if it moves upward is also an option.
【Sell defense lines】
4453
4470
4486
【Buy defense lines】
4401
4348
4316