
If we must call it technical analysis specifically
Gogojan Chief Akawa and my dialogue VTR can be viewed here
Good morning everyone.
Yesterday the Nikkei rose again.
It will probably reach 70,000 yen, right ^^
Since just after the Lehman Shock, it’s about 10 times the price.
If you had invested 100 million yen back then, would it be 1 billion now??
About 17 years ago, if you could put 100 million yen into FX and you were good, it wouldn’t be a matter of tens of billions.
This is true.
There are FX super traders.
I can’t write the details, but about eight years ago, starting with 30 million yen in a domestic account, after three years the account balance exceeded 1 billion yen.
Probably such people operate with multiple accounts, so 3 billion or so is common.
They truly exist.
FX traders are more amazing than stock traders ^^
Both funds and skill are top-class
If I write like this, you might think they use some special method, but that’s not the case.
From my reading of his trading history, I don’t know if it’s trend-following or counter-trend, but probably he’s doing counter-trend entries at key points on the 4-hour and 1-hour charts.
I think he looks at the 1-minute and 5-minute charts, but for freeze protection probably uses 5-minute.
Besides that, it’s a matter of how many trades he makes across about four pairs; the total determines win or loss.
If you read this much, you’ll understand the issue of frequency and stop-loss costs.
In simple terms, “The shot may be bad, but if you fire enough you’ll hit.”
I’m not sure if it’s helpful, but it’s what Japan’s top super trader does, so there’s value in evaluating it.
Now, the USD/JPY daily chart
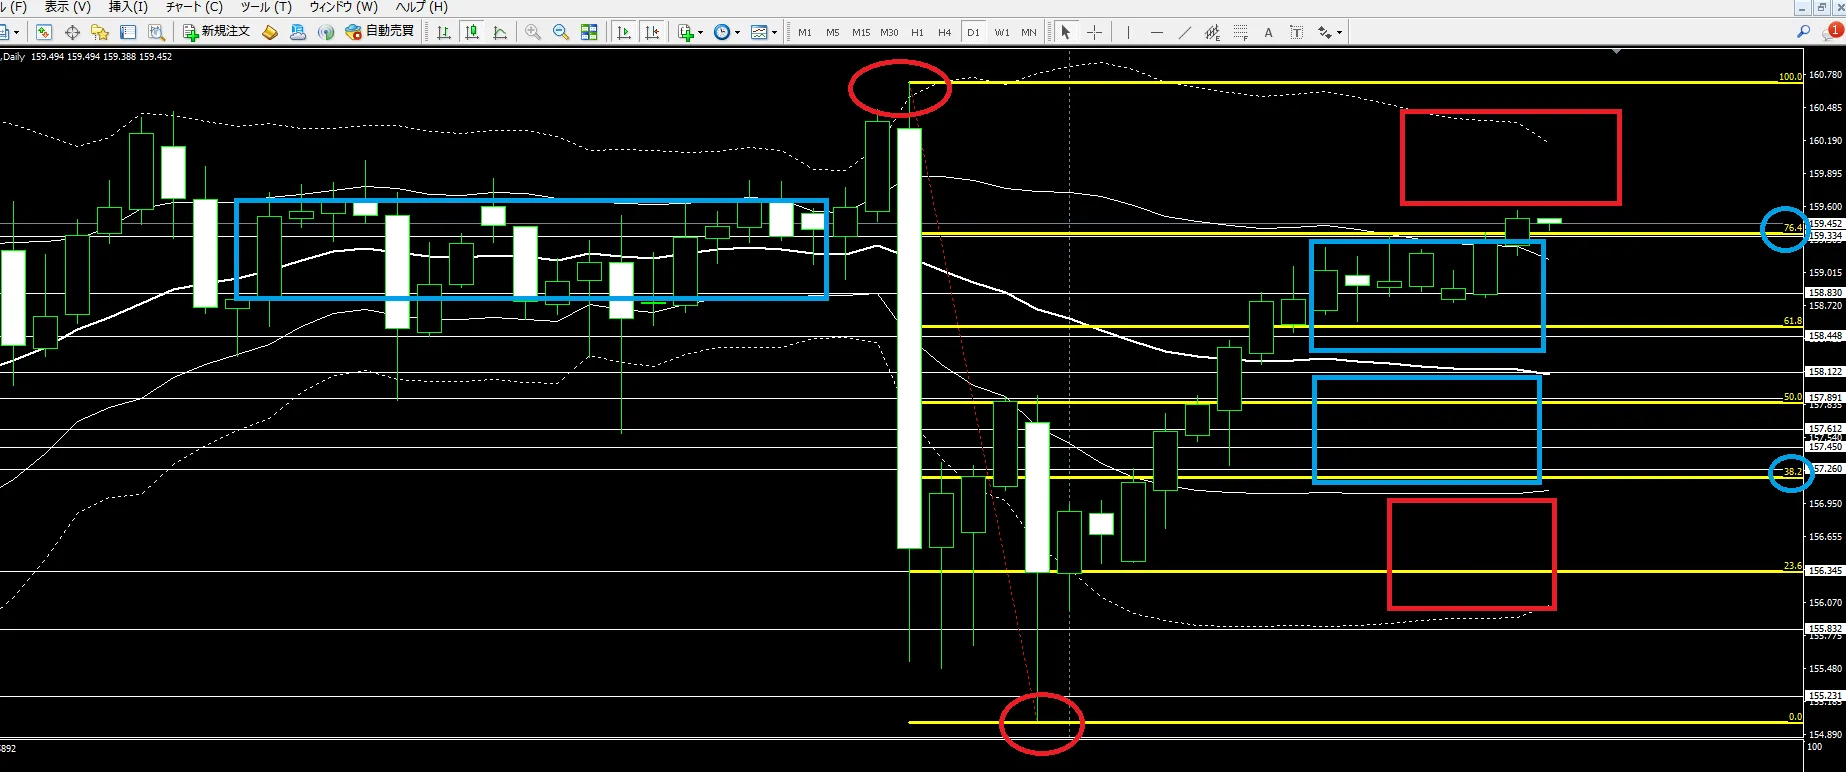
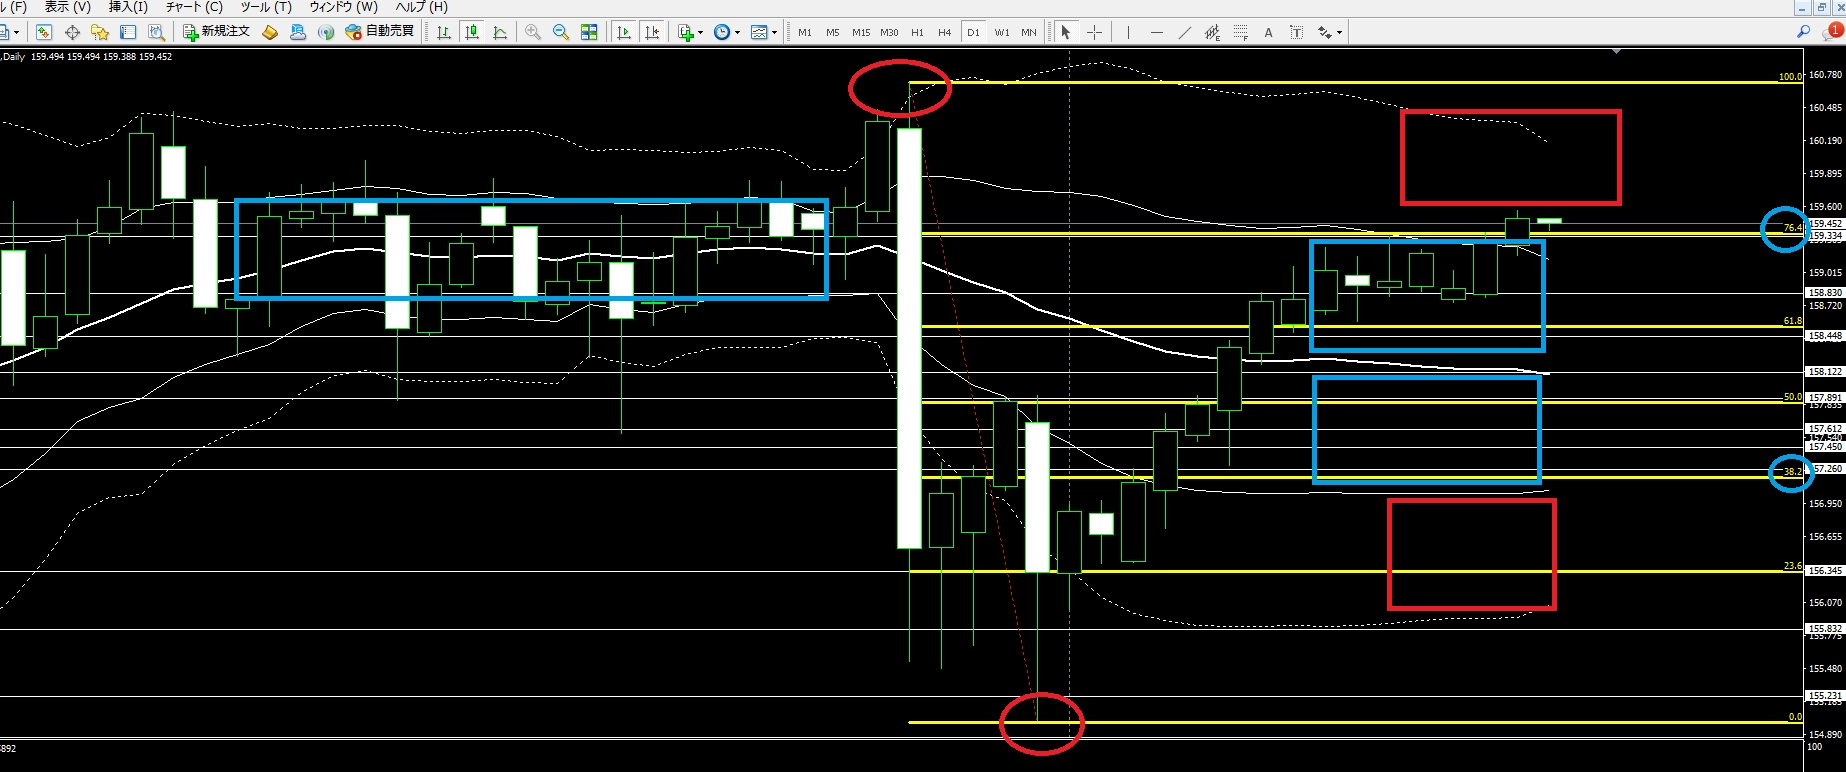
In the past articles described the daily range of USD/JPY as 1 yen or 1.5 yen, but recently the range is around 30 sen or so, which is modest.
Isn’t that unusual in recent years?
It’s almost like the Lehman Shock months earlier, in terms of range and movement.
Aside from the range, I want to discuss a technical indicator I always look at on the daily chart.
Before that, I should add that the Millionaire Trader Chart forms the base for other technicals.
Millionaire Trader Chart recognizes buy/sell reversals and can pre-know future breakout outlines.
Users probably already understand.
Fib is less precise than the Millionaire Trader Line, which is why ^^
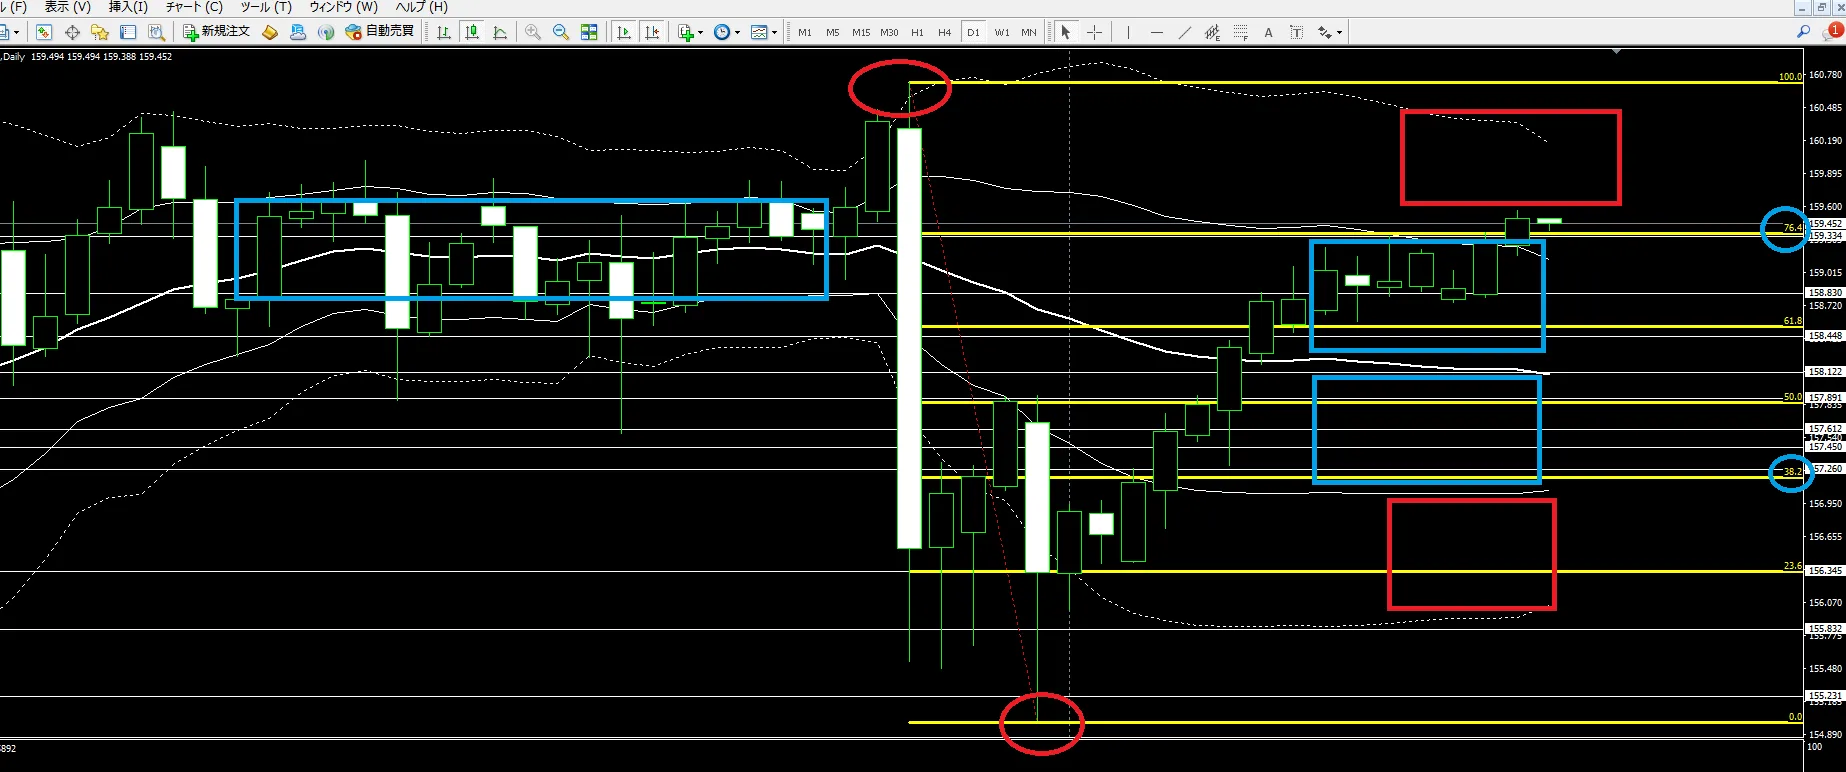
The image shows a decline from recent yen-buy interventions and a rebound applied with Fibonacci.
B-band is at plus/minus 1 or 2
On long-term charts it looks like this, and on 1-minute charts it’s only the Millionaire Trader Chart.
I’m imagining the big picture on the long-term chart.
To put it bluntly, on any time frame you can think similarly if you break through Fibonacci.
I will write down that thinking.
When prices stay within the B-band 1, like the blue square, movement is not good and it’s a range.
When they exceed B1 into B2 as in the red square, prices start moving.
In other words, volatility has appeared.
The technical judgments are at this level, and I keep watching and waiting mostly on the Millionaire Trader Chart and Money-Tre Line.
Regarding Fibonacci, 76.4 and 38.3 are important and tend to lead to reversals or breakouts.
That said, this is just a tendency, so don’t take it at face value.
Even if those two are points, I don’t chase movements aiming for them.
I only consider it after the price reaches them.
To return to the discussion, about the super trader I mentioned earlier.
If this daily chart were an hourly or 4-hour chart.
The wicks at the red circled points below and the three wicks to the left,
you could say he’s waiting there and aiming for it, haha.
People like me are ordinary and don’t have reflexes like that, and with presbyopia it’s hard to aim by mood, and doing 100 trades per day per X4 pairs as a routine or aiming with “boom-lri” is quite difficult...
Therefore
Today I’ve written an extremely helpful hint
Thank you for your continued support today as well.
Anyway, for traders who want to succeed in trading and make a living from it, this is my recommended product, a skill you can learn on your own: